

Abstract
Chronic intermittent hypoxia (CIH) is a concomitant of sleep apnea that produces a slowly developing chemosensory-dependent blood pressure elevation ascribed in part to NMDA receptor-dependent plasticity and reduced nitric oxide (NO) signaling in the carotid body. The hypothalamic paraventricular nucleus (PVN) is responsive to hypoxic stress and also contains neurons that express NMDA receptors and neuronal nitric oxide synthase (nNOS). We tested the hypothesis that extended (35 d) CIH results in a decrease in the surface/synaptic availability of the essential NMDA NR1 subunit in nNOS-containing neurons and NMDA-induced NO production in the PVN of mice. As compared with controls, the 35 d CIH-exposed mice showed a significant increase in blood pressure and an increased density of NR1 immunogold particles located in the cytoplasm of nNOS-containing dendrites. Neither of these between-group differences was seen after 14 d, even though there was already a reduction in the NR1 plasmalemmal density at this time point. Patch-clamp recording of PVN neurons in slices showed a significant reduction in NMDA currents after either 14 or 35 d exposure to CIH compared with sham controls. In contrast, NO production, as measured by the NO-sensitive fluorescent dye 4-amino-5-methylamino-2′,7′-difluorofluorescein, was suppressed only in the 35 d CIH group. We conclude that CIH produces a reduction in the surface/synaptic targeting of NR1 in nNOS neurons and decreases NMDA receptor-mediated currents in the PVN before the emergence of hypertension, the development of which may be enabled by suppression of NO signaling in this brain region.
Introduction
Chronic intermittent hypoxia (CIH), resulting from sleep-disordered breathing with recurrent apneas, is associated with enhancement of sympathetic nerve activity and a slowly developing elevation in arterial blood pressure. Such effects are ascribed in part to heightened sensitivity of the carotid body response to hypoxia (Fletcher, 2003; Prabhakar et al., 2007). Carotid chemoreceptor afferents make their first synaptic contacts with neurons within the nucleus of the solitary tract, a brain region that relays information to the hypothalamic paraventricular nucleus (PVN) and brainstem sympathoexcitatory sites (Sawchenko et al., 1996; Herman and Cullinan, 1997). The PVN is critical for cardiovascular regulation (Benarroch, 2005; Kawabe et al., 2008) and is responsive to hypoxic stress (Chen et al., 2004). Little is known, however, about the effects of CIH on neuronal excitability in this forebrain nucleus.
Neuronal activity in the PVN is regulated by glutamate and other excitatory, as well as inhibitory, neurotransmitters and by nitric oxide (NO). Disruption of the delicate balance between these functionally opposed modulators within the PVN has been shown to alter sympathetic tone and contribute to pathological conditions, such as hypertension and heart failure (Zhang et al., 2001; Allen, 2002). The NMDA subtype of glutamate receptors in the PVN plays an important role in regulating outflow from neurohumoral neurons projecting to the pituitary, brainstem, and sympathetic preganglionic neurons in the spinal cord (Martin and Haywood, 1992; Li et al., 2001, 2006; Kawabe et al., 2008). Activation of NMDA receptors in the PVN increases GABAergic inhibitory transmission, an effect facilitated by NO (Bains and Ferguson, 1997). NO is produced by the NMDA receptor-dependent activation of neuronal nitric oxide synthase (nNOS) (Garthwaite, 2008). Direct administration of NO or a NO donor into the PVN decreases sympathetic nerve activity and lowers arterial blood pressure (Horn et al., 1994; Zhang and Patel, 1998). Conversely, inhibition of NO synthesis in the PVN results in sympathoexcitation (Zhang and Patel, 1998).
The NMDA receptor shows activity-dependent plasticity attributed to changes in the surface/synaptic trafficking of the essential NMDA NR1 subunit (Malenka and Nicoll, 1993; Dunah et al., 1999). NMDA receptor-dependent plasticity in the PVN contributes to augmented glutamatergic signaling in spontaneously hypertensive rats (Li et al., 2008), but it is not known whether this blood pressure elevation specifically relates to production of NO (DiCarlo et al., 2002) or whether similar adaptations contribute to CIH-induced hypertension. We tested the hypothesis that CIH reduces the surface/synaptic availability of NMDA NR1 in nNOS-containing neurons, NMDA receptor-mediated currents, and NO signaling in the PVN. This was achieved first by using quantitative electron microscopic immunogold labeling for NMDA NR1 and immunoperoxidase detection of nNOS in the PVN of mice exposed or not to CIH for 35 d, a time point at which there is a known CIH-induced increase in blood pressure in rodents. Second, we used patch-clamp recording of PVN neurons in slices and NO-sensitive imaging in dissociated PVN neurons to determine whether 35 d of CIH also affects NMDA currents and/or NO production in the PVN, respectively. The results seen after 35 d of CIH were compared with those occurring after 14 d, a time point at which no significant elevation in blood pressure was observed in the present mouse model.
Materials and Methods
Animals and intermittent hypoxia.
Experimental procedures were conducted in accordance with the National Institutes of Health Guidelines for the Care and Use of Laboratory Animals and approved by the Institutional Animal Care and Use Committees at Weill Cornell Medical College. Adult male C57BL/6 mice (Jackson Laboratory) were randomly divided into CIH or control groups. The average starting weight for the CIH and sham groups was 22.8 ± 0.4 g and 21.9 ± 0.6 g, respectively. The animals in each group were housed together in a modified home cage. A programmed electronic timer system (ChronTrol) controlled solenoid valves that regulated gas delivery to the animal cages. Oxygen (O2) levels within the cage rapidly transitioned from low O2 (10 ± 1%) following nitrogen (N2) infusion, to ambient concentrations (21 ± 1%) following pure O2 infusion. Gas (O2 or N2) was distributed to the cage over a 5 s period every 90 s, resulting in 20 hypoxic episodes per hour. This rate is comparable to the number of oxygen desaturation events that occur in patients with mild to moderate obstructive sleep apnea (OSA) (Boland et al., 2002). O2 levels within the cage were continuously monitored using an O2 sensor (Kent Scientific). The O2 sensor was secured within the cage ∼2 inches above the mice to enable sampling of gas levels experienced by the animals. The cycling of O2 levels occurred for 8 h during the light (sleep) phase (8:00 A.M. to 4:00 P.M.). The control cages used for sham treatment were similar in design but were infused with room air, instead of O2 or N2, every 90 s to maintain O2 concentrations at 20–21%. During the remaining 16 h of the day (4:00 P.M. to 8:00 A.M.), both CIH and control cages were infused with room air. The CIH/control protocol repeated for 14 or 35 d, during which the mice had free access to food and water. Similar body weights were observed between the groups after 14 (CIH, 23.7 ± 0.6 g; sham, 23.6 ± 0.6 g) or 35 (CIH, 25.9 ± 0.7 g; sham, 26.1 ± 0.6 g) days. Ambient temperature was kept at 22–24°C.
Arterial blood-gas and blood pressure measurement.
In one group of mice (n = 6), an arterial catheter was implanted in the carotid artery for sampling of arterial blood. Mice were anesthetized with isoflurane (induction, 2.5%; maintenance, 1.2%; delivered in 100% O2). The artery was exposed through a small incision (∼1 cm). A catheter was inserted 2–5 mm into the artery and secured with nontoxic glue. The catheter tubing was routed under the skin to exit through an incision made on the dorsal surface of the neck. The incisions were sutured closed. Heparin-saline solution was used to prevent blockage of the tubing. The animals were allowed to recover overnight.
The next day, the mice were placed individually into modified cages connected to the CIH system. Arterial blood gases (pO2 and pCO2) and pH were assessed under three conditions in each conscious, unrestrained mouse (room air, 10% O2 for 90 s, and room air for 90 s). Arterial blood samples (30 μl) were collected in a capillary tube at the end of each sequential condition and immediately analyzed using a blood-gas analyzer (Chiron Diagnostics). At the end of the experiment, mice were killed by CO2 overdose.
In a second group of mice, subjected to CIH (n = 4) or sham treatment (n = 4) for 35 d, mean arterial pressure (MAP) was monitored through a carotid arterial catheter inserted as described above. One day after the procedure, MAP was recorded for 30 min using a pressure transducer connected to a data acquisition system (MacLab).
In additional groups of mice, systolic blood pressure was measured by a noninvasive tail cuff system (Model MC4000; Hatteras Instruments). Blood pressure measurements were obtained on the final day of exposure to CIH (14 d, n = 5 mice; 35 d, n = 10 mice) or sham treatment (14 d, n = 5 mice; 35 d, n = 10 mice). Ten systolic blood pressure measurements were taken in each mouse over a 20 min session. The averaged values for each animal were combined to determine the mean group systolic blood pressure.
Vasopressin immunoassay.
CIH (n = 5) and sham-treated (n = 5) mice were deeply anesthetized and 500 μl of trunk blood was collected in polypropylene tubes containing 5 μl of each 500 mm EDTA and 1 mg/ml aprotinin. Plasma was acidified with 1/10 volume of 1N HCl and clarified by centrifugation. Acidified plasma was loaded on phenyl-bonded SPE columns (Varian) and bound peptides were eluted with methanol containing 0.5% (v/v) of 1N HCl. Eluates were dried under vacuum and vasopressin was determined using a commercially available enzyme immunoassay according to manufacturers recommendation (Cayman Chemicals).
Antisera.
A commercial mouse monoclonal antiserum (catalog #610309; BD Transduction Laboratories) was generated against a sequence at the C-terminal (amino acids 1095–1289) of human nNOS. Western blot analysis has shown that this affinity purified antiserum recognizes a single band of ∼155 kDa, corresponding to the molecular weight of nNOS (Togashi et al., 1997; Rameau et al., 2004). Immunohistochemical techniques have demonstrated that this antiserum specifically labels nNOS in cells transfected with the nNOS gene (Yu et al., 2000).
A rabbit polyclonal antiserum (catalog #AB1516; Millipore Bioscience Research Reagents) raised against a 30 (909–938) amino acid peptide corresponding to the C terminus of rat NR1 was obtained commercially. Immunohistochemical labeling with this antiserum is similar to brain distribution of NR1 mRNA, as determined by in situ hybridization. The specificity of the NR1 antiserum has been validated in cells transfected with NR1 cDNA, showing that labeling is found with the NR1 antiserum but not with antiserum preadsorbed with the antigenic peptide (Petralia et al., 1994). Moreover, there is a brain region-specific loss of NR1 labeling with this antiserum in mice with spatial–temporal deletion of the NR1 gene (Glass et al., 2008).
Tissue preparation and immunohistochemistry.
Mice were deeply anesthetized with sodium pentobarbital (100 mg/kg, i.p.) and perfused through the left ventricle of the heart sequentially with 5–10 ml of heparin-saline, 30 ml of 3.75% acrolein in 2% paraformaldehyde, and 100 ml of 2% paraformaldehyde in 0.1 m phosphate buffer (PB; pH 7.4). Experimental (14 d, n = 5; 35 d, n = 5) and sham-treated (14 d, n = 5; 35 d, n = 5) animals were perfused with the same batch of solutions. The brains were removed from the cranium, cut into thick coronal slices (∼2 mm) using a mouse brain mold, and postfixed in 2% paraformaldehyde for 30 min at room temperature. The tissue was then cut into 40 μm coronal sections using a vibratome (Leica Microsystems) and stored at −20°C in cryoprotectant solution (30% sucrose, 30% ethylene glycol, and 0.05 m PB, pH 7.4) until processed for immunolabeling.
Coronal sections of tissue containing the PVN from CIH and sham-treated mice were selected and coprocessed using a pre-embedding dual immunolabeling protocol, adapted from Chan et al. (1990), for the detection of nNOS (immunoperoxidase) and NR1 (immunogold). Coprocessing enabled quantitative comparisons between experimental and control (sham-treated) groups in brain tissue having identical exposure to immunoreagents. The matched experimental and control sections were uniquely hole punched to permit pooling of the tissue. To neutralize reactive aldehydes, the acrolein-fixed tissue sections were first placed in 1% sodium borohydride in 0.1 m PB for 30 min. The sections were then rinsed with 0.1 m PB, transferred to 0.1 m Tris-buffered saline (TBS; pH 7.6), and incubated for 30 min in 0.5% bovine serum albumin (BSA) in 0.1 m TBS to minimize nonspecific binding of the antisera. The tissue was incubated for 72 h at 4°C in a solution of mouse anti-nNOS (1:200 dilution) and rabbit anti-NR1 (1:100 dilution) antisera in 0.1 m TBS with 0.1% BSA.
For immunoperoxidase detection of nNOS, sections previously incubated in the primary antisera solution were placed in donkey anti-mouse IgG (1:400; Incstar) for 30 min. The sections were then incubated for 30 min in avidin-biotin peroxidase complex (Vector Laboratories). The bound peroxidase was visualized by reaction of the sections for 5–6 min in 3,3′-diaminobenzidine (Sigma-Aldrich) and hydrogen peroxide. Between all incubations, the tissue was rinsed thoroughly with 0.1 m TBS.
For immunogold detection of NR1, tissue sections were rinsed in 0.01 m PBS (pH 7.4) and blocked for 10 min in 0.1% gelatin and 0.8% BSA to reduce nonspecific binding of gold particles. The sections were then placed for 2 h in the secondary antisera solution containing donkey anti-rabbit IgG (1:50 dilution) conjugated with 1 nm colloidal gold (Electron Microscopy Science). The gold particles were fixed to the tissue in 2% glutaraldehyde and the bound silver–gold particles were enhanced using a Silver IntenSEM kit (GE Healthcare) for 6 min.
Tissue sections were postfixed in 2% osmium tetroxide for 1 h and then dehydrated through a series of graded ethanols (30, 50, 70, 95, and 100%) and propylene oxide (100%), and placed in a 50:50 mixture of propylene oxide and Epon (Embed-812 kit; Electron Microscopy Science) overnight. The next day the sections were transferred to 100% Epon for 2 h and flat-embedded between two sheets of Aclar plastic. The flat-embedded tissue was allowed to harden in an oven at 60°C for 48 h.
Electron microscopic sectioning and data analysis.
The flat-embedded tissue containing the PVN (0.82–0.95 mm caudal to bregma) was located using a light microscope. The region was excised, glued to a hardened Epon block, and trimmed to a sufficient size for thin-sectioning. Ultrathin sections were cut with a diamond knife (Diatome) using a Leica EM UC6 ultratome (Leica Microsystems). Once excess embedding material was removed and tissue was visualized at the surface, sections (70 nm thickness) were collected on 400-mesh copper grids. Each grid contained two or three ultrathin sections. The grids were dried and stored in the order in which they were collected. The sections were counterstained with uranyl acetate and lead citrate and examined using a Philips CM10 transmission electron microscope (FEI). The micrographic images were captured with an AMT Advantage HR/HR-B CCD camera system (Advanced Microscopy Techniques).
Ultrathin sections containing the PVN were used for electron microscopic analysis. Ultrastructural analysis was done exclusively on tissue collected from the surface to minimize differences in immunolabeling due to differential penetration of reagents. The NR1 immunogold particles in the sham and 35 d CIH-treatment groups were quantitatively compared in dendritic profiles with or without peroxidase immunoreaction product for nNOS in the PVN. PVN tissue from the 14-d-treatment groups were analyzed similarly with the exception that NR1 immunogold was quantitatively compared only in the nNOS-labeled dendrites. In all treatment groups, the dendrites were identified mainly by the prevalence of endoplasmic reticulum and synaptic inputs from vesicle-filled axon terminals (Peters et al., 1991). Immunogold particles within dendrites were counted and categorized by location, such as whether they were in the cytoplasm or in contact with the plasma membrane. In the PVN region, the analysis was conducted in a total of 666 single (NR1) and dual (NR1/nNOS) immunolabeled dendritic profiles (324 from 35 d sham and 342 from 35 d CIH tissue) and in a total of 178 NR1/nNOS immunolabeled dendrites (86 from 14 d sham and 92 from 14 d CIH tissue). Quantification of labeled dendrites in tissue sections from both treatment groups at 35 and 14 d was performed blind.
Dendritic profiles with a diameter >0.8 μm were considered to be selectively labeled when they contained two or more gold particles. Dendritic profiles with a diameter <0.8 μm and other small neuronal (axons, axon terminals) and glial profiles were considered to be selectively labeled when they contained one or more gold particles. False-positive immunogold labeling was assessed by examining the number of gold particles overlying myelin, which is not known to express NR1 receptors. Approximately 0.5% of myelinated axons (1 of 187) in the neuropil had a single NR1 gold particle over the myelin. Peroxidase-immunoreactive profiles were defined as having a granular, electron-dense precipitate unlike the lighter, homogenous density of myelinated axons and other lipid-enriched membranes seen within the neuropil.
The potential false-negative results inherent to pre-embedding methods were also assessed with respect to their impact on the data analysis. The pre-embedding labeling method minimally detects most antigens within postsynaptic densities, which are readily identified by postembedding techniques (Aoki, 1997; Adams et al., 2002; Glass et al., 2004; Szabadits et al., 2007). This limited penetration may have resulted in an underestimation of the amount of NR1 labeling within synaptic junctions, but is equally applicable to both the CIH and control (sham) animals. The limited capacity for detection of synaptic NR1 does not have direct impact on the observed between-group differences in the cytoplasmic or extrasynaptic plasmalemmal NR1 immunogold labeling.
Using Microcomputer Image Device software (Imaging Research), the cross-sectional diameter, perimeter, surface area, and form factor of each NR1-labeled dendritic profile in the PVN were measured. Only transversely cut dendrites with a form factor value >0.5 were included in the dataset. A cluster analysis (SPSS) was performed to divide the NR1-labeled dendrites into small, medium, or large subcategories to compare dendrites of similar size across groups. The parameters used for statistical comparisons were as follows: (1) the number of plasmalemmal NR1 gold particles on a dendrite/dendritic perimeter, (2) the number of cytoplasmic NR1 gold particles in a dendritic profile/dendritic cross-sectional area, and (3) the number of total (plasmalemmal plus cytoplasmic) NR1 gold particles in a dendrite/dendritic cross-sectional area. Single-labeled (NR1) and dual-labeled (NR1/nNOS) dendrites were analyzed separately. Data are expressed as means ± SEM for the experimental and control groups of animals. Results were analyzed using a two-way (treatment × dendritic size) ANOVA. Values were considered to be statistically significant when p ≤ 0.05.
Whole-cell patch-clamp recording in PVN slices.
CIH (n = 6) and sham-treated (n = 6) mice were anesthetized with 2% isoflurane and their brains were rapidly removed and immersed into ice-cold sucrose-artificial CSF (s-aCSF) as described previously (D. P. Li et al., 2003, 2008). The s-aCSF was composed of the following (in mm): 26 NaHCO3, 1 NaH2PO4, 3 KCl, 5 MgSO4, 0.5 CaCl2, 10 glucose, and 248 sucrose, oxygenated with 95% O2 and 5% CO2, pH 7.3. Coronal slices (200 μm thickness) containing the PVN were cut using an VT1000S vibratome (Leica Microsystems) and stored in a custom-designed chamber containing lactic acid (l)-aCSF gassed with 95% O2 and 5% CO2 at 32°C for 1 h. The l-aCSF was composed of the following (in mm): 124 NaCl, 26 NaHCO3, 5 KCl, 1 NaH2PO4, 2 MgSO4, 2 CaCl2, 10 glucose, 4.5 lactic acid, pH 7.4. PVN slices were then transferred to a glass-bottom recording chamber (P-27; Warner Instrument) and continuously perfused with gassed l-aCSF at 2 ml/min. The lateral ventricle, fornix fibers, and optic chiasm were used as landmarks to identify the PVN region where the neurons were visualized using an E600 epifluorescence microscope with differential interference contrast optics (Nikon).
The patch glass electrode was pulled using borosilicate capillaries (OD 1.5 mm, ID 0.86 mm; World Precision Instruments) and P-80 micropipette puller (Sutter Instruments). The resistance of the pipette was 5∼10 MΩ when filled with an intracellular solution containing the following (in mm): 130 K-gluconate, 10 NaCl, 1.6 MgCl2, 0.1 EGTA, 10 HEPES, and 2 Mg-ATP, adjusted to pH 7.3. To elicit NMDA receptor-mediated currents in PVN neurons, the slice was perfused before the recording with a Mg2+-free extracellular solution containing the following (in mm) 121 NaCl, 5 KCl, 1.8 CaCl2, 0.01 glycine, 1 Na-pyruvate, 20 glucose, 26 NaHCO3, 1 NaH2PO4, and 4.5 lactic acid, gassed with 95% O2 and 5% CO2, adjusted to pH 7.4. The voltage-clamp recording was performed in PVN neurons following a gigaohm seal with a further brief negative pressure applied to obtain the whole-cell configuration. The membrane potential was held at −60 mV. The recording began for NMDA-evoked currents after the baseline current reached a stable state. NMDA (30 μm)-containing Mg2+-free extracellular solution was then perfused toward the patched neuron for 2 min (Kawano et al., 2006; Suh et al., 2010). Signals were processed using an Axopatch 200A amplifier, filtered at 2 kHz, digitized at 10 kHz using Digidata 1320A (Molecular Devices). Data are expressed as means ± SEM of the amplitude of NMDA-evoked currents. The NMDA-evoked current was analyzed off-line using a Window pClamp 8 (Molecular Devices). Correction for the liquid junction potential (−14 mV) was applied during off-line analysis. A one-way ANOVA followed by Tukey's post hoc test was used to compare the difference in the amplitudes of NMDA-evoked currents between sham and CIH groups at 14 and 35 d. A value of p ≤ 0.05 was considered to be statistically significant.
Isolation of PVN neurons and in vitro NO-sensitive fluorescence imaging.
Additional mice (n = 16) were used to assess NO production in isolated PVN neurons from naive mice and mice subjected to either 14 or 35 d of CIH or room air (sham treatment). These mice were anesthetized with isoflurane and their brains were removed and immersed in s-aCSF. Thick coronal tissue slices (200–300 μm) containing the PVN were cut using a vibratome and stored in a chamber filled with oxygenated and carbogenated l-aCSF. The tissue was incubated at 36°C for 1 h each in gassed l-aCSF containing Pronase 0.02% (w/v) and thermolysin (0.02%), both purchased from Sigma-Aldrich. The tissue slices were micropunched under a dissecting microscope to remove the PVN region and cells were dissociated mechanically. Isolated PVN cells, adhered to the glass bottom of a Petri dish, included neurons (80%) and non-neuronal cells (20%) (n = 75 cells). Neurons were identified based on their size, presence of processes, and positivity to nNOS immunoreactivity. Cells were incubated with the NO-sensitive fluorescent dye DAF-FM (4-amino-5-methylamino-2′,7′-difluorofluorescein) diacetate (5 μm; Invitrogen) for 30 min and then rinsed for 30 min. DAF-FM is loaded into cells and is converted to DAF-2 by intracellular esterases, rendering it membrane impermeable. NO and NO-derived species, including peroxynitrite, N-nitrosylate DAF-2, leading to the formation of the green fluorescence triazole DAF-2T (von Bohlen und Halbach, 2003). DAF-FM fluorescence is pH independent and well suited to study NO production in conditions such as NMDA receptor activation, in which intracellular pH changes (von Bohlen und Halbach, 2003). DAF-FM imaging was performed using an inverted fluorescence microscope (Nikon) equipped with a CCD camera (Princeton Instruments). Time-resolved fluorescence was measured every 30 s with an exposure time of 200 ms using image analysis software (IPLab; Scanalytics). Recordings were started after stable baseline fluorescence readings were achieved. Cells were superfused with oxygenated l-aCSF containing NMDA (10–300 μm) and the corresponding increases in fluorescence were recorded. In some experiments, cells were pretreated with the NMDA receptor antagonist MK801 (5–10 μm), the nonselective NOS inhibitor l-NNA (100 μm), the NO scavenger PTIO (200 μm), or the NO donor SNAP (2 μm). Time control experiments in which NMDA was not superfused were performed in parallel to assure the stability of the preparation.
DAF-FM fluorescence intensity is expressed as Ft/Fo, where Fo is the baseline fluorescence before application of NMDA, and Ft is fluorescence in the same cell after application of NMDA. Data are presented as means ± SEM with N as the number of neurons tested. A one- or two-way ANOVA followed by Tukey's post hoc test was used for statistical comparisons between naive, experimental, or sham and vehicle groups. Differences were considered statistically significant when p ≤ 0.05.
Results
The hypoxic stimulus used in the CIH model reduces arterial pO2
To test the effectiveness of the hypoxic stimulus used in our CIH model, we measured arterial blood gases before, during, and after a single hypoxic episode in six mice. As illustrated in Table 1, breathing 10% O2 for 90 s decreased PaO2 by 56% (t(10) = 13.14; p < 0.0001) and PaCO2 by 12% (t(10) = 1.76; p < 0.05) compared with prehypoxia levels. The fall in PaCO2 resulted in a corresponding increase in pH, a response consistent with hyperventilation. PaO2 returned to normal in the posthypoxia period (p > 0.05 from prehypoxia).
Table 1.
Arterial blood gases and pH in conscious mice before, during (90 s), and after acute exposure to hypoxia
| PaO2 (mmHg) | PaCO2 (mmHg) | pH | |
|---|---|---|---|
| Prehypoxia | 114 ± 4 | 25 ± 1 | 7.43 ± 0.02 |
| Hypoxia (10% O2) | 50 ± 2 | 22 ± 1 | 7.52 ± 0.02 |
| Posthypoxia | 119 ± 4 | 29 ± 1 | 7.43 ± 0.02 |
CIH increases arterial blood pressure without increasing plasma vasopressin
In mice subjected to 35 d of CIH, MAP measured by using an arterial catheter was significantly increased (t(6) = 2.13; p < 0.05) compared with sham-treated mice (CIH, 141 ± 7 mmHg; sham, 125 ± 3 mmHg). Similarly, systolic blood pressure measured by tail cuff plethysmography was significantly increased (t(18) = 2.54; p < 0.01) in 35 d CIH mice (115 ± 2 mmHg) compared with sham-treated mice (105 ± 3 mmHg). No significant elevation in blood pressure was seen after 14 d CIH (104 ± 4 mmHg) compared with sham controls (111 ± 6 mmHg) (t(8) = 0.99; p > 0.05). The magnitude of the blood pressure elevation at 35 d is consistent with that previously reported in both rats (Fletcher et al., 1999; Lai et al., 2006) and mice (Campen et al., 2005). The blood pressure elevation was not accompanied by a significant increase in plasma vasopressin at 35 d CIH (82 ± 27 pg/ml) compared with sham-treated controls (79 ± 29 pg/ml) (t(8) = 0.08; p > 0.05).
Subcellular distribution of NR1 immunogold particles in nNOS- and non-nNOS-containing profiles is similar in the PVN of 35 d sham-treated and CIH-exposed mice
The NR1 immunolabeling in the PVN was observed in many dendritic profiles (Figs. 1–4; Table 2). In both CIH and sham groups of mice, only a small subset (<30%) of these NR1-labeled dendrites contained nNOS. NR1 was less frequently seen in either glial or axonal profiles, the latter of which included those with or without detectable nNOS immunoreactivity (Fig. 1A,C,D; Table 2).
Figure 1.
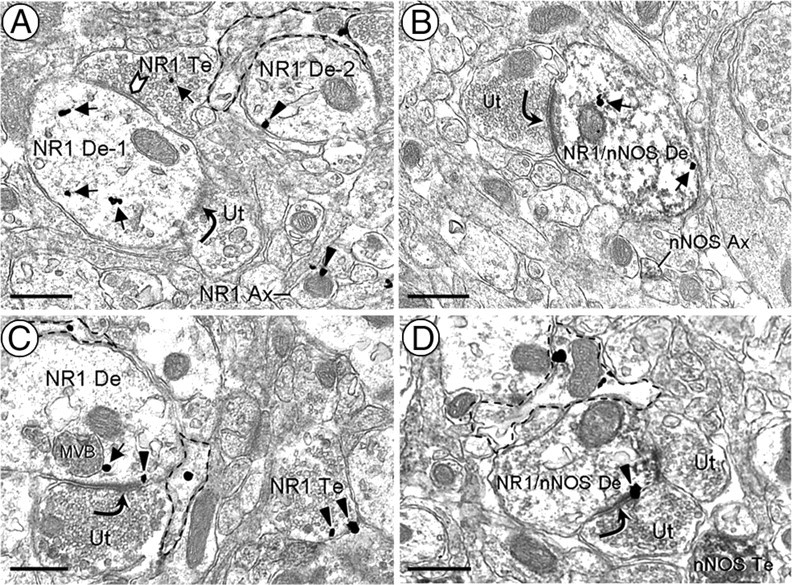
A–D, Electron micrographs showing NR1 immunogold labeling in PVN medium diameter-dendrites without (A, C) or with (B, D) nNOS immunoperoxidase labeling. Many of these dendrites are partially surrounded by glial processes containing NR1 (dashed outline). A, Cytoplasmic NR1 immunogold particles (arrows) are seen in a dendrite (NR1 De-1) distant from a portion of the surface membrane receiving an asymmetric excitatory-type contact (curved arrow) from an unlabeled axon terminal (Ut). This dendrite also is receiving what appears to be a symmetric inhibitory-type synapse (chevron) from an NR1-labeled terminal (NR1 Te). In the neuropil, gold particles are observed along the plasma membrane (arrowheads) of a dendrite (NR1 De-2) and a small axon (NR1 Ax). B, NR1 gold particles are found in the cytoplasm of a dendrite (NR1/nNOS De) containing diffuse nNOS immunoreactivity. An unlabeled axon terminal (Ut) containing small, clear vesicles forms an asymmetric synapse with this dual-labeled dendrite. Nearby, there is a nNOS-labeled axon (nNOS Ax). In dendrites without (C) or with (D) nNOS immunoperoxidase labeling, NR1 gold particles are occasionally seen on the plasmalemmal surface near asymmetric synapses. MVB, Multivesicular body; nNOS Te, nNOS-labeled terminal. Scale bars, 0.5 μm.
Figure 2.

NR1 immunogold particles and aggregates of nNOS immunoperoxidase are colocalized in PVN dendrites near asymmetric synaptic junctions. A, B, In small dendrites (NR1/nNOS De), a single gold particle is seen in the cytosol (A, black arrow) or on the plasma membrane (B, arrowhead) near an asymmetric synapse (curved arrow) with an unlabeled axon terminal (Ut1). Peroxidase reaction product (white arrow) is found beneath the asymmetric postsynaptic specialization and along the outer membranes of nearby mitochondria (m) and small vesicular organelles. These dual-labeled dendrites also receive symmetric contacts (chevron) from unlabeled terminals (Ut2) containing a mixture of small and large vesicles. Scale bars, 0.5 μm.
Figure 3.
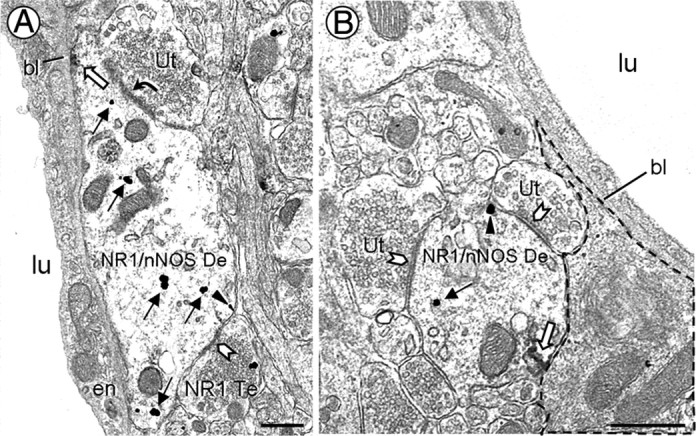
Electron micrographs showing NR1 and nNOS immunolabeled dendrites nearby PVN microvessels. A, A dendrite (NR1/nNOS De) contains cytoplasmic (black arrows) and plasmalemmal (arrowhead) NR1 immunoreactivity, as well as nNOS peroxidase reaction product (white arrow). The nNOS is aggregated near a portion of the plasma membrane apposed to the vascular basal lamina (bl). This dendrite receives asymmetric (curved arrow) and symmetric (chevron) contacts from an unlabeled terminal (Ut) and a NR1-labeled terminal (NR1 Te), respectively. B, A dendrite (NR1/nNOS De) receiving multiple symmetric contacts is minimally separated from a small blood vessel by perivascular astrocytic processes (dashed outline). lu, Blood vessel lumen; en, endothelial cell. Scale bars, 0.5 μm.
Figure 4.
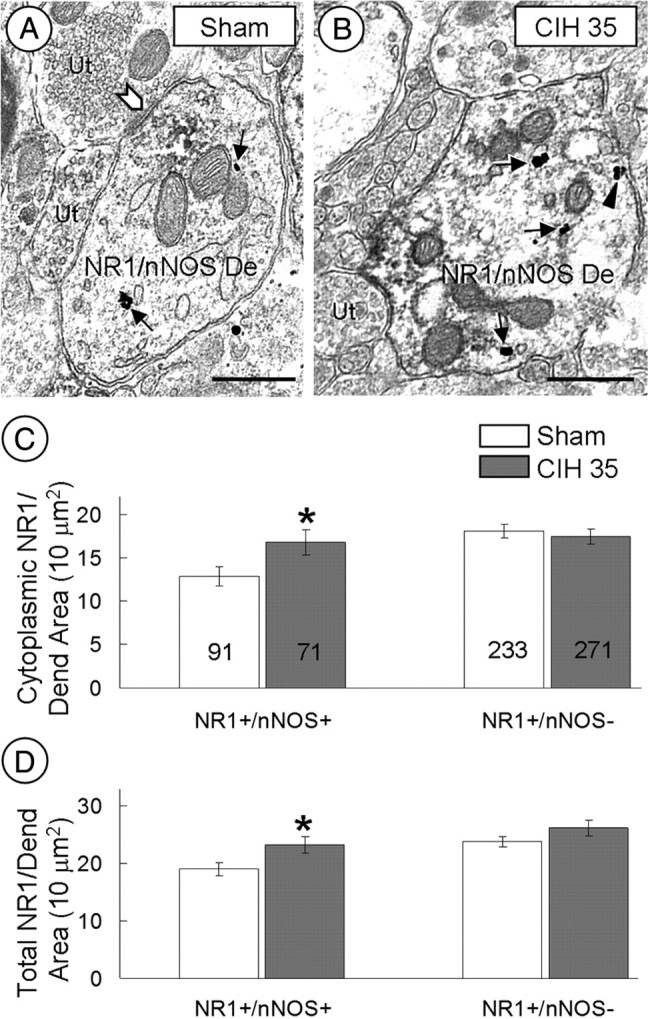
CIH increases cytoplasmic NR1 labeling in nNOS-containing dendrites of the PVN. A, B, Electron micrographs show cytoplasmic (arrows) and plasmalemmal (arrowheads) NR1 distribution in dual-labeled dendrites (NR1/nNOS De) within the PVN of mice exposed to sham treatment (A) or CIH (B) for 35 d. The chevron shows a symmetric synapse. C, D, Bar graphs show significant differences between sham and CIH mice in the cytoplasmic (C) and total (D) NR1 density of dendrites (Dend) with (NR1+/nNOS+), but not in those without (NR1+/nNOS−), immunoreactivity for nNOS. The number of dendrites included in the analysis is represented within each bar. Ut, Unlabeled terminal. *p ≤ 0.05. Scale bars, 0.5 μm.
Table 2.
PVN distribution of neuronal NR1 immunolabeling subdivided by nNOS immunoreactivity for sham-treated and CIH-exposed micea
| 35 d sham (%) | 35 d CIH (%) | |
|---|---|---|
| Dendrites | 62 (324 of 520) | 62 (342 of 553) |
| −nNOS | 72 | 79 |
| +nNOS | 28 | 21 |
| Axons | 7 (34 of 520) | 9 (48 of 553) |
| −nNOS | 88 | 90 |
| +nNOS | 12 | 10 |
| Axon terminals | 31 (162 of 520) | 29 (163 of 553) |
| −nNOS | 98 | 95 |
| +nNOS | 2 | 5 |
aProfile values are expressed as a percentage of the total neuronal NR1-labeled profiles for each treatment condition. Each category is further subdivided to show the percentage of profiles with (+) or without (−) nNOS.
The distribution of NR1 immunogold labeling was similar in all PVN dendrites regardless of whether or not these dendrites contained nNOS. NR1 immunogold particles were predominantly located in the cytoplasm, near mitochondria and endomembranous structures, of dendrites in the PVN of control (627 of 800) and 35 d CIH (641 of 832) mice (Fig. 1A,B). Other dendritic gold particles were distributed along extrasynaptic portions of the plasma membrane. Less than 4% of the plasmalemmal NR1 gold particles in each treatment group were found within or near synapses from unlabeled axon terminals (Fig. 1C,D). In dendrites expressing nNOS, the NR1 immunogold particles were often located near aggregates of nNOS immunoperoxidase reaction product distributed near asymmetric excitatory-type synapses (Figs. 1C, 2) that are typical of the contacts made by glutamatergic axon terminals (Peters et al., 1991; Rollenhagen and Lübke, 2006). Many of these dendrites received convergent input from unlabeled axon terminals forming symmetric inhibitory-type contacts (Fig. 2).
The NR1- and nNOS-containing dendrites were sometimes located in close proximity to the basement membrane of blood vessels in the PVN (Fig. 3). In these dendrites, NR1 immunogold were distributed along the surface membrane and throughout the cytoplasm. Immunoperoxidase reaction product for nNOS was seen near portions of the plasma membrane opposing the basal lamina (Fig. 3A) or perivascular astrocytic processes (Fig. 3B).
CIH produces a time-dependent change in cytoplasmic and plasmalemmal density of NR1 immunolabeling in nNOS dendrites of the PVN
In all transversely cut, dual-labeled (NR1 and nNOS) dendrites, the average cytoplasmic (F(1,160) = 5.038; p = 0.05) and total (cytoplasmic and plasmalemmal; F(1,160) = 5.466; p < 0.05) density of NR1 immunogold particles was significantly increased in the PVN of mice subjected to 35 d of CIH compared with controls (Fig. 4). When nNOS dendrites were divided by size using cluster analysis, the medium to large (0.82–1.51 μm in diameter) dendrites in the 35 d CIH group showed a significantly (p < 0.05) greater number of total NR1 gold particles per dendritic cross-sectional area compared with the control group. Of the total NR1-immunogold particles located in these nNOS dendrites from the CIH group, the vast majority were located in the cytoplasm (52 of 68) or on nonsynaptic plasmalemmal membranes (16 of 68). There were no statistically significant (p > 0.05) between-group differences in the total NR1 gold density in the small (0.24–0.80 μm in diameter) dendrites.
CIH (35 d) did not alter NR1 immunogold density in PVN dendrites without detectable nNOS. Specifically, there were no significant differences in cytoplasmic (F(1,502) = 0.284; p > 0.05), plasmalemmal (F(1,502) = 1.468; p > 0.05), or total (F(1,502) = 1.858; p > 0.05) density of NR1 immunogold particles in non-nNOS dendrites of 35 d CIH-exposed mice compared with sham-treated mice (Fig. 4C,D).
In contrast with 35 d of CIH, 14 d of CIH produced a decrease in the plasmalemmal (CIH, 0.34 ± 0.11 particles/10 μm dendritic perimeter; sham, 0.73 ± 0.16 particles/10 μm dendritic perimeter; F(1,95) = 4.175; p < 0.05), without changing the cytoplasmic (CIH, 8.96 ± 0.78 particles/10 μm2 dendritic area; sham, 8.51 ± 0.94 particles/10 μm2 dendritic area; (F(1,95) = 0.146; p > 0.05), density of NR1 in the nNOS containing medium to large (0.71–1.87 μm in diameter) dendrites of the PVN. The small (0.20–0.70 μm in diameter) dendrites showed no statistically significant (p > 0.05) between-group differences in the plasmalemmal (CIH, 1.15 ± 0.28 particles/10 μm dendritic perimeter; sham, 1.10 ± 0.25 particles/10 μm dendritic perimeter) or cytoplasmic (CIH, 15.96 ± 2.39 particles/10 μm2 dendritic area; sham, 14.34 ± 1.71 particles/10 μm2 dendritic area) NR1 immunogold density.
CIH abolishes NMDA-induced NO production in isolated PVN neurons at 35, but not 14, days
In naive mice, application of NMDA (10–300 μm) to isolated PVN neurons (Fig. 5A–C) resulted in a concentration-dependent elevation of DAF-FM fluorescence, indicating increased NO production (Fig. 5D). Such an increase in fluorescence was prevented by pretreatment with the NO scavenger PTIO, the NOS inhibitor l-NNA, or the NMDA receptor antagonist MK801 (Fig. 5E). After MK801, the fluorescence was increased by the NO donor SNAP (Fig. 5E). These observations attest to the validity of the NO detection method during NMDA receptor activation. In sham-treated mice, NMDA-induced increases in fluorescence were virtually identical to those observed in isolated PVN cells of naive mice (Fig. 6A). NMDA-induced NO-dependent fluorescence was suppressed in PVN cells isolated from mice subjected to 35 d of CIH, but not in mice exposed to CIH for only 14 d (Fig. 6A,B).
Figure 5.

A–C, Light microscopy images of brightfield (A) and nNOS immunofluorescence (B, red) in isolated PVN neurons. These neurons are DAF-FM positive (C, green). D, Application of NMDA to PVN cells dissociated from naive mice induces a dose-related increase in NO-dependent fluorescence, assessed by the indicator DAF-FM. The NO signal is expressed as the ratio Ft/Fo (see Materials and Methods). E, The increase in fluorescence induced by NMDA (100 μm) is blocked by the NO scavenger PTIO (200 μm), the NOS inhibitor l-NNA (100 μm), or the NMDA receptor antagonist MK801 (5–10 μm). After MK801, the NO donor SNAP (2 μm) is able to increase the signal, indicating that MK801 did not interfere with the ability of the indicator to detect NO. *p < 0.05; **p < 0.01.
Figure 6.
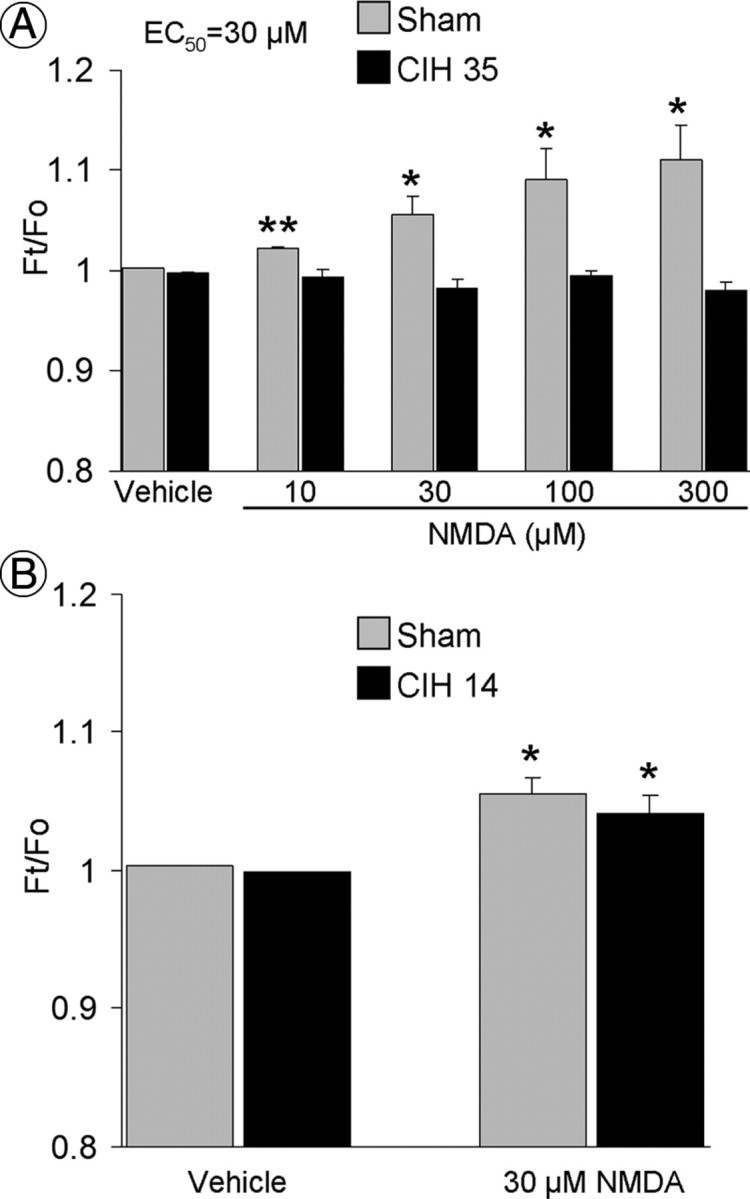
A, NMDA increases NO-dependent fluorescence in PVN neurons isolated from sham-, but not from 35 d CIH-, treated mice (N = 5–27) (Fig. 5D). B, NMDA increases NO-dependent fluorescence in PVN neurons isolated from mice subjected to 14 d of CIH (p > 0.05 from sham group; N = 5–8). *p < 0.05 vs vehicle; **p < 0.01 vs vehicle.
CIH reduces NMDA-evoked currents in PVN neurons
The whole-cell patch-clamp recording of PVN neurons in slices prepared from mice exposed to 35 d of CIH showed a significant reduction (p < 0.05) in NMDA-triggered current compared with sham-treated controls (Fig. 7). A similar reduction in NMDA-evoked current was also seen after 14 d of CIH (Fig. 7C). Both at 14 and 35 d, similar to the naive group, the inward ionic currents triggered by NMDA were blocked by MK801 (Fig. 7C).
Figure 7.
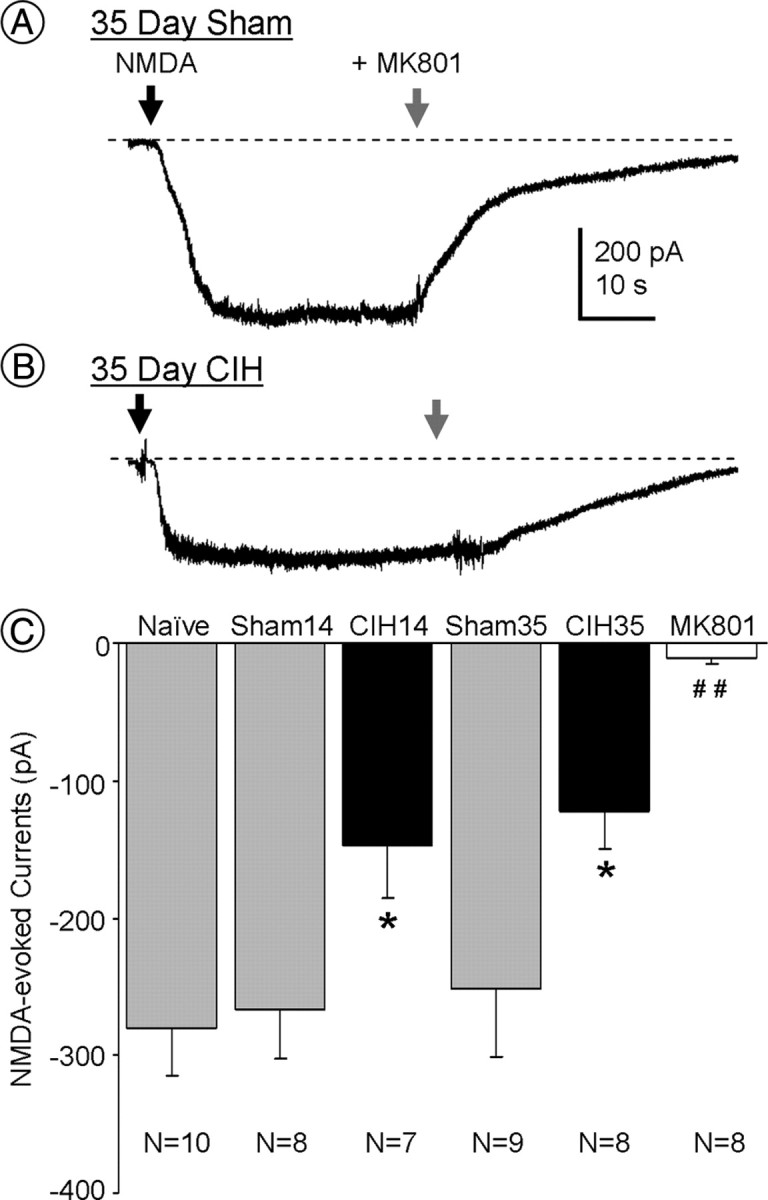
A, B, Representative whole-cell recordings of currents triggered by NMDA (30 μm; black arrow; holding potential, −60 mV) from PVN neurons in slices taken from mice exposed to CIH or sham treatment for 35 d. The NMDA currents are blocked by MK801 (10 μm; gray arrow). C, Comparison of amplitudes of NMDA-evoked currents in PVN neurons from naive, 14 and 35 d sham-treated mice (Sham14 and Sham35, respectively), 14 and 35 d CIH mice (CIH14 and CIH35, respectively), and 35 d CIH mice in the presence of MK801 (10 μm). *p < 0.05 vs naive and sham; ##p < 0.01 vs naive, sham, 14 d CIH, and 35 d CIH mice.
Discussion
We have established that the mouse CIH paradigm used in the present study intermittently lowers arterial oxygen to a level relevant to those observed in patients with OSA (Lee et al., 2009), and produces an increase in arterial blood pressure detectable after 35 but not 14 d. After 35 d of CIH, we saw a significant increase in the cytoplasmic density of NMDA NR1 subunits in dendrites of nNOS-containing neurons in the PVN (Fig. 8). The ultrastructural analysis also revealed that nNOS dendrites in this brain region have a reduction in the plasmalemmal density of NR1 in 14 d CIH-exposed mice (Fig. 8), when blood pressure does not significantly differ from that of sham-treated controls. The observed changes in the subcellular distribution of the obligatory NR1 subunit seen at these time points suggest that CIH decreases the availability of functional NMDA receptors. Furthermore, NMDA-evoked currents in PVN neurons were attenuated after either 14 or 35 d of CIH. However, only the 35 d CIH mice showed a decrease in NO production in isolated PVN neurons. These findings are consistent with the hypothesis that CIH produces a reduction in the surface/synaptic targeting of NMDA NR1 in nNOS neurons and a suppression of NMDA receptor-mediated currents in the PVN before the emergence of hypertension, the development of which may be enabled by the reduction in NO signaling in this brain region.
Figure 8.

Schematic diagram illustrating the differential NR1 immunogold (chevrons) distribution in PVN nNOS neurons of sham- or CIH-treated mice. These neurons and their dendritic processes are separated from the smooth muscle (light gray) and endothelial cells (hatched lines) of an intraparenchymal arteriole by glial processes (yellow). The green indicates the nucleus of a smooth muscle and endothelial cell. nNOS-containing dendrites receive asymmetric excitatory-type (+, red) and symmetric inhibitory-type (−, blue) synapses from unlabeled terminals. Gray dashed oval indicates a transverse section through the dendrite at the level receiving excitatory and inhibitory terminals. This region is enlarged in the disk shown for sham, 14 d CIH, and 35 d CIH treatment. At 14 d, the NR1 dendritic plasmalemmal (gray rim) density is decreased without change in the cytoplasmic (aqua fill) density or NO production, which is consistent with CIH-induced internalization of NR1 subunits that are preferentially degraded and/or downregulated. After 35 d, however, NO production is silenced and the NR1 cytoplasmic density is increased without a significant change in the plasmalemmal density in the CIH-treated compared with sham-treated (control) mice. This raises the possibility that at 35 d, the loss of NO retrograde signaling is one of the factors that triggers the cytoplasmic accumulation of NR1. Possible mechanisms of this effect may include enhanced production and/or suppression of the endosomal degradation of the internalized NR1 receptor complexes.
Methodological considerations
There are important differences between the CIH model being used in the present study and clinical OSA. Apnea episodes occurring in humans result in hypercapnia and increased inspiratory efforts due to obstructed or collapsed airway passages. The intermittent hypoxic stimuli being applied in the present CIH model causes hyperventilation-induced hypocapnia. Despite this difference, however, numerous studies in rodents have shown that similar hypocapnic hypoxia/reoxygenation protocols produce physiological effects typical of those that occur in OSA, such as hypersomnolence and elevated sympathetic nerve activity and blood pressure (Lesske et al., 1997; Campen et al., 2005; Zhan et al., 2005; Peng et al., 2006; Kanagy, 2009).
We used DAF-FM to investigate the effect of CIH on NMDA-dependent NO production in the PVN. Although DAF-FM is well suited to study NO production in single cells, the fluorescence generated by this indicator is also influenced by catecholamines, ascorbate, and hydrogen peroxide (von Bohlen und Halbach, 2003). However, it is unlikely that the NMDA-induced fluorescence in our preparation was not related to NO because it was blocked by the NOS inhibitor l-NNA and by the NO scavenger PTIO. Furthermore, the observation that the NO signal induced by NMDA was abolished by MK801 is consistent with a key requirement for NMDA receptors in the NO production.
NR1 and nNOS are colocalized in PVN dendrites
The observed presence of NR1 in an nNOS-containing subset of PVN dendrites receiving excitatory-type synaptic contacts is consistent with the well characterized spatial coupling between NMDA receptors and nNOS in the hypothalamus and other brain regions (Bhat et al., 1995; Aoki et al., 1997; Kiss and Vizi, 2001; Lin and Talman, 2002). Magnocellular neurosecretory oxytocin and vasopressin neurons constitute major neuronal phenotypes expressing nNOS in the PVN (Arévalo et al., 1992; Calka and Block, 1993; Torres et al., 1993; Miyagawa et al., 1994; Sánchez et al., 1994; Hatakeyama et al., 1996; González-Hernández et al., 2006). Conversely, preautonomic (Weiss et al., 2001; Y. Li et al., 2003; Kantzides and Badoer, 2005; Watkins et al., 2009) and GABAergic (Watkins et al., 2009) neurons in the PVN express little, if any, nNOS. Therefore, it is likely that the CIH-induced changes in NR1 observed in the present study occur predominantly in the nNOS-containing neurosecretory neurons. However, these neurons may not be among those that release vasopressin into the systemic circulation because 35 d sham-treated and CIH-exposed mice did not significantly differ in levels of this hormone.
CIH-induced changes in NR1 immunolabeling in nNOS dendritic profiles of the PVN
The 35 d of CIH exposure resulted in an increased cytoplasmic density of NR1 in dendrites of nNOS neurons in the PVN. An increase in NR1 protein expression has been reported in the carotid body and the brainstem after CIH (Reeves et al., 2003; Liu et al., 2009). These previous studies used Western blot analysis to examine protein expression in the entire region of interest. Therefore, the result may not be representative of what is occurring in a subpopulation of neurons, particularly those that express nNOS. Although an increase in total NR1 labeling was observed in nNOS-containing dendrites, we did not detect any CIH-induced changes in total NR1 labeling in non-nNOS-containing dendrites in the PVN. This may reflect, in part, the great diversity of neurotransmitters and neuropeptide modulators that are expressed in non-nNOS-containing PVN neurons (Benarroch, 2005) that are differentially influenced by CIH-induced plasticity of NMDA receptors.
The observed CIH-induced changes in the subcellular distribution of NR1 in nNOS-containing dendrites of the PVN may be ascribed in part to the intermittent activation of excitatory inputs derived from local interneurons and other hypothalamic nuclei as well as from thalamic nuclei and the subfornical organ (Boudaba et al., 1997; Csáki et al., 2000). NMDA receptor desensitization/internalization occurs in response to repetitive activation (Nakamichi and Yoneda, 2005), which may contribute to the cytoplasmic accumulation of NR1 in nNOS-containing dendrites of the PVN that was seen after 35 d of CIH. The importance of both the duration and the intermittency of the hypoxic stimulus for the emergence of hypertension seen at 35 d is suggested by the fact that a continuous reduction in atmospheric oxygen produces only a transient increase in blood pressure (Naeije, 2010). The 35 d CIH-induced increase in cytoplasmic density of NR1 in nNOS-containing dendrites is also consistent with enhanced synthesis and/or decreased degradation of NR1. After 14 d of CIH exposure, however, NR1 plasmalemmal density was decreased without affecting the cytoplasmic density of NR1 in nNOS dendrites of the PVN, consistent with the possibility that at this time point the internalized NR1 receptor complexes are preferentially degraded rather than being returned to functional surface/synaptic sites (Scott et al., 2004; Washbourne et al., 2004).
CIH decreases NO production only after 35 d, but reduces NMDA-evoked currents at both 14 and 35 d time points
Our results provide the first evidence that NMDA-induced NO production is suppressed in isolated PVN neurons from mice exposed to 35 d of CIH. These results are in contrast to those obtained from PVN neurons of naive and sham-treated mice, in which NMDA caused a concentration-dependent increase in NO production. We also demonstrate that the NMDA-induced increase in NO production observed in PVN neurons from naive mice is blocked by the NMDA receptor antagonist MK801. These data, along with the ultrastructural evidence for increased cytoplasmic NMDA NR1 in nNOS-containing neurons of the PVN in 35 d CIH-exposed mice, support the interpretation that decreased availability of functional surface NMDA receptors suppresses NO signaling in the PVN.
In contrast with 35 d, 14 d of CIH did not significantly affect NO production in isolated PVN neurons, even though there was an observed decrease in the NR1 plasmalemmal density in nNOS-containing dendrites and decreased NMDA-evoked currents in PVN neurons at this time point. Together, these observations suggest that decreased functionality of NMDA receptors in nNOS-containing neurons of the PVN is not the sole factor contributing to the reduction in NO signaling that occurs after 35 d of CIH. However, one caveat with this interpretation is that we cannot be sure that the neurons from which NMDA-evoked currents were recorded were nitrergic. Other potentially important mechanisms accounting for the NO suppression induced by CIH may include downregulation of nNOS (Huang et al., 2007); suppression of PSD-95, a scaffolding protein that couples the NMDA receptor to nNOS (Sattler et al., 1999); and/or nNOS phosphorylation (Rameau et al., 2004; Park et al., 2008). In addition, the extended period (35 d) of CIH also may induce the formation of reactive oxygen species that are avid scavengers of NO (Peng et al., 2006; Mayorov, 2007; Stowe and Camara, 2009).
Conclusion
The present findings indicate that extended (35 d) CIH in mice results in a blood pressure elevation and an accumulation of NMDA NR1 subunits within the cytoplasmic compartment of nNOS-containing PVN dendrites. This effect on NR1 subcellular distribution differs from that observed before the onset of hypertension at 14 d of CIH, when the nNOS dendrites in this region showed a decrease in plasmalemmal density of NR1 without significantly affecting the cytoplasmic density of these subunits. The differential changes seen in NR1 distribution at these time points suggest mechanistic differences in the internalization, degradation, induction, and/or surface assembly of NMDA receptors that may specifically relate to both the CIH exposure and hypertension development. The net effect on NR1 distribution at either 14 or 35 d is consistent with decreased functionality of NMDA receptors, as was shown by the electrophysiological evidence for reduction of NMDA-evoked current in PVN neurons. The diminished functionality of NMDA receptors in the PVN may play a key role in the adaptive neuroendocrine and autonomic responses to intermittent hypoxia (Y. F. Li et al., 2003). However, only 35 d of CIH significantly elevated blood pressure and reduced NO production, suggesting that loss of NO signaling in the PVN is linked to the emergence of hypertension and dependent on mechanisms that are at least partially independent of nonfunctional NMDA receptors.
Footnotes
This work was supported by National Institutes of Health Grants HL18974, HL096571, MH40342 (V.M.P.), and DA04600 (V.M.P.).
References
- Adams MM, Fink SE, Shah RA, Janssen WG, Hayashi S, Milner TA, McEwen BS, Morrison JH. Estrogen and aging affect the subcellular distribution of estrogen receptor-alpha in the hippocampus of female rats. J Neurosci. 2002;22:3608–3614. doi: 10.1523/JNEUROSCI.22-09-03608.2002. [DOI] [PMC free article] [PubMed] [Google Scholar]
- Allen AM. Inhibition of the hypothalamic paraventricular nucleus in spontaneously hypertensive rats dramatically reduces sympathetic vasomotor tone. Hypertension. 2002;39:275–280. doi: 10.1161/hy0202.104272. [DOI] [PubMed] [Google Scholar]
- Aoki C. Postnatal changes in the laminar and subcellular distribution of NMDA-R1 subunits in the cat visual cortex as revealed by immuno-electron microscopy. Brain Res Dev Brain Res. 1997;98:41–59. doi: 10.1016/s0165-3806(96)00160-5. [DOI] [PubMed] [Google Scholar]
- Aoki C, Rhee J, Lubin M, Dawson TM. NMDA-R1 subunit of the cerebral cortex co-localizes with neuronal nitric oxide synthase at pre- and postsynaptic sites and in spines. Brain Res. 1997;750:25–40. doi: 10.1016/s0006-8993(96)01147-x. [DOI] [PubMed] [Google Scholar]
- Arévalo R, Sánchez F, Alonso JR, Carretero J, Vázquez R, Aijón J. NADPH-diaphorase activity in the hypothalamic magnocellular neurosecretory nuclei of the rat. Brain Res Bull. 1992;28:599–603. doi: 10.1016/0361-9230(92)90109-b. [DOI] [PubMed] [Google Scholar]
- Bains JS, Ferguson AV. Nitric oxide regulates NMDA-driven GABAergic inputs to type I neurones of the rat paraventricular nucleus. J Physiol. 1997;499:733–746. doi: 10.1113/jphysiol.1997.sp021965. [DOI] [PMC free article] [PubMed] [Google Scholar]
- Benarroch EE. Paraventricular nucleus, stress response, and cardiovascular disease. Clin Auton Res. 2005;15:254–263. doi: 10.1007/s10286-005-0290-7. [DOI] [PubMed] [Google Scholar]
- Bhat GK, Mahesh VB, Lamar CA, Ping L, Aguan K, Brann DW. Histochemical localization of nitric oxide neurons in the hypothalamus: association with gonadotropin-releasing hormone neurons and co-localization with N-methyl-d-aspartate receptors. Neuroendocrinology. 1995;62:187–197. doi: 10.1159/000127004. [DOI] [PubMed] [Google Scholar]
- Boland LL, Shahar E, Iber C, Knopman DS, Kuo TF, Nieto FJ. Measures of cognitive function in persons with varying degrees of sleep-disordered breathing: the Sleep Heart Health Study. J Sleep Res. 2002;11:265–272. doi: 10.1046/j.1365-2869.2002.00308.x. [DOI] [PubMed] [Google Scholar]
- Boudaba C, Schrader LA, Tasker JG. Physiological evidence for local excitatory synaptic circuits in the rat hypothalamus. J Neurophysiol. 1997;77:3396–3400. doi: 10.1152/jn.1997.77.6.3396. [DOI] [PubMed] [Google Scholar]
- Calka J, Block CH. Relationship of vasopressin with NADPH-diaphorase in the hypothalamo-neurohypophysial system. Brain Res Bull. 1993;32:207–210. doi: 10.1016/0361-9230(93)90177-d. [DOI] [PubMed] [Google Scholar]
- Campen MJ, Shimoda LA, O'Donnell CP. Acute and chronic cardiovascular effects of intermittent hypoxia in C57BL/6J mice. J Appl Physiol. 2005;99:2028–2035. doi: 10.1152/japplphysiol.00411.2005. [DOI] [PubMed] [Google Scholar]
- Chan J, Aoki C, Pickel VM. Optimization of differential immunogold-silver and peroxidase labeling with maintenance of ultrastructure in brain sections before plastic embedding. J Neurosci Methods. 1990;33:113–127. doi: 10.1016/0165-0270(90)90015-8. [DOI] [PMC free article] [PubMed] [Google Scholar]
- Chen XQ, Du JZ, Wang YS. Regulation of hypoxia-induced release of corticotropin-releasing factor in the rat hypothalamus by norepinephrine. Regul Pept. 2004;119:221–228. doi: 10.1016/j.regpep.2004.02.005. [DOI] [PubMed] [Google Scholar]
- Csáki A, Kocsis K, Halász B, Kiss J. Localization of glutamatergic/aspartatergic neurons projecting to the hypothalamic paraventricular nucleus studied by retrograde transport of [3H]D-aspartate autoradiography. Neuroscience. 2000;101:637–655. doi: 10.1016/s0306-4522(00)00411-5. [DOI] [PubMed] [Google Scholar]
- DiCarlo SE, Zheng H, Collins HL, Rodenbaugh DW, Patel KP. Daily exercise normalizes the number of diaphorase (NOS)-positive neurons in the hypothalamus of hypertensive rats. Brain Res. 2002;955:153–160. doi: 10.1016/s0006-8993(02)03400-5. [DOI] [PubMed] [Google Scholar]
- Dunah AW, Yasuda RP, Luo J, Wang Y, Prybylowski KL, Wolfe BB. Biochemical studies of the structure and function of the N-methyl-d-aspartate subtype of glutamate receptors. Mol Neurobiol. 1999;19:151–179. doi: 10.1007/BF02743658. [DOI] [PubMed] [Google Scholar]
- Fletcher EC. Sympathetic over activity in the etiology of hypertension of obstructive sleep apnea. Sleep. 2003;26:15–19. doi: 10.1093/sleep/26.1.15. [DOI] [PubMed] [Google Scholar]
- Fletcher EC, Bao G, Li R. Renin activity and blood pressure in response to chronic episodic hypoxia. Hypertension. 1999;34:309–314. doi: 10.1161/01.hyp.34.2.309. [DOI] [PubMed] [Google Scholar]
- Garthwaite J. Concepts of neural nitric oxide-mediated transmission. Eur J Neurosci. 2008;27:2783–2802. doi: 10.1111/j.1460-9568.2008.06285.x. [DOI] [PMC free article] [PubMed] [Google Scholar]
- Glass MJ, Kruzich PJ, Kreek MJ, Pickel VM. Decreased plasma membrane targeting of NMDA-NR1 receptor subunit in dendrites of medial nucleus tractus solitarius neurons in rats self-administering morphine. Synapse. 2004;53:191–201. doi: 10.1002/syn.20049. [DOI] [PubMed] [Google Scholar]
- Glass MJ, Hegarty DM, Oselkin M, Quimson L, South SM, Xu Q, Pickel VM, Inturrisi CE. Conditional deletion of the NMDA-NR1 receptor subunit gene in the central nucleus of the amygdala inhibits naloxone-induced conditioned place aversion in morphine-dependent mice. Exp Neurol. 2008;213:57–70. doi: 10.1016/j.expneurol.2008.04.045. [DOI] [PMC free article] [PubMed] [Google Scholar]
- González-Hernández T, Afonso-Oramas D, Cruz-Muros I, Barroso-Chinea P, Abreu P, del Mar Pérez-Delgado M, Rancel-Torres N, del Carmen González M. Interleukin-6 and nitric oxide synthase expression in the vasopressin and corticotrophin-releasing factor systems of the rat hypothalamus. J Histochem Cytochem. 2006;54:427–441. doi: 10.1369/jhc.5A6845.2005. [DOI] [PubMed] [Google Scholar]
- Hatakeyama S, Kawai Y, Ueyama T, Senba E. Nitric oxide synthase-containing magnocellular neurons of the rat hypothalamus synthesize oxytocin and vasopressin and express Fos following stress stimuli. J Chem Neuroanat. 1996;11:243–256. doi: 10.1016/s0891-0618(96)00166-4. [DOI] [PubMed] [Google Scholar]
- Herman JP, Cullinan WE. Neurocircuitry of stress: central control of the hypothalamo-pituitary-adrenocortical axis. Trends Neurosci. 1997;20:78–84. doi: 10.1016/s0166-2236(96)10069-2. [DOI] [PubMed] [Google Scholar]
- Horn T, Smith PM, McLaughlin BE, Bauce L, Marks GS, Pittman QJ, Ferguson AV. Nitric oxide actions in paraventricular nucleus: cardiovascular and neurochemical implications. Am J Physiol. 1994;266:R306–R313. doi: 10.1152/ajpregu.1994.266.1.R306. [DOI] [PubMed] [Google Scholar]
- Huang J, Tamisier R, Ji E, Tong J, Weiss WJ. Chronic intermittent hypoxia modulates nNOS mRNA and protein expression in the rat hypothalamus. Respir Physiol Neurobiol. 2007;158:30–38. doi: 10.1016/j.resp.2007.03.010. [DOI] [PubMed] [Google Scholar]
- Kanagy NL. Vascular effects of intermittent hypoxia. ILAR J. 2009;50:282–288. doi: 10.1093/ilar.50.3.282. [DOI] [PMC free article] [PubMed] [Google Scholar]
- Kantzides A, Badoer E. nNOS-containing neurons in the hypothalamus and medulla project to the RVLM. Brain Res. 2005;1037:25–34. doi: 10.1016/j.brainres.2004.11.032. [DOI] [PubMed] [Google Scholar]
- Kawabe T, Chitravanshi VC, Kawabe K, Sapru HN. Cardiovascular function of a glutamatergic projection from the hypothalamic paraventricular nucleus to the nucleus tractus solitarius in the rat. Neuroscience. 2008;153:605–617. doi: 10.1016/j.neuroscience.2008.02.076. [DOI] [PMC free article] [PubMed] [Google Scholar]
- Kawano T, Anrather J, Zhou P, Park L, Wang G, Frys KA, Kunz A, Cho S, Orio M, Iadecola C. Prostaglandin E2 EP1 receptors: downstream effectors of COX-2 neurotoxicity. Nat Med. 2006;12:225–229. doi: 10.1038/nm1362. [DOI] [PubMed] [Google Scholar]
- Kiss JP, Vizi ES. Nitric oxide: a novel link between synaptic and nonsynaptic transmission. Trends Neurosci. 2001;24:211–215. doi: 10.1016/s0166-2236(00)01745-8. [DOI] [PubMed] [Google Scholar]
- Lai CJ, Yang CC, Hsu YY, Lin YN, Kuo TB. Enhanced sympathetic outflow and decreased baroreflex sensitivity are associated with intermittent hypoxia-induced systemic hypertension in conscious rats. J Appl Physiol. 2006;100:1974–1982. doi: 10.1152/japplphysiol.01051.2005. [DOI] [PubMed] [Google Scholar]
- Lee EJ, Woodske ME, Zou B, O'Donnell CP. Dynamic arterial blood gas analysis in conscious, unrestrained C57BL/6J mice during exposure to intermittent hypoxia. J Appl Physiol. 2009;107:290–294. doi: 10.1152/japplphysiol.91255.2008. [DOI] [PMC free article] [PubMed] [Google Scholar]
- Lesske J, Fletcher EC, Bao G, Unger T. Hypertension caused by chronic intermittent hypoxia–influence of chemoreceptors and sympathetic nervous system. J Hypertens. 1997;15:1593–1603. doi: 10.1097/00004872-199715120-00060. [DOI] [PubMed] [Google Scholar]
- Li DP, Chen SR, Pan HL. Angiotensin II stimulates spinally projecting paraventricular neurons through presynaptic disinhibition. J Neurosci. 2003;23:5041–5049. doi: 10.1523/JNEUROSCI.23-12-05041.2003. [DOI] [PMC free article] [PubMed] [Google Scholar]
- Li DP, Yang Q, Pan HM, Pan HL. Pre- and postsynaptic plasticity underlying augmented glutamatergic inputs to hypothalamic presympathetic neurons in spontaneously hypertensive rats. J Physiol. 2008;586:1637–1647. doi: 10.1113/jphysiol.2007.149732. [DOI] [PMC free article] [PubMed] [Google Scholar]
- Li Y, Zhang W, Stern JE. Nitric oxide inhibits the firing activity of hypothalamic paraventricular neurons that innervate the medulla oblongata: role of GABA. Neuroscience. 2003;118:585–601. doi: 10.1016/s0306-4522(03)00042-3. [DOI] [PubMed] [Google Scholar]
- Li YF, Mayhan WG, Patel KP. NMDA-mediated increase in renal sympathetic nerve discharge within the PVN: role of nitric oxide. Am J Physiol Heart Circ Physiol. 2001;281:H2328–H2336. doi: 10.1152/ajpheart.2001.281.6.H2328. [DOI] [PubMed] [Google Scholar]
- Li YF, Cornish KG, Patel KP. Alteration of NMDA NR1 receptors within the paraventricular nucleus of hypothalamus in rats with heart failure. Circ Res. 2003;93:990–997. doi: 10.1161/01.RES.0000102865.60437.55. [DOI] [PubMed] [Google Scholar]
- Li YF, Jackson KL, Stern JE, Rabeler B, Patel KP. Interaction between glutamate and GABA systems in the integration of sympathetic outflow by the paraventricular nucleus of the hypothalamus. Am J Physiol Heart Circ Physiol. 2006;291:H2847–H2856. doi: 10.1152/ajpheart.00625.2005. [DOI] [PubMed] [Google Scholar]
- Lin LH, Talman WT. Coexistence of NMDA and AMPA receptor subunits with nNOS in the nucleus tractus solitarii of rat. J Chem Neuroanat. 2002;24:287–296. doi: 10.1016/s0891-0618(02)00069-8. [DOI] [PubMed] [Google Scholar]
- Liu Y, Ji ES, Xiang S, Tamisier R, Tong J, Huang J, Weiss JW. Exposure to cyclic intermittent hypoxia increases expression of functional NMDA receptors in the rat carotid body. J Appl Physiol. 2009;106:259–267. doi: 10.1152/japplphysiol.90626.2008. [DOI] [PMC free article] [PubMed] [Google Scholar]
- Malenka RC, Nicoll RA. NMDA-receptor-dependent synaptic plasticity: multiple forms and mechanisms. Trends Neurosci. 1993;16:521–527. doi: 10.1016/0166-2236(93)90197-t. [DOI] [PubMed] [Google Scholar]
- Martin DS, Haywood JR. Sympathetic nervous system activation by glutamate injections into the paraventricular nucleus. Brain Res. 1992;577:261–267. doi: 10.1016/0006-8993(92)90282-e. [DOI] [PubMed] [Google Scholar]
- Mayorov DN. Brain superoxide as a key regulator of the cardiovascular response to emotional stress in rabbits. Exp Physiol. 2007;92:471–479. doi: 10.1113/expphysiol.2006.036830. [DOI] [PubMed] [Google Scholar]
- Miyagawa A, Okamura H, Ibata Y. Coexistence of oxytocin and NADPH-diaphorase in magnocellular neurons of the paraventricular and the supraoptic nuclei of the rat hypothalamus. Neurosci Lett. 1994;171:13–16. doi: 10.1016/0304-3940(94)90592-4. [DOI] [PubMed] [Google Scholar]
- Naeije R. Physiological adaptation of the cardiovascular system to high altitude. Prog Cardiovasc Dis. 2010;52:456–466. doi: 10.1016/j.pcad.2010.03.004. [DOI] [PubMed] [Google Scholar]
- Nakamichi N, Yoneda Y. Functional proteins involved in regulation of intracellular Ca(2+) for drug development: desensitization of N-methyl-d-aspartate receptor channels. J Pharmacol Sci. 2005;97:348–350. doi: 10.1254/jphs.fmj04007x4. [DOI] [PubMed] [Google Scholar]
- Park L, Gallo EF, Anrather J, Wang G, Norris EH, Paul J, Strickland S, Iadecola C. Key role of tissue plasminogen activator in neurovascular coupling. Proc Natl Acad Sci U S A. 2008;105:1073–1078. doi: 10.1073/pnas.0708823105. [DOI] [PMC free article] [PubMed] [Google Scholar]
- Peng YJ, Yuan G, Ramakrishnan D, Sharma SD, Bosch-Marce M, Kumar GK, Semenza GL, Prabhakar NR. Heterozygous HIF-1alpha deficiency impairs carotid body-mediated systemic responses and reactive oxygen species generation in mice exposed to intermittent hypoxia. J Physiol. 2006;577:705–716. doi: 10.1113/jphysiol.2006.114033. [DOI] [PMC free article] [PubMed] [Google Scholar]
- Peters A, Palay SL, Webster H. The fine structure of the nervous system. New York: Oxford UP; 1991. [Google Scholar]
- Petralia RS, Yokotani N, Wenthold RJ. Light and electron microscope distribution of the NMDA receptor subunit NMDAR1 in the rat nervous system using a selective anti-peptide antibody. J Neurosci. 1994;14:667–696. doi: 10.1523/JNEUROSCI.14-02-00667.1994. [DOI] [PMC free article] [PubMed] [Google Scholar]
- Prabhakar NR, Dick TE, Nanduri J, Kumar GK. Systemic, cellular and molecular analysis of chemoreflex-mediated sympathoexcitation by chronic intermittent hypoxia. Exp Physiol. 2007;92:39–44. doi: 10.1113/expphysiol.2006.036434. [DOI] [PubMed] [Google Scholar]
- Rameau GA, Chiu LY, Ziff EB. Bidirectional regulation of neuronal nitric-oxide synthase phosphorylation at serine 847 by the N-methyl-d-aspartate receptor. J Biol Chem. 2004;279:14307–14314. doi: 10.1074/jbc.M311103200. [DOI] [PubMed] [Google Scholar]
- Reeves SR, Gozal E, Guo SZ, Sachleben LR, Jr, Brittian KR, Lipton AJ, Gozal D. Effect of long-term intermittent and sustained hypoxia on hypoxic ventilatory and metabolic responses in the adult rat. J Appl Physiol. 2003;95:1767–1774. doi: 10.1152/japplphysiol.00759.2002. [DOI] [PubMed] [Google Scholar]
- Rollenhagen A, Lübke JH. The morphology of excitatory central synapses: from structure to function. Cell Tissue Res. 2006;326:221–237. doi: 10.1007/s00441-006-0288-z. [DOI] [PubMed] [Google Scholar]
- Sánchez F, Alonso JR, Arévalo R, Blanco E, Aijón J, Vázquez R. Coexistence of NADPH-diaphorase with vasopressin and oxytocin in the hypothalamic magnocellular neurosecretory nuclei of the rat. Cell Tissue Res. 1994;276:31–34. doi: 10.1007/BF00354781. [DOI] [PubMed] [Google Scholar]
- Sattler R, Xiong Z, Lu WY, Hafner M, MacDonald JF, Tymianski M. Specific coupling of NMDA receptor activation to nitric oxide neurotoxicity by PSD-95 protein. Science. 1999;284:1845–1848. doi: 10.1126/science.284.5421.1845. [DOI] [PubMed] [Google Scholar]
- Sawchenko PE, Brown ER, Chan RK, Ericsson A, Li HY, Roland BL, Kovács KJ. The paraventricular nucleus of the hypothalamus and the functional neuroanatomy of visceromotor responses to stress. Prog Brain Res. 1996;107:201–222. doi: 10.1016/s0079-6123(08)61866-x. [DOI] [PubMed] [Google Scholar]
- Scott DB, Michailidis I, Mu Y, Logothetis D, Ehlers MD. Endocytosis and degradative sorting of NMDA receptors by conserved membrane-proximal signals. J Neurosci. 2004;24:7096–7109. doi: 10.1523/JNEUROSCI.0780-04.2004. [DOI] [PMC free article] [PubMed] [Google Scholar]
- Stowe DF, Camara AK. Mitochondrial reactive oxygen species production in excitable cells: modulators of mitochondrial and cell function. Antioxid Redox Signal. 2009;11:1373–1414. doi: 10.1089/ars.2008.2331. [DOI] [PMC free article] [PubMed] [Google Scholar]
- Suh YH, Terashima A, Petralia RS, Wenthold RJ, Isaac JT, Roche KW, Roche PA. A neuronal role for SNAP-23 in postsynaptic glutamate receptor trafficking. Nat Neurosci. 2010;13:338–343. doi: 10.1038/nn.2488. [DOI] [PMC free article] [PubMed] [Google Scholar]
- Szabadits E, Cserép C, Ludányi A, Katona I, Gracia-Llanes J, Freund TF, Nyíri G. Hippocampal GABAergic synapses possess the molecular machinery for retrograde nitric oxide signaling. J Neurosci. 2007;27:8101–8111. doi: 10.1523/JNEUROSCI.1912-07.2007. [DOI] [PMC free article] [PubMed] [Google Scholar]
- Togashi H, Sasaki M, Frohman E, Taira E, Ratan RR, Dawson TM, Dawson VL. Neuronal (type I) nitric oxide synthase regulates nuclear factor kappaB activity and immunologic (type II) nitric oxide synthase expression. Proc Natl Acad Sci U S A. 1997;94:2676–2680. doi: 10.1073/pnas.94.6.2676. [DOI] [PMC free article] [PubMed] [Google Scholar]
- Torres G, Lee S, Rivier C. Ontogeny of the rat hypothalamic nitric oxide synthase and colocalization with neuropeptides. Mol Cell Neurosci. 1993;4:155–163. doi: 10.1006/mcne.1993.1019. [DOI] [PubMed] [Google Scholar]
- von Bohlen und Halbach O. Nitric oxide imaging in living neuronal tissues using fluorescent probes. Nitric Oxide. 2003;9:217–228. doi: 10.1016/j.niox.2004.01.001. [DOI] [PubMed] [Google Scholar]
- Washbourne P, Liu XB, Jones EG, McAllister AK. Cycling of NMDA receptors during trafficking in neurons before synapse formation. J Neurosci. 2004;24:8253–8264. doi: 10.1523/JNEUROSCI.2555-04.2004. [DOI] [PMC free article] [PubMed] [Google Scholar]
- Watkins ND, Cork SC, Pyner S. An immunohistochemical investigation of the relationship between neuronal nitric oxide synthase, GABA and presympathetic paraventricular neurons in the hypothalamus. Neuroscience. 2009;159:1079–1088. doi: 10.1016/j.neuroscience.2009.01.012. [DOI] [PubMed] [Google Scholar]
- Weiss ML, Chowdhury SI, Patel KP, Kenney MJ, Huang J. Neural circuitry of the kidney: NO-containing neurons. Brain Res. 2001;919:269–282. doi: 10.1016/s0006-8993(01)03030-x. [DOI] [PubMed] [Google Scholar]
- Yu Q, Shao R, Qian HS, George SE, Rockey DC. Gene transfer of the neuronal NO synthase isoform to cirrhotic rat liver ameliorates portal hypertension. J Clin Invest. 2000;105:741–748. doi: 10.1172/JCI7997. [DOI] [PMC free article] [PubMed] [Google Scholar]
- Zhan G, Serrano F, Fenik P, Hsu R, Kong L, Pratico D, Klann E, Veasey SC. NADPH oxidase mediates hypersomnolence and brain oxidative injury in a murine model of sleep apnea. Am J Respir Crit Care Med. 2005;172:921–929. doi: 10.1164/rccm.200504-581OC. [DOI] [PMC free article] [PubMed] [Google Scholar]
- Zhang K, Patel KP. Effect of nitric oxide within the paraventricular nucleus on renal sympathetic nerve discharge: role of GABA. Am J Physiol. 1998;275:R728–R734. doi: 10.1152/ajpregu.1998.275.3.R728. [DOI] [PubMed] [Google Scholar]
- Zhang K, Li YF, Patel KP. Blunted nitric oxide-mediated inhibition of renal nerve discharge within PVN of rats with heart failure. Am J Physiol Heart Circ Physiol. 2001;281:H995–H1004. doi: 10.1152/ajpheart.2001.281.3.H995. [DOI] [PubMed] [Google Scholar]