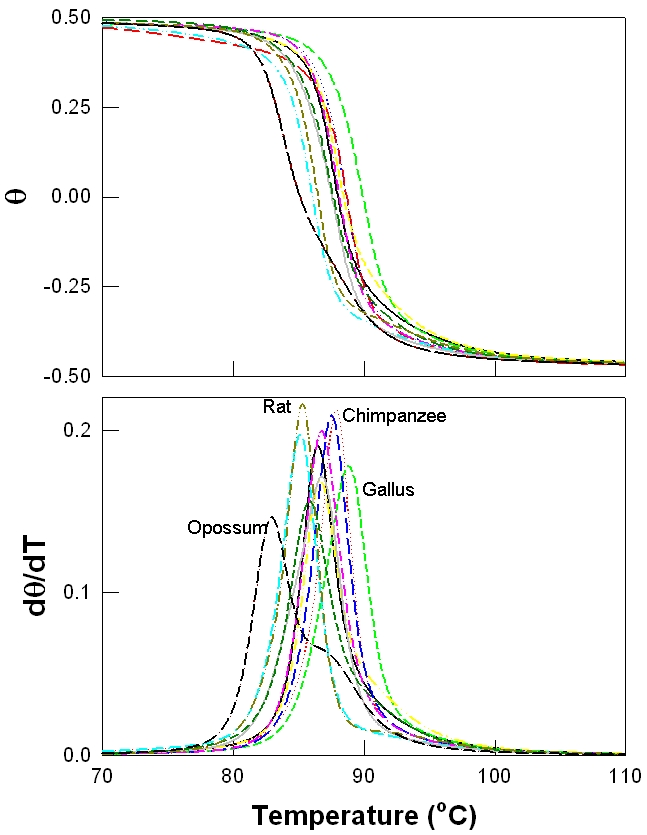
Figure 1.

Melting profiles of betaglobin genes: (a) and their respective first derivatives (b). Some of the sequences are labeled in (b) and the melting profile of Opossum is shown in dark lines.

Melting profiles of betaglobin genes: (a) and their respective first derivatives (b). Some of the sequences are labeled in (b) and the melting profile of Opossum is shown in dark lines.