Abstract
Although many genome sequences have been determined, identification of genes and their elements such as untranslated regions (UTRs), introns, and coding regions is still a significant challenge. We have developed a novel sequencing-based method called RNA-Seq in which cDNA fragments are subjected to high throughput sequencing using the Illumina platform, and short reads are computationally mapped to the genome to identify the transcribed regions. We have successfully applied RNA-Seq to generate a high-resolution transcriptome map of the yeast genome. We demonstrate that most (74.5%) of the unique sequence of the yeast genome is transcribed. We used this method to globally map 5′ UTR and 3′ UTR boundaries and confirmed many known and predicted introns and demonstrated that others are not actively used. Our results suggest an alternative initiation codon from that annotated for a number of known genes and demonstrate that many yeast genes contain upstream open reading frames (uORFs). We also found unexpected 3′ end heterogeneity and the presence of many overlapping genes. We also found many novel transcribed regions not identified by other methods. These results indicate that the yeast transcriptome is more complex than previously appreciated. Furthermore, RNA-Seq is demonstrated to be at least as accurate as DNA microarrays for quantifying RNA expression levels and has a much larger dynamic range. We expect that RNA-Seq will be a valuable general approach for high resolution mapping of transcriptomes in many organisms.
Introduction
A large number of genome sequences have been determined, and with recent advances in DNA sequencing technologies, many more genome sequences are likely to be elucidated. A major challenge ahead is to identify the genes, exons and their boundaries. Such information is crucial for understanding the functional elements of the genome, as well as determining when they are expressed, and how they are regulated and function to mediate complex cellular and developmental processes.
Often genes are identified through the presence of large open reading frames (ORFs) or through sequence conservation (1, 2). The shortcomings of these approaches is that they often fail to identify short exons and do not reveal untranslated regions (UTRs) which can often lie considerable distances from the start and stop codons. Moreover, genes and exons that are not conserved will be overlooked in these analyses; this is particularly problematic for genes and exons that do not encode proteins and whose sequences are often not conserved.
An alternative approach to identify genes is to identify transcribed sequences. Expressed sequence tag (EST) (3) or cDNA sequencing can identify highly expressed transcripts but has difficulty finding those expressed at a low level. Moreover, biases exist for the identification of 3′ ends, and finding the 5′ coding sequences of genes can be difficult. DNA microarrays have proven to be a valuable tool for finding sequences expressed at a low level and generating transcription maps of the genome(4, 5). However, DNA microarrays cannot distinguish similar but non-identical sequences and generally do not have the resolution to precisely identify the 5′ and 3′ boundaries of exons.
Here we describe a novel high throughput sequencing-based approach for global transcriptome mapping called RNA Sequencing (RNA-Seq). In this method cDNA is generated and subjected to massively parallel sequencing using Illumina technology and used to define exons, 5′ and 3′ boundaries, and introns, as well as quantify gene expression levels. We have successfully applied RNA-Seq to map the transcribed regions of the yeast genome.
The yeast genome was initially annotated through the presence of ORFs and subsequently though the identification of sequences conserved with other yeasts(1, 2). More recently, many transcribed regions of the genome have been revealed through the use of DNA tiling arrays (6) and cDNA sequencing (7). Sequencing of cDNAs has revealed that the 5′ ends of many genes are often heterogeneous in their start sites (7). In spite of all of these efforts, the annotation of the yeast genome is far from complete. The 5′ boundary of many genes is not known and the 3′ ends of nearly all yeast genes are not mapped; as such, little is known about the characteristics of yeast UTRs and especially 3′ ends. This information is valuable since UTRs are critical for controlling translation initiation, RNA localization and stability. Moreover, defining the 5′ ends is essential for defining the likely ORFs and thus the protein coding regions of each gene.
Here we use the RNA-Seq approach to determine the comprehensive gene structure and transcriptional landscape of the yeast genome. Our results demonstrate that much of the yeast genome (including intergenic regions) is transcribed, and reveal the presence of many new transcribed regions that were not found by other approaches. Using this method, we mapped the 5′ and 3′ boundaries of most genes, confirmed previously known and predicted introns, and quantified gene expression levels with a high degree of confidence. Our analyses also revealed new initiation codons for many of the annotated yeast genes, identified genes that contain new upstream open frames (uORFs), and demonstrated 3′ end heterogeneity for many yeast genes. In addition to revealing much new information concerning the yeast genome, the RNA-Seq approach described here will greatly facilitate gene discovery and genome annotation in other organisms.
Mapping Transcribed Regions in the Yeast Genome Using RNA Sequencing
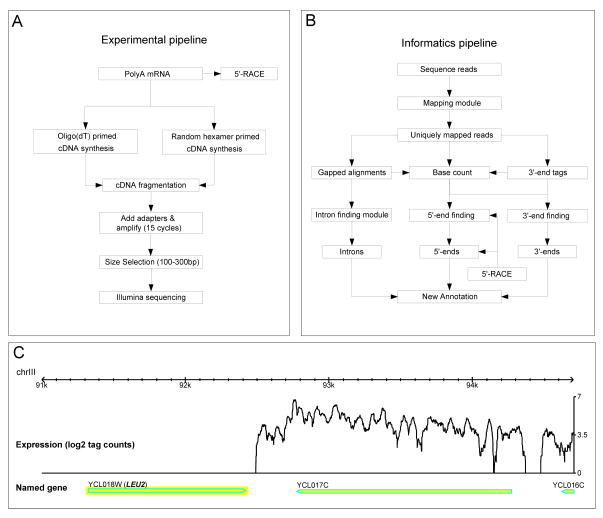
To map the transcribed regions of the yeast genome, we followed the scheme presented in Figure 1. Poly(A) RNA isolated from yeast cells grown in rich media (see Materials and Methods) was used to generate double stranded cDNA by reverse transcription using either random hexamers or oligo(dT) primers. The double stranded cDNA was fragmented and subjected to high throughput Illumina sequencing in which 35 bp of sequence was determined from the fragment ends. Two technical and two biological replicates were performed for each sample of random hexamer and oligo(dT) primed cDNA for a total of 14,125,182 and 15,787,335 reads, respectively. These sequence reads were subjected to informatics analyses (Fig. 1B) using an in-house developed algorithm (see Materials and Methods). To eliminate repeats, sequence reads that map to multiple sites in the yeast genome were removed from subsequent analysis. In addition, to accommodate for polymorphisms and sequence errors relative to the reference genome, up to two mismatches were allowed in the comparison. Of 29,912,517 total reads, 15,870,540 (56%) were mapped to unique regions in the genome using this approach (fig. S1 and Supplemental Table S1).
Figure 1. Flowchart of experimental and informatics of RNA-Seq method.
A) RNA Seq experimental pipeline. B) Informatics pipeline. C) A snapshot of the mapped RNA-Seq reads showing no expression in a deleted gene (LEU2) and an expressed neighboring gene (YCL017C).
The quality of our results was assessed by several criteria. First, none of the 29,912,517 sequence reads matched the 3.5 kb regions of the genome in which URA3, LEU2, MET15, and HIS3 segments were deleted in the yeast strain that we used, and strong signals are particularly apparent over annotated genes (Fig. 1C); thus our mapping is specific. Second, our technical and biological replicates were in close agreement with one another; the technical replicates for each sample had a 0.99 Pearson correlation coefficient; the coefficients for the biological replicates were between 0.93 and 0.95 (fig. S2). In addition, the data generated from random hexamers and oligo(dT) primers were also closely correlated (0.97) and visually showed similar patterns of expression (fig. S2). Therefore, we merged all of these data sets, and the subsequent analyses were performed using the merged data set.
Extensive Expression of the Yeast Genome
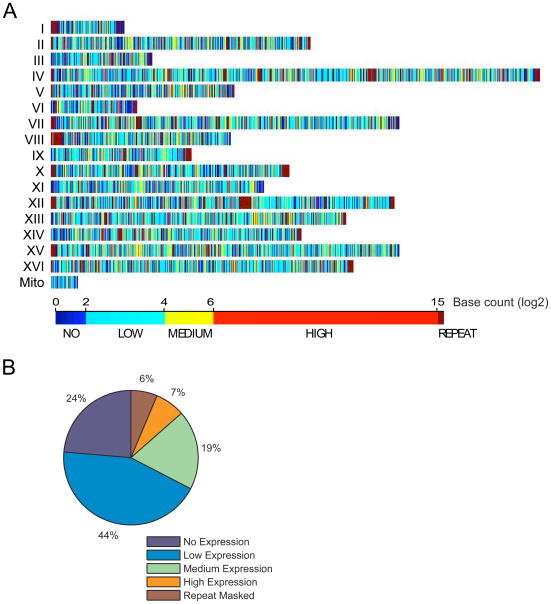
RNA-Seq analyses revealed extensive expression of the whole yeast genome (Fig. 2A and 2B). Mapping of all of the sequenced tags to the yeast genome revealed that a total of 74.5% of the genome is expressed, at least at a low level (Fig. 2C and 2D). We detected more reads from the 3′ ends than from the 5′ ends of annotated genes. This trend is general since an aggregated plot over all yeast genes reveals a similar result (fig. S3). The 3′ bias is presumably due to enrichment of 3′ sequences during poly(A) purification as well as enhanced priming at 3′ ends. In spite of this bias, the deep sequencing allowed detection of signal across the entire gene. Overall, 85% of the bases that we detect as expressed overlapped with those found using DNA tiling microarrays (6)
Figure 2. Extensive expression of the yeast genome revealed by RNA-Seq.
A) The genome distribution of transcribed regions. Colors represent different transcription levels for each base (log2 tag count). B) Distribution of transcribed regions on chromosome VI. C) Histogram of transcribed bases. D) A summary of the transcription level of the transcriptome.
We next used the dataset to investigate the overall transcriptional activity of genes in the genome. Using the scoring system described below which detects transcription above a particular threshold, we detected significant expression for 4,666 of the 5099 annotated ORFs (91.5%) in the Saccharomyces Genome Database (SGD) (Fig. 2). It is important to note that for this analysis we removed 1,178 ORFs whose 3′ ends lie within 100 bp of one another and whose transcripts might overlap. In addition, 237 ORFs were not analyzed because they have non-unique sequences in their 3′-ends. A high expression level was observed for 20% of the genes; Gene Ontology analysis revealed that genes such as those involved in biosynthetic pathways and ion transport are specifically enriched in the highly expressed category, as expected (P < 2.3 × 10−58; see Supplemental Table S2 for complete list). Medium and low expression levels were observed for 39% and 33% of the genes respectively. As expected we did not detect expression of many genes whose function is not required in the growth conditions analyzed. These include genes involved in meiosis, sporulation, mating, cell differentiation, sugar transport, and vitamin metabolism (6). The expression level for 34 genes was validated by qRT PCR (See below).
Mapping Gene Boundaries and UTRs Using RNA-Seq
The 5′ and 3′ UTRs of eukaryotic genes are critical for their regulation and can control translation efficiency, localization and mRNA stability. The majority of yeast genes have been annotated only using ORFs, and thus the 5′ and 3′ boundaries and UTRs of most yeast genes have not been defined. A cDNA sequencing study did reveal 5′ UTRs of many genes and found considerable heterogeneity (7);however, many 5′ ends have not been annotated and little information is available concerning 3′ ends. The RNA-Seq data provides potentially valuable information to map 5′ and 3′ UTRs flanking the ORFs, and thereby accurately predict translation start sites and other interesting features such as upstream ORFs (uORFs).
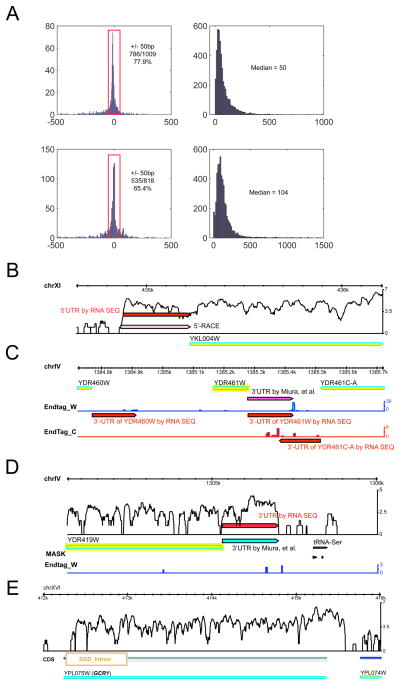
To map the 5′ ends of genes using RNA-Seq, we first generated a very large data set of mapped 5′ ends using RACE. The 5′ ends of 1331 genes were amplified using primers near the ends to generate 5′ RACE PCR products, which were subsequently sequenced and mapped to the genomic sequence (Supplementary Table S4). We then developed an algorithm for mapping the 5′ ends of transcribed regions detected by RNA-Seq by searching for a sharp reduction in signal. Protein coding genes with a very low level of expression were excluded from the analysis. The algorithm was initially trained using a subset of the RACE mapped ends (125 ends from chromosomes I, II and III) and then applied to the entire RNA-Seq dataset. This method allowed us to determine the 5′ boundary regions for 4,665 transcribed yeast genes. Comparison of these results with 1025 boundaries that we mapped using 5′ RACE revealed that the 5′ boundaries identified by the two methods lie within 50 bp of one another for 786 genes (77.9%; Fig. 3A, top left panel). Thus, the 5′ boundaries defined in our analyses are reasonably accurate. We then combined the 5′ RACE results with the RNA-Seq results and defined 5′ boundaries of 4835 yeast genes. An example is shown in Fig. 3B in which the 5′UTR boundary of YKL004W has been defined both by 5′RACE and RNA-Seq data.
Figure 3. Analyses and mapping of 5′ and 3′ gene boundaries.
A) Size differences of 5′-UTR between RNA-Seq and our RACE data (top left) or RNA-Seq 3′-UTR data and cDNA sequencing data(7) (bottom left). Distributions of the size of 5′-UTR (top right) or 3′-UTR (bottom right) is also shown. B) A comparison of 5′-UTR determined by RNA-Seq or by 5′-RACE for gene YKL004W. C) 3′-UTR determined by RNA-Seq based on end tags for gene YDR460W, YDR004W, and YDR461-C, or YDR004W that is also determined by cDNA sequencing (7). Endtag_W and Endtag_C represent RNA-Seq reads that contain polyA tails on either Watson or Crick strands, respectively. D) 3′-UTR determined by RNA-Seq based on sharp expression decrease, comparing to cDNA data(7). End tags information were not used in this case due to low scores. UTR, untranslated region; RACE, rapid implication of cDNA ends
We also determined the 5′ UTR sequence length of yeast genes. The median length was 50 with a range of 0 to 990 bp (Fig. 3A; top right panel). Our analyses revealed 241 genes in which a potential ATG is present less than 10 bp from the 5′ end. Although there are precedents for short 5′ UTRs (8), we do not know if these ATGs or if internal ATGs are used in some or all of these cases.
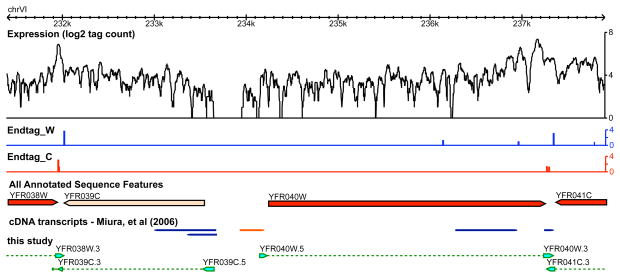
We also globally mapped the 3′ boundaries of yeast genes, which has not been performed previously. Two methods were used: one that searches for a rapid decline in RNA-Seq signal and the other that identifies end tags with poly(A) sequences containing a novel stretch of 3 or more consecutive As that lie next to a genomic yeast sequence. A detailed description of this algorithm will be presented elsewhere. Using these methods we precisely mapped the 3′ boundaries of 5212 transcribed yeast genes and deduced the transcribed strand (Supplementary Table S4). Examples are shown in Fig. 3C and D. Our results are largely consistent with that described using a cDNA sequencing approach. Many of the discrepancies that exist are likely due to the 3′-end heterogeneity (discussed below) (Fig. 3A, bottom left). In addition, the end tags allow RNA-Seq analysis to precisely call 3′boundaries even when transcripts are overlapping at their 3′ends (Fig. 4).
Figure 4. Precise annotation of UTRs using RNA-Seq.
New annotations of the UTRs in a previously well annotated region on chrVI (A) and a relatively poor annotated region on the same chromosome (B). In the new annotation, ORFs are denoted by dotted lines, and arrows denote transcription direction. UTRs are denoted by green shaded boxes flanking the ORFs. cDNA transcripts in red are high confident ones and those in blue are low confident ones (7)
Surprisingly, we found evidence that the transcription of a large number of yeast genes overlaps with transcription from the other strand. Of 4646 verified (i.e. not dubious) ORFs that are expressed, 793 contain overlapping 3′ ends. This compares with 17 ORFs that were annotated in SGD. Thus, overlapping transcription is common in the yeast genome.
The median length of the 3′ UTR was 104 bp with a range of 0 to 1461 bp (Fig. 3A, bottom right panel). Interestingly although most yeast genes have a single precise 3′ end (within 1–2 bp) there are many genes that have heterogeneous 3′ end sequences in a very localized region (usually 2–10 bp) suggesting some variability in 3′ end processing at the polyA signal. In addition, there are 540 genes that appear to be using more than one poly(A) site (i.e. peaks greater than 10 bp apart), which to our knowledge has not been reported previously for yeast. An example of local heterogeneity and multiple 3′ end sites is evident in the well characterized ACT1 gene of yeast (fig. S4); the gene contains at least two regions of polyA addition.
Reannotation of the Yeast Genome
One of the major problems of genomic sequence-based gene annotation is that it is often difficult to predict the precise ATG start codon of a given gene, particularly when the 5′ end of the transcript has not been mapped. In the yeast genome the first ATG at the 5′ end of an ORF is usually annotated as the start codon. However, in some databases, but not all, the second ATG is annotated in cases for which predicted amino terminal protein coding sequence was not conserved (9, 10). The ability to accurately determine the 5′ end should help assess which ATG is the actual start codon; such information is crucial for understanding and characterizing the proteome.
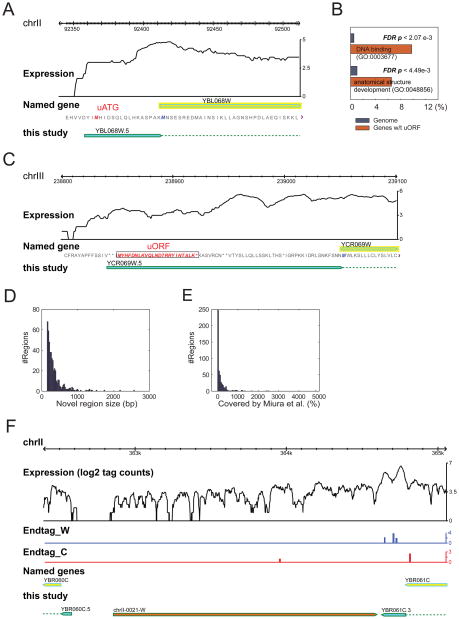
Our RNA-Seq analysis revealed 35 genes whose 5′ end resides upstream of an ATG codon that is 5′ and in-frame to the annotated ATG initiation codon; thus, the protein is potentially longer than previously predicted using the current annotation. Fig. 5A shows the example of YBL068W whose ORF is extended by 16 amino acids. We also found 29 genes whose 5′ end is located downstream of the annotated ATG suggesting that these proteins are shorter than previously predicted. RACE/Sequencing confirmed the 5′ ends for 4 of these genes.
Figure 5. Annotation of upstream ATG, uORF and novel transcribed regions.
A) RNA-Seq reveals genes that may have upstream start codon (uATG, in red) relative to the existing annotated ATG (blue). B) Some genes have ORFs (uORFs) upstream of the major annotated ORF. GO analysis revealed that they are significantly enriched in DNA binding (molecular function) and anatomical structure and development (biological process). P-values are False Discovery Rate adjusted. C) An example of uORF (boxed and in red). D) Size distribution of novel transcribed regions. E) Novel transcribed regions that have been covered by cDNA sequencing(7) in percentages. F) An example of a novel transcribed region with a polyA signal (shaded in red).
We also examined our RNA-Seq and RACE data for the presence of introns. Many introns have been reported in yeast based on sequence conservation, microarray analyses or other studies. Few have been experimentally verified by sequence analysis. We developed an algorithm for detecting introns through the presence of discontinuous sequences whose boundaries contained GT and AG/AC as well as sequence tags that span the intron boundary. This algorithm readily detected 240 of 306 known introns. This included three examples of introns that were not annotated at the time of our analyses. Sequence tags that spanned all 240 verified that transcripts from these genes are spliced. An example of an intron confirmed by RNA-Seq is shown in Fig. S4. Overall, this work provides the first experimental sequence confirmation of nearly all yeast introns.
For the 66 introns that are not validated by the above method, we also examined 30 whose parental genes are expressed. In four cases, YPL075W, YKL150W, YNL128W-A and YKL186C, the intron sequences are clearly expressed at similar levels as the adjacent ORF (Fig. 3E and fig. S5); furthermore we did not find evidence for splice junction tags for these genes but we did find evidence for unspliced products. Thus, we believe that transcripts from these genes are not spliced at appreciable levels in vegetative cells. For one of these cases a similar conclusion was suggested from microarray data (11). Two of these cases affect the predict protein sequence. Thus, overall RNA-Seq can facilitate to validate introns as well as rule out their significant presence within an RNA population.
Upstream ORFs are Present in Many 5′ UTRs of Yeast Genes
Recent analysis of eukaryotic genomes predicts that many 5′ UTRs may contain uORFs (12). 17 yeast genes have been identified with uORFs, and uORFs upstream of the yeast GCN4 and CPA1 genes have been shown to regulate the expression of the Gcn4 protein(13) and degradation of the CPA1 mRNA (14) respectively. Our RNA-Seq and 5′ RACE data predict uORFs upstream of the start codon for 321 (6%) of yeast gene transcripts (Fig. 5). These uORFs are predicted to encode proteins ranging in size from 50–120 amino acids. GO analysis of these genes reveals that genes encoding DNA binding proteins (P < 0.0027, FDR adjusted) and anatomical structure and development (e.g. sporulation; P< 0.0045, FDR adjusted) are significantly enriched for uORFs (Fig. 5B). The presence of uORFs in DNA binding proteins is quite interesting as it suggests that these genes are likely to be extensively regulated at a translational level. Thus, many yeast genes contain uORFs capable of producing small proteins and/or regulating their downstream genes.
Detection of Novel Transcribed Regions
Our analysis of cDNA sequences of polyA(+) RNA revealed extensive transcription in intergenic regions (Fig 5D). Therefore, we systematically searched intergenic regions for stretches of 150 bp or greater whose expression is statistically significant (see Methods). An example has been shown in Fig. 5F. We classified 487 regions with signals well above surrounding regions. Of these, 204 novel regions had not been observed by microarray analyses or cDNA studies. We tested 18 regions found by RNA-Seq, but not other methods, for confirmation of expression using quantitative RT-PCR experiments and random hexamer and oligo(dT) primed cDNA; in 16 cases the regions were found to be transcribed (Supplemental Table S3). Thus, RNA-Seq results indicate that a number of novel regions in the yeast genome are transcribed and present in polyA(+) RNA.
Quantitative Monitoring of Gene Expression Levels Using RNA-Seq
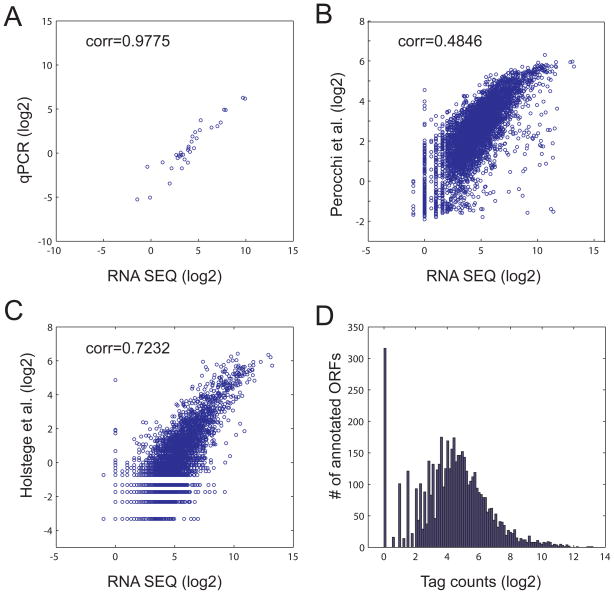
RNA-Seq is a quantitative method and can therefore be used to quantify RNA levels in the cell. It is of high sensitivity and, thus, potentially more accurate than microarray-based methods, at least for genes expressed at a low level. To determine if RNA-Seq data can be used to quantify gene expression, we determined the median signal in a 30 bp window located immediately upstream of the 3′ ends of the annotated stop codon (Supplementary Table S4); genes with overlapping 3′ ends in this region were removed from this analysis. Subsequently, the expression levels of 34 genes predicted to be expressed at a range of high, medium, and low levels were measured by qPCR. We found a strong correlation (R=0.98) between the qPCR and RNA-Seq data (Fig. 6A). As expected, the discrepancies are largest among the genes expressed at a low level. The results were better than those obtained by measurements of RNA expression in a similar yeast strain using standard expression microarrays (R=0.72; Fig. 6C. (15) or tiling DNA microarray analysis (R=0.48; Fig. 6B and (16)). Moreover, the dynamic range of RNA-Seq is at least 8000 fold as compared to ~60 fold for DNA microarrays (see Fig. 6 scale of panels B and C). These results indicate that RNA-Seq can be used to accurately quantify RNA expression levels and has a superior dynamic range as compared to DNA microarrays.
Figure 6. Comparison between RNA-Seq data with qPCR, tiling array and gene expression microarrays.
A) Comparison of the transcription level for 34 ORFs determined by RNA-Seq or quantitative PCR (qPCR). B) Comparison of the transcription level for 4,846 ORFs determined by RNA-Seq with published tiling array (16). C) Comparison of the transcription level for 4,422 ORFs determined by RNA-Seq with the published gene expression microarrays (15). Pearson linear correlation coefficients (corr) are shown in A–C. D) Transcription level distribution for 5,099 ORFs by RNA-Seq.
Discussion
Here we describe a novel RNA-Seq method to map transcribed regions of sequenced genomes. This method offers several advantages compared to existing technologies, particularly DNA microarrays, which are currently the most commonly used tool for mapping transcribed regions(4, 5). First, it allows interrogation of all unique sequences of the genome, including those that are closely related; as long as unique bases exist they can be monitored. Microarrays often cannot readily distinguish closely related sequences due to cross-hybridization. Second, because a large number of reads can readily be obtained, the method is very sensitive and offers a large dynamic range; we found that RNA-Seq has an 8000 fold dynamic range (see Fig. 6). This is likely due to the low background of RNA-Seq; indeed, analysis of over 29 Million reads did not reveal a single tag that corresponded to deleted regions of the genome. Thus, RNA-Seq can detect and quantify levels of RNAs expressed at very low levels. In contrast, DNA microarrays have a dynamic range of 60–100 fold and the quantification of RNAs expressed at a low level can be difficult; the reduced dynamic range of microarrays is likely due, at least in part, to cross-hybridization to the different probes in the array. Indeed, comparison of our RNA-Seq data with that of published results (15) revealed that RNA-Seq was significantly better for quantification of RNA levels than standard gene expression microarrays. Third, RNA-Seq can allow accurate determination of exon boundaries. The 3′ polyA signature offers a precise definition of 3′ UTR boundaries, and mapping of discontinuous sequences coupled with the recognition of splicing consensus sequence allows discovery of introns. In principle, determination of the exact boundaries of 5′ ends by overrepresentation of 5′ end sequences is also possible. However, because a) yeast 5′ ends are often heterogeneous (7, 17) and b) we performed an amplification step we did not obtain nucleotide resolution in our study. Rather, an approximate location was deduced by a sharp transition in signal over a small interval. Nonetheless, overall we provide a useful map of exon boundaries with the RNA-Seq approach.
Using RNA-Seq we generated a high-resolution transcription map of the yeast genome. We globally mapped the 3′ ends of the yeast genome for the first time and found remarkable heterogeniety at the 3′ ends of many yeast genes. A large fraction of genes contain local heterogeneity in 3′ ends suggesting differential local processing events. In addition we found more than one polyA location for 540 yeast genes, suggesting different regions of polyA site selection. In many organisms, alternative polyA sites have been shown to produce unique transcripts with distinct biological properties by altering their protein coding capacity (18) translational regulation (19, 20), stability (21) and intracellular localization(22). It will therefore be important to determine if differential functions exist for the alternative 3′ UTRs of yeast genes with multiple polyA addition sites.
One important aspect of our study is the discovery that S. cerevisiae contains a large number (793) of expressed genes with overlapping 3′ ends. Pervasive occurrence of overlapping transcripts property may be a unique feature to S. cerevisiae and other organisms that lack Dicer homologs and thereby avoid mRNA processing and degradation. Overlapping transcription at the 3′ ends could lead to interesting forms of gene regulation in which neighboring genes can potentially influence the expression of one another.
In addition to revealing alternative 3′ ends of genes, RNA-Seq allowed us to map the 5′ ends and introns of the majority of yeast genes. We found that the first ATG in 35 genes resides upstream of the annotated start codon in SGD, and for 29 others the first ATG lies downstream of the annotated start codon. Although we cannot ascertain that the upstream ATGs are used in translation, they are consistent with the expectation that the first ATG is usually used in eukaryotes (23). For cases where the 5′ end is mapped downstream of the annotated ATG, we presume that a downstream ATG is used, at least in the vegetative growth conditions that we analyzed. It is possible that a longer message and the annotated ATG is used in other cell types. Finally, we confirmed the existence of 240 introns. Interestingly we observed instances in which there an annotated intron but no evidence for splicing; the lack of sequence tags that span the intron indicates that they are not abundantly spliced at least in vegetative cells. In two instances presence or absence of the intron affect the resulting protein product. Thus, RNA Seq can define the presence of introns as well as their absence, at least at a particular level within an mRNA population.
The mapping of 5′ ends is particularly valuable for understanding not only gene regulation but also biochemical and genetic characterization of the genome. Currently extensive efforts are underway to biochemically characterize the yeast genome using protein microarrays and other methods (24, 25). Likewise, efforts to genetically characterize the yeast genome are underway using overexpression experiments and other methods (26). Assignment of the proper ATG is crucial for ensuring that the entire native protein and gene is analyzed in these studies. Therefore, the reannotated data generated in this analysis will provide a valuable resource to the scientific community for characterization of gene and protein function.
Our study also revealed a large number of genes (321) with uORFs, which have been implicated in gene regulation (27). In yeast, thus far only 17 genes have been reported to contain uORFs (27). Therefore, our data indicate that uORFs are much more prevalent than previously appreciated, indicating that many genes may be regulated using uORFs. Our finding that many DNA binding proteins contain uORFs suggests that these key regulators are often likely to contain additional mechanisms controlling their regulation. To date only the expression of the GCN4 (13) and CPA1 (28) have been shown to be controlled by uORFs; our results suggest that this mechanism is much more widespread.
Our method of analyzing polyA RNA using fragmentation of yeast cDNA proved useful for defining gene boundaries. We have also varied the RNA Seq protocol by preparing RNA lacking ribosomal RNA. Fragmentation of this RNA and then generation of cDNA using random primers followed by Illumina sequencing of the ends revealed more uniform gene coverage. However, the gene boundary definition was not as distinctive for yeast genes and thus the resulting data were not as useful for this study.
In addition to characterizing known yeast genes, we also found evidence for novel transcribed regions of the yeast genome. We find that, overall much (74.5%) of the yeast genome is transcribed. We believe this transcription is not an artifact because of the very low background of RNA-Seq. Moreover, these data are consistent with previous studies in which lacZ insertions lacking an initiation ATG are often expressed even when located in intergenic regions (29, 30). The extensive transcription of the yeast genome allows a significant fraction of the genome to be expressed and therefore is likely to be valuable for the evolutionary selection of novel gene function(31).
Analysis of the intergenic regions reveals that many of them likely form novel transcription units. The exact number of novel transcription units is difficult to determine since it is subject to an arbitrary threshold, but there are at least 487 transcribed regions of high confidence. Of these, 204 have been discovered only by RNA-Seq. Examination of 18 novel transcribed regions using qRT PCR confirms that the majority are expressed, indicating that these regions make bona fide RNAs in yeast.
In conclusion, our novel RNA-Seq method described here allowed us to map the transcriptional landscape of the yeast genome and define for the first time UTRs and many novel transcribed regions. In the future, application of this method should aid in determining precise transcriptional landscape of other genomes, including those of complex mixtures of organisms.
Supplementary Material
Acknowledgments
We thank Savithramma Dinesh-Kumar for comments on the manuscript. The work was supported by grants from the NIH and CT Stem Cell Fund.
References
- 1.Snyder M, Gerstein M. Science. 2003;300:258. doi: 10.1126/science.1084354. [DOI] [PubMed] [Google Scholar]
- 2.Gerstein MB, et al. Genome Res. 2007;17:669. doi: 10.1101/gr.6339607. [DOI] [PubMed] [Google Scholar]
- 3.Adams MD, et al. Nature. 1995;377:3. [PubMed] [Google Scholar]
- 4.Kapranov P, et al. Science. 2002;296:916. doi: 10.1126/science.1068597. [DOI] [PubMed] [Google Scholar]
- 5.Bertone P, et al. Science. 2004;306:2242. doi: 10.1126/science.1103388. [DOI] [PubMed] [Google Scholar]
- 6.David L, et al. Proc Natl Acad Sci U S A. 2006;103:5320. doi: 10.1073/pnas.0601091103. [DOI] [PMC free article] [PubMed] [Google Scholar]
- 7.Miura F, et al. Proc Natl Acad Sci U S A. 2006;103:17846. doi: 10.1073/pnas.0605645103. [DOI] [PMC free article] [PubMed] [Google Scholar]
- 8.Teilhet M, Rashid MB, Hawk A, Al-Qahtani A, Mensa-Wilmot K. Gene. 1998;222:91. doi: 10.1016/s0378-1119(98)00470-3. [DOI] [PubMed] [Google Scholar]
- 9.Kellis M, Patterson N, Endrizzi M, Birren B, Lander ES. Nature. 2003;423:241. doi: 10.1038/nature01644. [DOI] [PubMed] [Google Scholar]
- 10.Cliften P, et al. Science. 2003;301:71. doi: 10.1126/science.1084337. [DOI] [PubMed] [Google Scholar]
- 11.Juneau K, Palm C, Miranda M, Davis RW. Proc Natl Acad Sci U S A. 2007;104:1522. doi: 10.1073/pnas.0610354104. [DOI] [PMC free article] [PubMed] [Google Scholar]
- 12.Mignone F, Gissi C, Liuni S, Pesole G. Genome Biol. 2002;3:REVIEWS0004. doi: 10.1186/gb-2002-3-3-reviews0004. [DOI] [PMC free article] [PubMed] [Google Scholar]
- 13.Hinnebusch AG. Annu Rev Microbiol. 2005;59:407. doi: 10.1146/annurev.micro.59.031805.133833. [DOI] [PubMed] [Google Scholar]
- 14.Ruiz-Echevarría MJ, Peltz SW. Cell. 2000;101:741. doi: 10.1016/s0092-8674(00)80886-7. [DOI] [PubMed] [Google Scholar]
- 15.Holstege FC, et al. Cell. 1998;95:717. doi: 10.1016/s0092-8674(00)81641-4. [DOI] [PubMed] [Google Scholar]
- 16.Perocchi F, Xu Z, Clauder-Münster S, Steinmetz LM. Nucleic Acids Res. 2007;35:e128. doi: 10.1093/nar/gkm683. [DOI] [PMC free article] [PubMed] [Google Scholar]
- 17.Albright CF, Robbins RW. J Biol Chem. 1990;265:7042. [PubMed] [Google Scholar]
- 18.Chuvpilo S, et al. Immunity. 1999;10:261. doi: 10.1016/s1074-7613(00)80026-6. [DOI] [PubMed] [Google Scholar]
- 19.Knirsch L, Clerch LB. Biochem Biophys Res Commun. 2000;272:164. doi: 10.1006/bbrc.2000.2754. [DOI] [PubMed] [Google Scholar]
- 20.Iseli C, et al. Genome Res. 2002;12:1068. doi: 10.1101/gr.62002. [DOI] [PMC free article] [PubMed] [Google Scholar]
- 21.Touriol C, Morillon A, Gensac MC, Prats H, Prats AC. J Biol Chem. 1999;274:21402. doi: 10.1074/jbc.274.30.21402. [DOI] [PubMed] [Google Scholar]
- 22.Kislauskis EH, Zhu X, Singer RH. J Cell Biol. 1994;127:441. doi: 10.1083/jcb.127.2.441. [DOI] [PMC free article] [PubMed] [Google Scholar]
- 23.Kozak M. Proc Natl Acad Sci U S A. 1995;92:7134. doi: 10.1073/pnas.92.15.7134. [DOI] [PMC free article] [PubMed] [Google Scholar]
- 24.Zhu H, et al. Science. 2001;293:2101. doi: 10.1126/science.1062191. [DOI] [PubMed] [Google Scholar]
- 25.Gelperin DM, et al. Genes Dev. 2005;19:2816. doi: 10.1101/gad.1362105. [DOI] [PMC free article] [PubMed] [Google Scholar]
- 26.Sopko R, et al. Mol Cell. 2006;21:319. doi: 10.1016/j.molcel.2005.12.011. [DOI] [PubMed] [Google Scholar]
- 27.Vilela C, McCarthy JE. Mol Microbiol. 2003;49:859. doi: 10.1046/j.1365-2958.2003.03622.x. [DOI] [PubMed] [Google Scholar]
- 28.Werner M, Feller A, Messenguy F, Piérard A. Cell. 1987;49:805. doi: 10.1016/0092-8674(87)90618-0. [DOI] [PubMed] [Google Scholar]
- 29.Ross-Macdonald P, et al. Nature. 1999;402:413. doi: 10.1038/46558. [DOI] [PubMed] [Google Scholar]
- 30.Kumar A, et al. Nat Biotechnol. 2002;20:58. doi: 10.1038/nbt0102-58. [DOI] [PubMed] [Google Scholar]
- 31.Coelho PS, Kumar A, Snyder M. Curr Opin Microbiol. 2000;3:309. doi: 10.1016/s1369-5274(00)00095-3. [DOI] [PubMed] [Google Scholar]
Associated Data
This section collects any data citations, data availability statements, or supplementary materials included in this article.


