Abstract
Optical coherence tomography (OCT) provides high-resolution, cross-sectional imaging of tissue microstructure in situ and in real-time, while fluorescence molecular imaging (FMI) enables the visualization of basic molecular processes. There are great interests in combining these two modalities so that the tissue's structural and molecular information can be obtained simultaneously. This could greatly benefit biomedical applications such as detecting early diseases and monitoring therapeutic interventions. In this research, an optical system that combines OCT and FMI was developed. The system demonstrated that it could co-register en face OCT and FMI images with a 2.4 × 2.4 mm field of view. The transverse resolutions of OCT and FMI of the system are both ~10 μm. Capillary tubes filled with fluorescent dye Cy 5.5 in different concentrations under a scattering medium are used as the phantom. En face OCT images of the phantoms were obtained and successfully co-registered with FMI images that were acquired simultaneously. A linear relationship between FMI intensity and dye concentration was observed. The relationship between FMI intensity and target fluorescence tube depth measured by OCT images was also observed and compared with theoretical modeling. This relationship could help in correcting reconstructed dye concentration. Imaging of colon polyps of APCmin mouse model is presented as an example of biological applications of this co-registered OCT/FMI system.
Keywords: Optical Coherence Tomography (OCT), fluorescence molecular imaging, colon cancer
1. Introduction
Early detection of neoplastic changes before metastasis occurs remains a critical objective in clinical cancer diagnosis and treatment. Excisional biopsy and histopathology is currently the gold standard for cancer diagnosis. However, it can suffer from false negative rates due to sampling errors. Optical imaging technologies can provide real-time imaging of human tissues in vivo with resolutions approaching that of histopathology and are able to reveal the biochemical and/or molecular information; therefore they could significantly improve the identification of malignancies at curable stages. The ability to assess tissue architectural morphology (such as the alterations in glandular or stromal morphology) and molecular information (such as up-regulation of receptors and over-expression of enzymes), in vivo and in real time, without the need for tissue excision, would be a major advance in cancer diagnostics and therapy.
Optical coherence tomography (OCT) is an emerging medical diagnostic imaging technology that enables micron-scale, cross-sectional imaging of microstructure in biological tissues in situ and in real time [1, 2]. OCT imaging is analogous to B-mode ultrasound, except that OCT is performed by measuring the echo time delay and intensity of reflected or backscattered light rather than sound. An optical beam is scanned across the tissue and the backscattered light is measured as a function of axial depth and transverse position. In this way, OCT can generate cross-sectional, tomographic images of subsurface tissue microstructure. Three-dimensional tissue morphology can be formed by stacking a series of two-dimensional OCT tomograms. OCT can perform imaging with resolutions approaching that of conventional histopathology, but without the need of tissue removal. Standard-resolution OCT technology has image resolutions of 10–15 μm, and ultrahigh resolutions of 1–2 μm has been achieved using state-of-the-art laser technologies [3]. OCT imaging can be performed using noninvasive or minimally invasive optical delivery systems such as microscopes, handheld probes, endoscopes, catheters, laparoscopes, and needles that enable noninvasive or minimally invasive internal body imaging [4-6]. OCT imaging can be performed in real time, thus allowing the guidance of conventional excisional biopsy or real-time assessment of tissue pathologies.
In contrast to the anatomical information provided by OCT, fluorescence imaging provides the biochemical and metabolism information [7-9]. Therefore there are great interests to combine these two modalities to provide both the structural and functional information to assess the biological tissue more comprehensively and enhance the disease detection capability. Kuranov et al. combined OCT and laser induced fluorescence (LIF) using aminolevulinic acid (ALA) to improve the identification of tumor boundaries in the cervix [10, 11]. Pan et al. reported that ALA fluorescence-guided endoscopic OCT could enhance the efficiency and sensitivity of early bladder cancer diagnosis [12]. In an animal model studies, they demonstrated that the specificity of fluorescence detection of transitional cell carcinoma was significantly enhanced by fluorescence-guided OCT (53% vs. 93%), and the sensitivity of fluorescence detection also improved by combination with OCT (79% vs. 100%) [13]. Tumlinson et al. have developed a combined OCT and LIF spectroscopy imaging catheter for in vivo mouse colon imaging [14]. This miniaturized 2 mm diameter catheter has been used to monitor the disease progression in mouse colon longitudinally, and is able to identify colorectal adenomas in murine models [15-17]. Podoleanu et al. have reported the combined OCT and confocal laser scanning ophthalmoscopy (SLO) with integrated simultaneous fluorescence detection using Indocyanine green (ICG), and demonstrated the synergy between the functional and anatomic information will provide a more complete view of the pathologic conditions of a variety of macular diseases [18-20].
Using the fluorescence contrast agents which target to specific molecular processes, fluorescence molecular imaging (FMI) could reveal molecular information associated with specific disease development. Previous research has shown that cancerous tumors can be identified with fluorescent markers [21, 22]. In a study done in mice, it was shown that adenomatous polyps in the colon express 36% more of the proteolytic enzyme cathepsin B than normal tissue [23]. The adenomas in the animals injected with 2 nmole of cathepsin B probe showed a remarkably higher target to background contrast. On average, contrast was about 2 fold higher in large adenomas. Only after administration of the imaging probe, these lesions were highly conspicuous and even small adenomas, about 50 μm in diameter, could be readily identified [23].
In this research, we combined the OCT with FMI to investigate the correlation between OCT structural features and FMI molecular information. The system demonstrated co-registered en face OCT and FMI imaging with ~ 10 μm resolution. Relationships of FMI intensity and dye concentration as well as FMI intensity and target fluorescence tube depth are studied. The capability of imaging biological tissue was demonstrated by imaging the mouse colon cancer model ex vivo using molecular contrast agent targeting glycoprotein over-expression.
2. Methods
2.1 Optical Coherence Tomography (OCT)
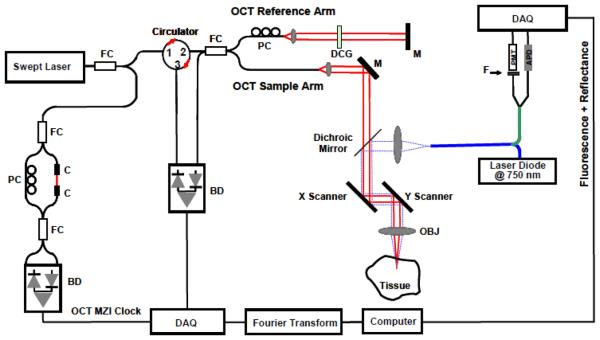
Figure 1 shows the schematic of the co-registered OCT and fluorescence imaging system. The fiber-based high-speed, high-resolution OCT system utilizes a wavelength-swept laser as the light source. It generates a broadband spectrum of 100 nm at 1300 nm, which provides an axial resolution of 10 μm in the tissue. The laser operates at a sweep rate of 16 kHz (equivalent to an imaging speed of 15 frames per second for a 1024 axial-line image) with an average output power of 12 mW. The system sensitivity is 95 dB. A Michelson interferometer composed of one circulator and a fiberoptic 50/50 splitter is used to generate the Fourier-domain OCT signal. The OCT interference signal returned from both the sample and reference arms is detected by a balanced photodetector. A Mach-Zehnder interferometer (MZI) with a fixed path difference is used to generate an optical frequency clock. Data acquisition is triggered by the zero-crossings of the MZI fringes, which are evenly spaced in optical frequency. Discrete Fourier transform (DFT) is performed on the data to generate an axial depth profile of the sample (A-line) with 3 mm imaging depth (2.3 mm in tissue) with 512 pixels [24].
Figure 1.
Schematic of the integrated OCT/FMI system. The left side is the OCT imaging subsystem and the right side is the FMI imaging subsystem. They are combined by a dichroic mirror in the sample arm. FC: fiber coupler; PC: polarization control; C: collimator, MZI: Mach-Zehnder interferometer (frequency clocks), M: mirror, BD: balanced detector, DAQ: data acquisition board, DCG: dispersion compensating glasses, OBJ: objective; PMT: Photomultiplier Tube; APD: Avalanche Photodiode; F: Fluorescence Filter.
2.2 Fluorescence Molecular Imaging (FMI)
The fluorescence molecular imaging (FMI) system uses a continuous-wave (CW) laser diode at 675 nm as the excitation source. The excitation light is combined with the OCT sample arm by a dichroic mirror. The typical illumination power on the sample is approximately 1 mW. The reflectance and fluorescence light is detected by the same fiber and then connected to a fiber splitter to divide the collected light into reflectance and fluorescence signals. The simultaneous measurement of reflectance and fluorescence signals from the same source and detector geometry is important for minimizing the influence of optical coupling variation for both excitation and collection paths. The reflectance signals are detected by an avalanche photodiode (APD), while the fluorescence signals first pass through an emission filter set (700 ± 10 nm), and then are detected by a photomultiplier tube (PMT). The excitation and filter wavelength are chosen based on the excitation and emission properties of the near-infrared dye Cy5.5, which is used in our phantom experiments. Such a system can be readily adapted to image other fluorescence dyes with different excitation/emission wavelengths by changing the excitation laser and the emission filter set.
In our FMI system, the reflectance measurement detected by APD is used as a reference measurement for calibration/normalization of the fluorescence signals. Since the reflectance measurement is obtained from the same source and detector geometry, it would be affected by the same light source fluctuation, light illumination coupling factor and optical detection coupling factor as the fluorescence measurement. By dividing the reflectance data from the fluorescence data, we could eliminate most noises and errors from laser source power fluctuation, non-uniform illumination and non-uniform sensitivity of the collection optics over the scanning field of view.
This normalization procedure would work if (1) all reflection is diffuse reflection and no specular reflection; (2) the ratio of reflection coefficients at FMI excitation wavelength (675 nm) and emission wavelength (700 nm) is constant over the field of view. The first assumption is valid for most tissue regions and can be further reduced by adding a cross-polarizer. Since the FMI excitation wavelength (675 nm) and emission wavelength (700 nm) is very close, in general the second assumption is also valid for most tissues and phantoms. This relationship is further supported by Eq. (2) discussed below.
2.3 Molecular Imaging Contrast Agent
Colorectal cancer is the third most common form of cancer, and the second leading cause of cancer death in the United States [25]. OCT has strong translational potential for endoscopic imaging for identification of colonic pathologies [26-28] For FMI, besides the cathepsin-based contrast agents [23], Roney et al. recently demonstrated that the legume lectin Ulex europaeus agglutinin I (UEA-1) binds the surfaces of adenomatous polyps in specimens of colorectal cancer from the APCMin mouse model. The carbohydrate α-L-fucose, which is over-expressed on the surfaces of polyps, facilitates the bond with UEA-1. Thus, α-L-fucose may be a possible biomarker to target and detect colon adenomas by molecular imaging methods [29].
The details of the synthesis of the molecular contrast agent UEA-1 conjugated polymerized liposomes have been described elsewhere [29]. Basically, the contrast agent contains the fluorescence dye Lissamine Rhodamine PE, therefore, in order to image this specific contrast agent, we used a laser source with 532 nm excitation and a fluorescence filter with 600 ± 10 nm.
2.4 Animal Model
Excised small and large bowels (N=4) of male C57BL/6J APCMin/+ mice were commercially purchased from the Jackson Laboratory (stock #002020, 8 wks), and stored at −80 °C until further use. The bowels were thawed to room temperature (RT, 15-20 mins), cut along the longitudinal axis, and preserved in formaldehyde (RT, 15 mins) before the commencement of staining. The specimens were incubated in UEA-1 conjugated and non-conjugated liposomes (containing 0.4 μM Lissamine Rhodamine PE) at room temperature for 45 mins. The specimens were then washed in PBS, before being mounted and imaged by OCT/FMI system.
3. Results and Discussion
3.1 Co-registration of En Face OCT Imaging with FMI
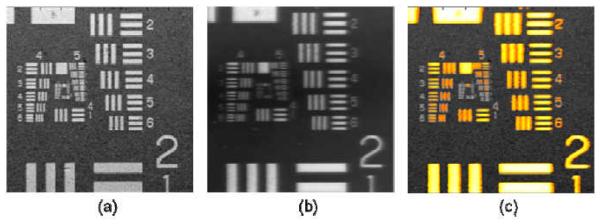
Figure 2 demonstrates the co-registered OCT and FMI images with a 2.4×2.4 mm field-of-view (FOV). The transverse resolutions of both OCT and FMI are characterized by imaging the USAF resolution target under the scattering medium containing 1% Intralipid and 15 μM Cy5.5 (d = 200 μm, absorption coefficient μa = 3.0 cm−1, calculated from Cy 5.5 molar absorptivity [30], scattering coefficient μs ~ 42 cm−1 at FMI wavelengths, i.e. 675 – 700 nm). The transverse resolution of both the OCT and FMI system measured to be 10 μm (line pairs in group 5 element 5 can be resolved). The size of FOV can be readily changed from 1-5 mms by varying the galvanometer driving voltages, and the transverse resolution can also be modified by using objectives with different numerical apertures (NA).
Figure 2.
(a) OCT en face image of the USAF target submerged 200 μm under the solution containing 1% Intralipid and 15 μM Cy 5.5; (b) the en face FMI image of the same target; (c) Co-registered OCT/FMI image (OCT image is displayed in gray scale, and the FMI image is threshold by 30% and displayed in orange-yellow color scale in order to facilitate the simultaneous viewing).
The metal line pairs in the USAF target have higher reflectivity than the surrounding transparent glass area, so (1) more fluorescent light was reflected back to the detector in line pairs areas; (2) some excitation light was reflected back to the layer and excite more fluorophore in the layer. Both events increased the fluorescence intensity in line pairs areas and therefore caused large contrast in fluorescence intensity over the field of view. Therefore, USAF target can be imaged using FMI although the fluorophore was only contained in the layer above the target.
3.2 Characterization of FMI Signal
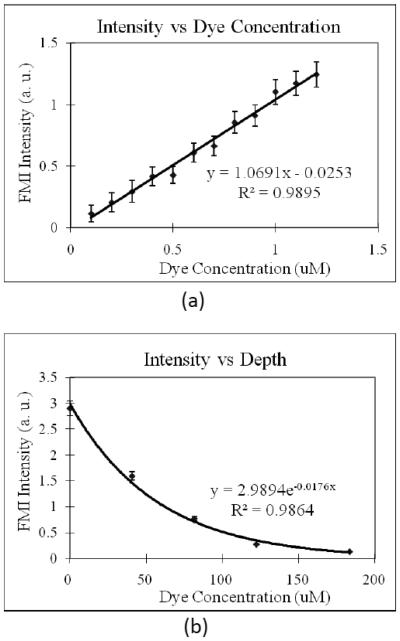
A capillary tube (with 400 μm inner-diameter and 900 μm outer-diameter) filled with different concentration of fluorescence dye Cy 5.5 was used as a phantom. It was placed in the scattering medium containing 2% intralipid (μs ~ 83 cm−1 at FMI wavelengths, the scattering coefficient is close to skin scattering coefficient [31]). In the first part of the experiment, the center of the tube is set at 500 μm beneath the surface and different concentration of Cy 5.5 was filled into the tube. FMI intensity was then measured for each concentration. Titration of Cy5.5 concentration reveals a linear relationship between the FMI intensity and the dye concentration as shown in Figure 3 (a). Our result is consistent with previous report [32].
Figure 3.
(a) Relationship of fluorescence intensity versus Cy 5.5 concentration. A 400 μm inner-diameter capillary tube filled with different concentration of Cy 5.5 was placed in 2% intralipid (similar to skin scattering) and with the center at 500 μm beneath the surface. (b) Relationship of fluorescence intensity versus capillary tube depth (labeled with the depth of the top surface, i.e., the thickness of the scattering medium overlaying the tube). The concentration of Cy 5.5 inside the tube was fixed at 1 μM.
In the second part of the experiment with the phantom, the relationship of the FMI intensity and the tube (dye) depth was studied by setting concentration of Cy 5.5 inside the capillary tube at 1 μM and varying the tube depth (measured from the top surface of the tube) from 0 μm to 200μm. The result, as presented in Figure 3(b), shows that the relationship can be well fitted into exponential function. It is consistent with other group's report [33], which expects for small depths:
| (1) |
where μt = μs + μa is the total extinction coefficient. Both the absorption coefficient μa of 10% intralipid and water are less than 0.01 cm−1 at FMI wavelengths [34, 35], while the scattering coefficient μs at FMI wavelengths is ~ 83 cm−1, ~ 3-4 orders of magnitude larger than the absorption coefficient. Therefore Eq. (1) can be simplified as:
| (1b) |
The scattering coefficient μs can then be further determined from the fitting and the measured data to Eq. (1b). From our measurement, μs of 2% intralipid at 700 nm is about 88.0 cm−1, which is very close to the expected value 83 cm−1 from the literature [34, 35].
3.3 OCT Correction of FMI Signal
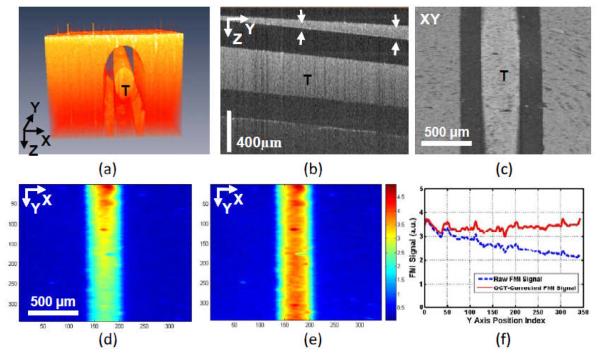
If the fluorophore depth can be determined based on OCT structural information, more accurate dye concentration value can be calculated using the results shown in Figure 3. In other words, FMI quantification can be improved using OCT structural information including the tumor depth and scattering coefficient of the tissue. To test this hypothesis, we placed the fluorescence-dye-filled (2 μM Cy 5.5) capillary tube with a small angle (about 4.8°) in 2% intralipid and then imaged the phantom with our OCT/FMI system.
Figure 4 shows the concurrent OCT and FMI imaging of the phantom. Figure 4(a) shows the 3D OCT volumetric imaging of the dye-filled capillary tube (mimicking a contrast-agent-labeled “tumor”). Figure 4(b) shows a cross-sectional OCT image indicating different thickness of “skin” tissues overlaying at the top of “tumor”. The structural information from OCT can be used to find the “tumor” depth information. Figure 4(c) is the en face OCT image of the tube. Figure 4(d) shows the raw FMI image of the tube (“tumor” phantom). The raw intensity is unequal due to the different attenuations of the overlaying scattering medium. From the OCT imaging, the scattering coefficient (μs) of the medium (μs at OCT wavelength [1300 nm] is calculated from the slope of the exponential decay of OCT axial signals and then scale to μs at FMI wavelength [~ 700 nm] using Eq. (2) explained below [34, 36]) and the depth of object at different locations can be quantified. Those parameters will then be used to correct the non-uniform attenuation from fluorophores at different depths using Eq. (1b), and the corrected image is shown in Figure 4(e). The FMI profiles in the tube region along the Y axis in (d) and (e) are compared in Figure 4(f).The quantification accuracy is clearly improved.
Figure 4.
(a) 3D volumetric OCT image of a capillary tube (T) phantom filled with constant concentration Cy5.5 and submerged under 2% Intralipid. (b) Cross-sectional OCT image showing different thickness (indicated by the distance between two arrows) of scattering medium on the top of the tube. (c) En face OCT image of the tube. (d) En face color-coded FMI image of the tube showing unequal fluorescence intensities along the Y axis due to the difference in scattering medium layer thickness on top of the tube (see b). (e) From the OCT image, the scattering coefficient of the medium (μs) and the layer thickness can be quantified. Those values will then be used to correct the FMI intensity. (f) The FMI profiles in the tube region along the Y axis in (d) and (e) showing the improvement of FMI intensity with OCT correction.
There are many studies on the relationship between scattering coefficient and wavelength for Intralipid and other biological tissues [34, 36-40]. Two studies on optical scattering properties of soft tissue based on different models were published in 1998 and 2000 [37-39]. Those studies showed a general form of the relation in the range of 600 – 1400 nm could be expressed approximately as [37-39]:
| (2) |
where b is related with scatters averaged size and size distribution. Schmitt et al. [38] validated Eq. (2) on published optical properties of rat liver tissue in 633nm – 1300nm [40]. Experimental results from Ref. [34] and [36] showed the scattering coefficient of intralipid follows Eq. (2) in the whole measured spectra ranges, 500-900 nm and 400-1100 nm, respectively. In this paper, we used Eq. (2) to estimate the scattering coefficient of intralipid at FMI wavelengths from measurement at 1300 nm. The b value, 2.37, used in our calculation is averaged from the reported values for intralipid from Ref. [34] (b = 2.33) and [36] (b = 2.4).
Another assumption in this analysis is that the absorption coefficient μa is ignorable for both OCT and FMI wavelengths and all attenuation is due to scattering. In last session, we have shown that the assumption is valid at FMI wavelengths (~ 700 nm). At OCT wavelengths around 1300 nm, the averaged absorption coefficient of water is about 1.6 cm−1 [41]. It is about one order of magnitude less than the scattering coefficient at 1300nm (~ 18.3 cm−1). Therefore, for our phantom the assumption might be still valid. But in other cases when absorption coefficients and scattering coefficients are comparable, absorption coefficient should be subtracted from the total attenuation coefficient before scaling using Eq. (2) to get a more accurate estimation.
This attenuation correction method would be very helpful if the contrast agent is localized beneath the surface. The FMI contrast agent used in this study is topically applied, and accumulated at the surface, i.e. all FMI signals have the same attenuation, so the attenuation correction method is not necessary in the application reported in this paper. Instead, we investigated the spatial co-registration of the structural image from OCT and the molecular image from FMI on an animal model.
3.4 OCT Imaging of Mouse Bowels
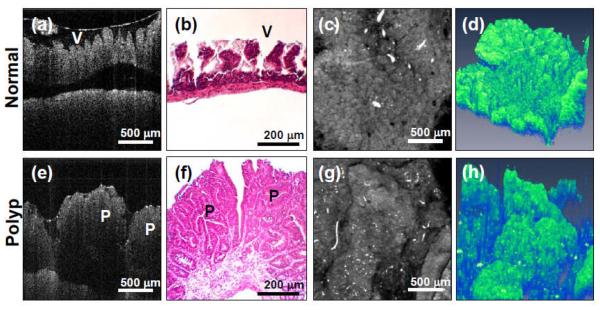
Figure 5 shows the representative OCT images of both the normal and polypoid regions of mouse bowel. Figure 5(a) shows the cross-sectional OCT image of the normal bowel, with the characteristic villous and crypt structures. The OCT image agrees well with the cross-sectional histology shown in Figure 5(b). Figure 5(c) shows the en face projection OCT image, which is analogous to the standard endoscope images. Individual villi/crypt can be visualized as well as the gross pattern of their distribution. Figure 5(d) shows the 3D reconstruction of the normal bowel.
Figure 5.
OCT images of mouse bowel from two regions of interests (ROI), normal and polypoid regions. Normal region: (a) Cross-sectional OCT image (V denotes villious region). (b) Histology. (c) OCT en face projection image. (d) 3-D OCT image (X × Y × Z = 2.0 × 2.0 × 2.15 mm). Polyps (P): (e) Cross-sectional OCT images. (f) Histology. (g) OCT en face projection image. (h) 3-D OCT image (X × Y × Z = 2.0 × 2.0 × 2.15 mm).
In contrast, the polyp region shows the irregular mass in the OCT cross-sectional image in Figure 5(e). Histology shown in Figure 5(f) confirms the OCT imaging results. Projection OCT and 3D OCT in Figure 5(g) and 5(h) respectively show the whole polyp structures. These results demonstrate OCT's ability to obtain micron- resolution, cross-sectional and 3D images of mouse bowel microstructures, and can be used to identify abnormalities such as the development of polyps.
Several criteria based on morphological information from OCT might be used to evaluate the development of the adenoma development in the mouse colon [16], such as mean layer thickness, layer boundary visibility and polyp structure visibility. Several research groups have recently derived quantitative values directly from OCT A-scans and used those values to access early demineralization in teeth [42], characterize atherosclerosis plaques [43], and differentiate normal and abnormal breast tissues [44]. These quantitative methods could be potentially applicable for gastrointestinal cancer application as well.
3.5 OCT/FMI Imaging of Mouse Bowels
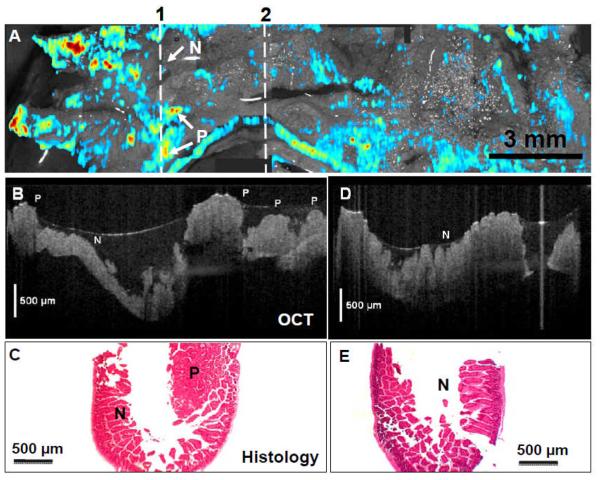
Figure 6(A) shows the result of a large field-of-view mosaic OCT/FMI image from 6 individual image volumes continuously acquired. A total of 18 mm long bowels (incubated with UEA-1 conjugate liposomes) were imaged with the combined OCT/FMI with fluorescence signals threshold at 50% and overlaid on top of OCT structural images. Several “hot spots” indicate suspicious polyps in this region. The cross-sectional OCT images cutting through one of the FMI “hot spot” regions (indicated by the line “1”) showing the presence of polyps (P) (Figure 6B) and confirmed by the corresponding histology (Figure 6C). In contrast, Figure 6(D) shows the cross-sectional OCT image of the normal region (indicated by the line “2” in Figure 6A). The scale bars in Figure 6(B) and 6(D) are physical distance and a refractive index of 1.4 for tissue [45] was used for calculating the physical distance. OCT image indicates characteristic crypt/villi structures of normal colon (N) and agrees with the corresponding histology (Figure 6E). OCT tissue classification confirms the fluorescence molecular imaging results.
Figure 6.
(A) Co-registered en face projection OCT image (in gray scale) and fluorescence molecular imaging (in red-blue color scale) of APCmin mouse colon incubated with glycoprotein targeting UAE-1 conjugated liposome ex vivo. Polyps (P) areas show enhanced fluorescence signals than normal (N) regions. (B) Cross-sectional OCT image along line “1” reveals characteristic structures of polyps (P) and agrees with the corresponding histology (C). The left-right direction corresponds to top-down direction along line “1” in (A). (D) Cross-sectional OCT image along line “2” indicates characteristic crypt structures of normal colon (N) and agrees with the corresponding histology (E).
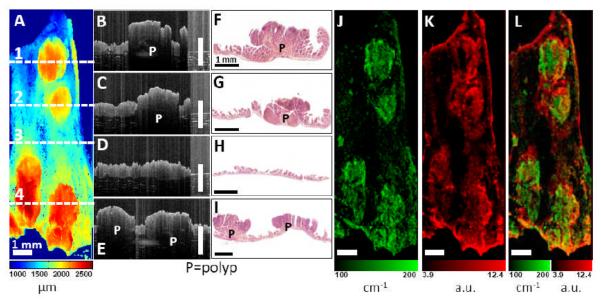
Figure 7 shows another example of the OCT/FMI imaging of mouse bowel polyp ex vivo with UEA-1 conjugated contrast agent. Figure 7(A) shows an OCT en face surface profile image. Tissue surface height (with respect to a fixed reference position) is quantified from the cross-sectional OCT image using intensity-based segmentation and then color-coded in the en face image. Four polyps are clearly visible showing their elevated tissue surface heights. Figure 7(B-E) show representative cross-sectional OCT images corresponding to the horizontal lines 1-4 in Figure 7(A). Polyps (P) are visible as protruded masses in OCT images (Figure 7B, C, E). In contrast, normal intestinal tissue (Figure 7D) shows thin and smooth mucosa. Corresponding histology images in Figure 7(F-I) confirm the OCT findings. Figure 7(J) shows the scattering coefficient (μs) image derived by fitting the OCT axial-scan intensity profiles with Eq. (1b). From Figure 7(J), polypoid regions show enhanced light attenuation compared to normal regions. The enhanced scattering coefficient could be related to the structural changes such as nuclear-to-cytoplasmic ratio and extracellular matrix remodeling during the neoplastic progression. Our findings is consistent with previous clinical observations of reduced OCT scattered light (higher attenuation) in adenomatous polyps of human colon [26]. In comparison, Figure 7(K) shows the corresponding co-registered FMI image with UEA-1 conjugated liposomes. Fluorescence intensities are higher around the polypoid areas than adjacent normal mucosa. This indicates the preferential accumulation of UEA-1 conjugated contrast agents. Figure 7(L) shows the fused scattering coefficient and fluorescence images showing good spatial correlation between the morphological and molecular parameters.
Figure 7.
Co-registered OCT/FMI imaging of intestinal polyps incubated with UEA-1 conjugated liposomes ex vivo. (A) OCT en face surface profile image. Tissue surface height is color-coded (ranges from 1 – 2.5 mm). Four polyps are clearly visible as elevated tissue surface height. (B-I) Cross-sectional OCT images corresponding to the horizontal lines 1-4 in (A). Polyps (P) are visible as protruded masses in B, D, H. Normal mucosa is shown in F. The scale bars in (B-H) are physical distance and a refractive index of 1.4 for tissue [45] was used for calculating the physical distance. Corresponding histology (C, E, G, I) confirm the OCT images. (J) Tissue scattering coefficient (μs) image (ranges from 100 – 200 cm−1). Polyps show higher extinction coefficients. (K) Fluorescence image using the UEA-1 conjugated contrast agents. Fluorescence intensities are higher around polyp areas than the surrounding mucosa. (L) Fused scattering coefficient and fluorescence image. Bar = 1 mm.
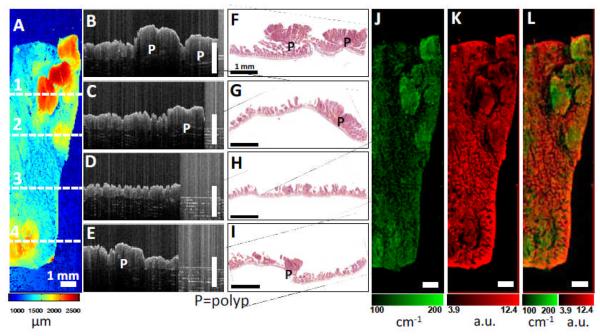
Figure 8 shows the results of the OCT/FMI imaging of mouse bowel polyp ex vivo with non-conjugated contrast agents. Figure 8(A) shows an OCT en face surface profile image with polyps showing elevated tissue surface heights. Figure 8(B-E) show representative cross-sectional OCT images corresponding to the horizontal lines 1-4 in Figure 8(A). Figure 8(F-I) show the corresponding histology images confirming the OCT images. Figure 8(J) shows the scattering coefficient (μs) image with polypoid regions showing enhanced light scattering. The OCT images agree with the results shown in Figure 7(A-J). Figure 8(K) shows the corresponding co-registered FMI image with non-conjugated liposomes. In contrast to Figure 7(K), fluorescence intensities with non-conjugated contrast agents are lower in the polypoid regions than the adjacent normal mucosa. Figure 8(L) shows the fused scattering coefficient and fluorescence images.
Figure 8.
Co-registered OCT/FMI imaging of intestinal polyps incubated with non-conjugated liposomes ex vivo. (A) OCT en face surface profile image. Tissue surface height is color-coded (ranges from 1 – 2.5 mm). (B-I) Cross-sectional OCT images corresponding to the horizontal lines 1-4 in (A). Polyps (P) are visible as protruded masses in B, D, H. Corresponding histology (C, E, G, I) confirm the OCT images. (J) Tissue scattering coefficient (μs) image (ranges from 100 – 200 cm−1). Polyps show higher extinction coefficients. (K) Fluorescence image using the non-conjugated contrast agents. Fluorescence intensities are lower in the polyp areas compared to normal mucosa regions. (L) Fused scattering coefficient and fluorescence image. Bar = 1 mm.
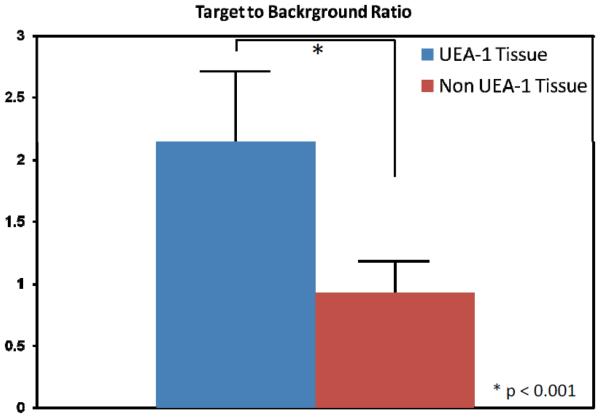
Figure 9 summarizes the statistical results of UAE-1 conjugated contrast agents versus the non-conjugated contrast agents. Overall, UAE-1 conjugated contrast agents show 2.14 ± 0.57 in poly-to-background ratio (n=21), while non-conjugated contrast agents show 0.93 ± 0.26 in polyp-to-background ratio (n=20). This difference is statistically significant (p<0.01). This result confirms that the fluorescence signal enhancement is coming from the molecular-specific glycoprotein binding.
Figure 9.
(A) Polyp-to-background ratios (defined by the ratio of fluorescence intensity in the polypoid region divided by that in the nearby background region) for UEA-1 conjugate and non-conjugate contrast agents.
Although the exact binding mechanism of contrast agents is still under investigation, our OCT tissue classification correlates well with the fluorescence molecular imaging results. These results not only further confirm that UEA-1 targeting to adenomas might provide a new tool for the diagnosis of intestinal cancer, but also demonstrate that the combined OCT/FMI imaging system can provide complementary morphology and molecular information. The morphology information provided by OCT could be used to detect the neoplastic changes or other structural changes which are associated with certain stage in cancer development, while the molecular or metabolism information provided by FMI using molecular-specific imaging contrast agent could be used to either confirm the structural changes or provide information to further differentiate the cancer development stage. The OCT/FMI system can be very useful in the early detection of neoplastic changes before metastsasis or the determination of cancer development stage.
4. Conclusion
In conclusion, we have demonstrated a co-registered OCT and FMI imaging system. This system enables simultaneous imaging of tissue morphology and molecular information at high resolution over 2-3 mm field-of-view, and will have potential applications in small animal imaging and clinical imaging. Imaging results from our system on mouse intestinal tissues show that glycoprotein targeting contrast agents hold promise for imaging polyps. Future work will include larger scale studies to assess the sensitivity and specificity for OCT/FMI in detecting intestinal cancer, and the development of endoscopic imaging catheter devices to enable simultaneous OCT and FMI imaging of internal body cavities in vivo. This imaging technique is translatable to clinics in the forms of endoscopy, laparoscopy, and needle imaging probes, and could potentially enhance the clinician's capability to diagnose diseases early.
Acknowledgement
This work is supported by the Nano-Biotechnology Award of the State of Maryland, the Minta Martin Foundation, and the General Research Board (GRB) Award of the University of Maryland, the UMB-UMCP SEED Grant Program, and the Prevent Cancer Foundation. The authors acknowledge Professor Chi Lee of the Department of Electrical and Computer Engineering at the University of Maryland for equipment support, Qian Li and Michael Lai for technical assistance. R.S. acknowledges the support from the intramural research program of the Clinical Center, NIH.
References
- 1.Huang D, Swanson EA, Lin CP, Schuman JS, Stinson WG, Chang W, Hee MR, Flotte T, Gregory K, Puliafito CA, Fujimoto JG. Optical coherence tomography. Science. 1991;254:1178–1181. doi: 10.1126/science.1957169. [DOI] [PMC free article] [PubMed] [Google Scholar]
- 2.Fujimoto JG. Optical coherence tomography for ultrahigh resolution in vivo imaging. Nature Biotechnology. 2003;21:1361–1367. doi: 10.1038/nbt892. [DOI] [PubMed] [Google Scholar]
- 3.Drexler W. Ultrahigh-resolution optical coherence tomography. Journal of Biomedical Optics. 2004;9:47–74. doi: 10.1117/1.1629679. [DOI] [PubMed] [Google Scholar]
- 4.Tearney GJ, Brezinski ME, Bouma BE, Boppart SA, Pitvis C, Southern JF, Fujimoto JG. In vivo endoscopic optical biopsy with optical coherence tomography. Science. 1997;276:2037–2039. doi: 10.1126/science.276.5321.2037. [DOI] [PubMed] [Google Scholar]
- 5.Sergeev AM, Gelikonov VM, Gelikonov GV, Feldchtein FI, Kuranov RV, Gladkova ND, Shakhova NM, Suopova LB, Shakhov AV, Kuznetzova IA, Denisenko AN, Pochinko VV, Chumakov YP, Streltzova OS. In vivo endoscopic OCT imaging of precancer and cancer states of human mucosa. Optics Express. 1997;1:432–440. doi: 10.1364/oe.1.000432. [DOI] [PubMed] [Google Scholar]
- 6.Li X, Chudoba C, Ko T, Pitris C, Fujimoto JG. Imaging needle for optical coherence tomography. Optics Letters. 2000;25:1520–2. doi: 10.1364/ol.25.001520. [DOI] [PubMed] [Google Scholar]
- 7.Panjehpour M, Overholt BF, VoDinh T, Haggitt RC, Edwards DH, Buckley FP. Endoscopic fluorescence detection of high-grade dysplasia in Barrett's esophagus. Gastroenterology. 1996;111:93–101. doi: 10.1053/gast.1996.v111.pm8698231. [DOI] [PubMed] [Google Scholar]
- 8.Wang TD, Crawford JM, Feld MS, Wang Y, Itzkan I, Van Dam J. In vivo identification of colonic dysplasia using fluorescence endoscopic imaging. Gastrointestinal Endoscopy. 1999;49:447–455. doi: 10.1016/s0016-5107(99)70041-6. [DOI] [PubMed] [Google Scholar]
- 9.DaCosta RS, Wilson BC, Marcon NE. Optical techniques for the endoscopic detection of dysplastic colonic lesions. Curr Opin Gastroenterol. 2005;21:70–9. [PubMed] [Google Scholar]
- 10.Kuranov RV, Sapozhnikova VV, Shakhova HM, Gelikonov VM, Zagainova EV, Petrova SA. Combined application of optical methods to increase the information content of optical coherent tomography in diagnostics of neoplastic processes. Quantum Electronics. 2002;32:993–998. [Google Scholar]
- 11.Sapozhnikova VV, Shakhova NM, Kamensky VA, Petrova SA, Snopova LB, Kuranov RV. Capabilities of fluorescence spectroscopy using 5-ALA and optical coherence tomography for diagnosis of neoplastic processes in the uterine cervix and vulva. Laser Physics. 2005;15:1664–1673. [Google Scholar]
- 12.Pan YT, Xie TQ, Du CW, Bastacky S, Meyers S, Zeidel ML. Enhancing early bladder cancer detection with fluorescence-guided endoscopic optical coherence tomography. Optics Letters. 2003;28:2485–2487. doi: 10.1364/ol.28.002485. [DOI] [PubMed] [Google Scholar]
- 13.Wang ZG, Durand DB, Schoenberg M, Pan YT. Fluorescence guided optical coherence tomography for the diagnosis of early bladder cancer in a rat model. Journal of Urology. 2005;174:2376–2381. doi: 10.1097/01.ju.0000180413.98752.a1. [DOI] [PubMed] [Google Scholar]
- 14.Tumlinson AR, Hariri LP, Utzinger U, Barton JK. Miniature endoscope for simultaneous optical coherence tomography and laser-induced fluorescence measurement. Appl Opt. 2004;43:113–21. doi: 10.1364/ao.43.000113. [DOI] [PubMed] [Google Scholar]
- 15.McNally JB, Kirkpatrick ND, Hariri LP, Tumlinson AR, Besselsen DG, Gerner EW, Utzinger U, Barton JK. Task-based imaging of colon cancer in the Apc(Min/+) mouse model. Applied Optics. 2006;45:3049–3062. doi: 10.1364/ao.45.003049. [DOI] [PubMed] [Google Scholar]
- 16.Hariri LP, Tumlinson AR, Besselsen DG, Utzinger U, Gerner EW, Barton JK. Endoscopic optical coherence tomography and laser-induced fluorescence spectroscopy in a murine colon cancer model. Lasers in Surgery and Medicine. 2006;38:305–313. doi: 10.1002/lsm.20305. [DOI] [PubMed] [Google Scholar]
- 17.Hariri LP, Tomlinson AR, Wade NH, Besselsen DG, Utzinger U, Gerner EW, Barton JK. Ex vivo optical coherence tomography and laser-induced fluorescence spectroscopy imaging of murine gastrointestinal tract. Comparative Medicine. 2007;57:175–185. [PubMed] [Google Scholar]
- 18.Rosen RB, Hathaway M, Rogers J, Pedro J, Garcia P, Dobre GM, Podoleanu AG. Simultaneous OCT/SLO/ICG imaging. Invest Ophthalmol Vis Sci. 2009;50:851–60. doi: 10.1167/iovs.08-1855. [DOI] [PubMed] [Google Scholar]
- 19.Podoleanu AG, Dobre GM, Cernat R, Rogers JA, Pedro J, Rosen RB, Garcia P. Investigations of the eye fundus using a simultaneous optical coherence tomography/indocyanine green fluorescence imaging system. J Biomed Opt. 2007;12:014019. doi: 10.1117/1.2434970. [DOI] [PubMed] [Google Scholar]
- 20.Dobre GM, Podoleanu AG, Rosen RB. Simultaneous optical coherence tomography--Indocyanine Green dye fluorescence imaging system for investigations of the eye's fundus. Opt Lett. 2005;30:58–60. doi: 10.1364/ol.30.000058. [DOI] [PubMed] [Google Scholar]
- 21.Tung CH, Mahmood U, Bredow S, Weissleder R. In vivo imaging of proteolytic enzyme activity using a novel molecular reporter. Cancer Res. 2000;60:4953–8. [PubMed] [Google Scholar]
- 22.Achilefu S. Lighting up tumors with receptor-specific optical molecular probes. Technology in Cancer Research & Treatment. 2004;3:393–409. doi: 10.1177/153303460400300410. [DOI] [PubMed] [Google Scholar]
- 23.Marten K, Bremer C, Khazaie K, Sameni M, Sloane B, Tung CH, Weissleder R. Detection of dysplastic intestinal adenomas using enzyme-sensing molecular beacons in mice. Gastroenterology. 2002;122:406–414. doi: 10.1053/gast.2002.30990. [DOI] [PubMed] [Google Scholar]
- 24.Andrews PM, Chen Y, Onozato ML, Huang SW, Adler DC, Huber RA, Jiang J, Barry SE, Cable AE, Fujimoto JG. High-resolution optical coherence tomography imaging of the living kidney. Lab Invest. 2008;88:441–9. doi: 10.1038/labinvest.2008.4. [DOI] [PubMed] [Google Scholar]
- 25.Jemal A, Siegel R, Ward E, Hao Y, Xu J, Murray T, Thun MJ. Cancer statistics, 2008. CA Cancer J Clin. 2008;58:71–96. doi: 10.3322/CA.2007.0010. [DOI] [PubMed] [Google Scholar]
- 26.Pfau PR, Sivak MV, Chak A, Kinnard M, Wong RCK, Isenberg GA, Izatt JA, Rollins A, Westphal V. Criteria for the diagnosis of dysplasia by endoscopic optical coherence tomography. Gastrointestinal Endoscopy. 2003;58:196–202. doi: 10.1067/mge.2003.344. [DOI] [PubMed] [Google Scholar]
- 27.Adler DC, Zhou C, Tsai TH, Schmitt J, Huang Q, Mashimo H, Fujimoto JG. Three-dimensional endomicroscopy of the human colon using optical coherence tomography. Opt Express. 2009;17:784–96. doi: 10.1364/oe.17.000784. [DOI] [PMC free article] [PubMed] [Google Scholar]
- 28.Qi X, Pan Y, Hu Z, Kang W, Willis JE, Olowe K, Sivak MV, Jr., Rollins AM. Automated quantification of colonic crypt morphology using integrated microscopy and optical coherence tomography. J Biomed Opt. 2008;13:054055. doi: 10.1117/1.2993323. [DOI] [PubMed] [Google Scholar]
- 29.Roney CA, Xie J, Xu B, Jabour P, Griffiths G, Summers RM. Glycoprotein expression by adenomatous polyps of the colon. Proc. of SPIE. 2008;6916:69161O. [Google Scholar]
- 30.Chipon B, Clave G, Bouteiller C, Massonneau M, Renard PY, Romieu A. Synthesis and post-synthetic derivatization of a cyanine-based amino acid. Application to the preparation of a novel water-soluble NIR dye. Tetrahedron Letters. 2006;47:8279–8284. [Google Scholar]
- 31.Troy TL, Thennadil SN. Optical properties of human skin in the near infrared wavelength range of 1000 to 2200 nm. J Biomed Opt. 2001;6:167–76. doi: 10.1117/1.1344191. [DOI] [PubMed] [Google Scholar]
- 32.Baeten J, Niedre M, Dunham J, Ntziachristos V. Development of fluorescent materials for Diffuse Fluorescence Tomography standards and phantoms. Opt Express. 2007;15:8681–94. doi: 10.1364/oe.15.008681. [DOI] [PubMed] [Google Scholar]
- 33.Turchin IV, Sergeeva EA, Dolin LS, Kamensky VA, Shakhova NM, Richards-Kortum R. Novel algorithm of processing optical coherence tomography images for differentiation of biological tissue pathologies. Journal of Biomedical Optics. 2005;10:064024. doi: 10.1117/1.2137670. [DOI] [PubMed] [Google Scholar]
- 34.Flock ST, Jacques SL, Wilson BC, Star WM, Vangemert MJC. Optical-Properties of Intralipid - a Phantom Medium for Light-Propagation Studies. Lasers in Surgery and Medicine. 1992;12:510–519. doi: 10.1002/lsm.1900120510. [DOI] [PubMed] [Google Scholar]
- 35.Pope RM, Fry ES. Absorption spectrum (380-700 nm) of pure water. II. Integrating cavity measurements. Appl Opt. 1997;36:8710–23. doi: 10.1364/ao.36.008710. [DOI] [PubMed] [Google Scholar]
- 36.Vanstaveren HJ, Moes CJM, Vanmarle J, Prahl SA, Vangemert MJC. Light-Scattering in Intralipid-10-Percent in the Wavelength Range of 400-1100 Nm. Applied Optics. 1991;30:4507–4514. doi: 10.1364/AO.30.004507. [DOI] [PubMed] [Google Scholar]
- 37.Tuchin VV. Tissue Optics: Light Scattering Methods and Instruments for Medical Diagnosis. SPIE; Bellingham, Washington, USA: 2007. [Google Scholar]
- 38.Schmitt JM, Kumar G. Optical scattering properties of soft tissue: a discrete particle model. Appl Opt. 1998;37:2788–97. doi: 10.1364/ao.37.002788. [DOI] [PubMed] [Google Scholar]
- 39.Wang RKK. Modelling optical properties of soft tissue by fractal distribution of scatterers. Journal of Modern Optics. 2000;47:103–120. [Google Scholar]
- 40.Parsa P, Jacques SL, Nishioka NS. Optical-Properties of Rat-Liver between 350 and 2200 Nm. Applied Optics. 1989;28:2325–2330. doi: 10.1364/AO.28.002325. [DOI] [PubMed] [Google Scholar]
- 41.Kou LH, Labrie D, Chylek P. Refractive-Indexes of Water and Ice in the 0.65-Mu-M to 2.5-Mu-M Spectral Range. Applied Optics. 1993;32:3531–3540. doi: 10.1364/AO.32.003531. [DOI] [PubMed] [Google Scholar]
- 42.Popescu DP, Sowa MG, Hewko MD, Choo-Smith LP. Assessment of early demineralization in teeth using the signal attenuation in optical coherence tomography images. J Biomed Opt. 2008;13:054053. doi: 10.1117/1.2992129. [DOI] [PMC free article] [PubMed] [Google Scholar]
- 43.Xu C, Schmitt JM, Carlier SG, Virmani R. Characterization of atherosclerosis plaques by measuring both backscattering and attenuation coefficients in optical coherence tomography. J Biomed Opt. 2008;13:034003. doi: 10.1117/1.2927464. [DOI] [PubMed] [Google Scholar]
- 44.Goldberg BD, Iftimia NV, Bressner JE, Pitman MB, Halpern E, Bouma BE, Tearney GJ. Automated algorithm for differentiation of human breast tissue using low coherence interferometry for fine needle aspiration biopsy guidance. J Biomed Opt. 2008;13:014014. doi: 10.1117/1.2837433. [DOI] [PubMed] [Google Scholar]
- 45.Bolin FP, Preuss LE, Taylor RC, Ference RJ. Refractive-Index of Some Mammalian-Tissues Using a Fiber Optic Cladding Method. Applied Optics. 1989;28:2297–2303. doi: 10.1364/AO.28.002297. [DOI] [PubMed] [Google Scholar]


