Abstract
BACKGROUND:
Antibiotic consumption in human populations is one of the factors responsible for the emergence of resistant organisms. It is important to track population-based data on an ongoing basis, and to explore the determinants of regional variation in antibiotic consumption.
METHODS:
Population-level data were obtained on all outpatient oral antibiotic prescriptions dispensed within British Columbia (BC) between 1996 and 2007. Prescriptions were expressed as the defined daily dose per 1000 inhabitants. Geographical information systems mapping was used to display the spatial variations of antibiotic consumption in BC. The relationships among antibiotic consumption, socioeconomic factors and climatic conditions were explored using Pearson’s correlation and regression modelling.
RESULTS:
Overall antibiotic consumption was highest in the northern regions of BC. Higher rates of consumption were associated with a greater proportion of the Aboriginal population, lower levels of education and individuals younger than 15 years of age. An inverse correlation was found between some classes of antibiotics and the following factors: individuals older than 65 years of age, mortality rate, doctor-to-population ratio, household size and higher July temperatures. The adjusted regression analyses indicated that higher antibiotic consumption was associated with a higher proportion of Aboriginals and household income.
CONCLUSION:
Different rates of antibiotic consumption exist within BC. The use of antibiotics is correlated with several socioeconomic factors and climatic conditions. It may be useful to consider these factors when designing policies to address antibiotic consumption in the community.
Keywords: Antibiotic consumption, Correlation, Geographical information systems, Mapping, Socioeconomic
Abstract
HISTORIQUE :
La consommation d’antibiotiques par les populations humaines fait partie des facteurs responsables de l’émergence d’organismes résistants. Il est important de suivre les données en population sur une base continue et d’explorer les déterminants de la variation régionale de consommation d’antibiotiques.
MÉTHODOLOGIE :
Les chercheurs ont obtenu les données en population au sujet de toutes les prescriptions d’antibiotiques par voie orale dispensées aux patients ambulatoires de la Colombie-Britannique (C.-B.) entre 1996 et 2007. Les prescriptions étaient exprimées par la dose quotidienne définie pour 1 000 habitants. Les chercheurs ont utilisé la cartographie des systèmes d’information géographique pour déterminer les variations spatiales de consommation d’antibiotiques en C.-B. Ils ont exploré les relations entre la consommation d’antibiotiques, les facteurs socio-économiques et les conditions climatiques au moyen de la corrélation de Pearson et de la modélisation de régression.
RÉSULTATS :
Dans l’ensemble, la consommation d’antibiotiques était plus élevée dans les régions du Nord de la C.-B. Une consommation plus élevée s’associait à de plus fortes proportions de populations autochtones, à un niveau d’éducation moins élevé et à des personnes de moins de 15 ans. On constatait une corrélation inverse entre certaines catégories d’antibiotiques et les facteurs suivants : personnes de plus de 65 ans, taux de mortalité, ratio entre les médecins et la population, dimension de la famille et températures plus élevées en juillet. Les analyses de régression rajustées indiquaient que de plus fortes consommations d’antibiotiques s’associaient à de plus fortes proportions d’autochtones et au revenu familial.
CONCLUSION:
On constate divers taux de consommation d’antibiotiques en C.-B. L’utilisation d’antibiotiques est corrélée avec plusieurs facteurs socio-économiques et conditions climatiques. Il pourrait être utile de tenir compte de ces facteurs lors de la conception de politiques pour traiter de la consommation d’antibiotiques au sein de la collectivité.
Increased bacterial resistance to antimicrobial agents is a major public health threat (1). Studies (2–4) have clearly shown that the use of antibiotics is a major factor contributing to resistance. Unfortunately, in the past decade, clinicians working in the field of infectious diseases have not seen many novel antibiotics marketed within Canada or elsewhere (5,6). There are many reasons for this; however, the lack of production of novel agents can be partly explained by the disinterest of the pharmaceutical industry for this particular market. It is difficult for companies to justify and recoup the expense of long-term clinical trials of antimicrobial agents when the production of drugs for chronic illnesses yields far greater financial gain (7). As a result, numerous initiatives are being undertaken by the infectious diseases community to use antibiotics more appropriately.
One of these activities includes the active surveillance of antibiotic use. This involves monitoring and analyzing the amount and types of antibiotics being prescribed. For example, the European Surveillance of Antimicrobial Consumption project has been collecting data on antibiotic use across European countries since 1997 (8,9). Their data show that consumption varies across Europe (9). A similar analysis (10) conducted in Spain showed that the consumption of antibiotics also varied widely within a country. Although there are very few reports regarding regional antibiotic consumption in the literature, investigators have more recently started evaluating the impact of socioeconomic determinants of antibiotic use given that differences in the use of antibiotics across geographical areas may be explained by demographic, cultural and economic factors (11–13).
Within British Columbia (BC), an active surveillance program monitors antibiotic use at the population level. We have previously reported on overall and class-specific antibiotic consumption (14). For the present paper, we evaluated regional variations in antibiotic consumption within the province of BC and investigated socioeconomic determinants of consumption using an ecological approach.
METHODS
Antibiotic consumption
Population-level data on all outpatient antibiotic use within BC were obtained from the PharmaNet database. This centralized database contains information for all ambulatory care prescriptions dispensed, except for medications used for the treatment of sexually transmitted infections and HIV infection. The database contains individual level prescription data, but was anonymized for the project by a third party. Prescription data were obtained from 1996 to 2007 and converted to defined daily doses per 1000 inhabitants per day based on the Anatomical Therapeutic Chemical classification system (ATC/DDD Index 2008) developed by the World Health Organization.
BC is divided into five major regional health authorities, which are further divided into health service delivery areas (HSDAs). Geographical information systems mapping (ArcGIS 9.2, ESRI Inc, USA) was used to display the spatial and temporal pattern of outpatient antibiotic use by the 16 HSDAs for overall antibiotic use (J01) and each major antibiotic class: penicillins (J01C), cephalosporins (J01D), tetracyclines (J01A), trimethoprim/sulphonamides (J01E), macrolides (J01FA) and quinolones (J01M). Equal interval data classification was used to symbolize the rate of antibiotic use by HSDAs for each year from 1996 to 2007.
Correlation between antibiotic use and socioeconomic factors
An ecological approach was used to explore the relationship between antibiotic consumption and socioeconomic/climatic factors. Socioeconomic data were derived from the 2006 Canada Census, mortality data from the 2006 data of the BC Vital Statistics Agency, 2007 physician data from the College of Physicians and Surgeons of BC, 2006 Campylobacter infection data from the BC Centre for Disease Control, and the 2006 climatic data from Environment Canada.
Determinants included in the model were the following: population younger than 15 years of age; population older than 65 years of age; number of persons per household; visible minority population; proportion of Aboriginals in the population; household income; incidence of low income; education; mortality rate; physician-to-population ratio; Campylobacter infection rate; and January, July and annual average temperature and precipitation. These determinants have been predictive of antibiotic use in previous studies (11–13). Relationships among 2006 antibiotic consumption, socioeconomic factors and climatic conditions were initially explored using Pearson’s correlation because all of the data variables had a normal distribution (two-tailed test at 0.05 significance level). A Pearson’s correlation coefficient (r) of 1 indicated a perfect direct relationship, an r value of −1 indicated a perfect inverse relationship and an r value of 0 indicated no relationship between two variables. Statistical analysis was performed using SPSS version 14.0 (SPSS Inc, USA) for Windows (Microsoft Corporation, USA).
Factors that showed a significant relationship in Pearson’s correlation tests and the season pattern variables (sine[2πt/12] and cosine[2πt/12] cyclical terms were used; t denotes the month of the year to account for seasonal variations in antibiotic use) were considered in a stepwise linear regression model to examine their effects on antibiotic consumption (daily consumption rates in 2006 per month per HSDA [n=192]). Because some factors were highly correlated with each other, standardized scores of these factors were used in the regression model to minimize the effect of multicollinearity (standardized scores refers to a transformation of the original values by subtracting the mean and then dividing by the standard error). In addition, a series of criteria were also used to best select the variables in the final regression model. These selection criteria included the behaviour of standardized and unstandardized coefficients when regression terms were added in the model: correlations (zero order and partial) and collinearity statistics (tolerance and variance inflation factors). Residuals analyses were also performed to ensure that the final selected models were adequate.
RESULTS
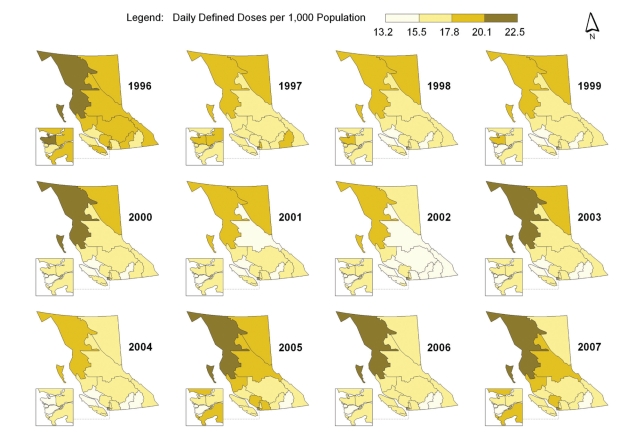
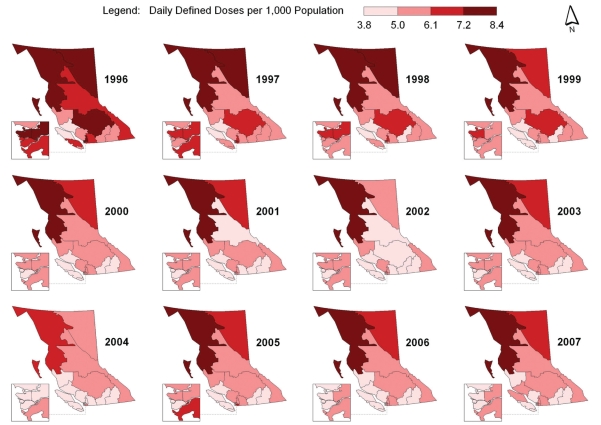
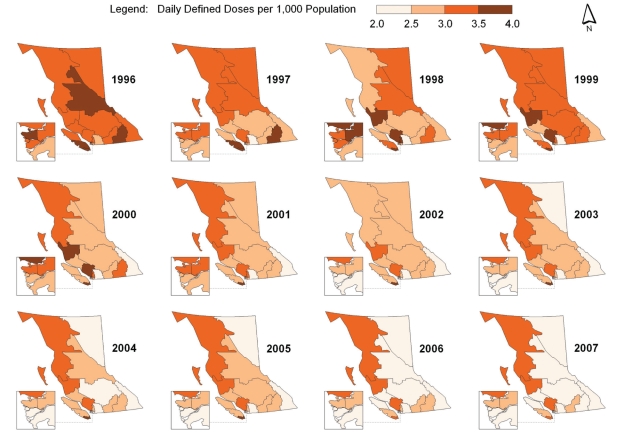
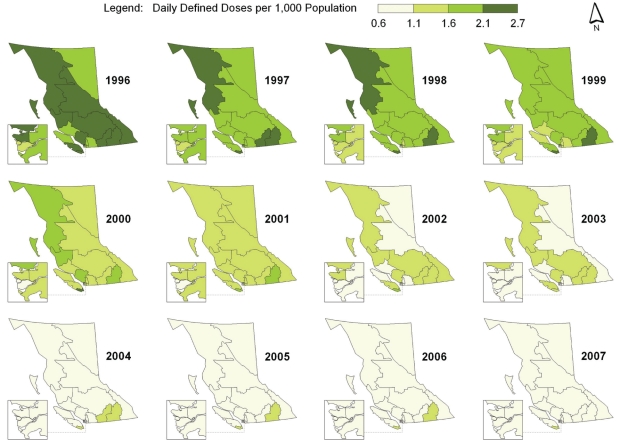
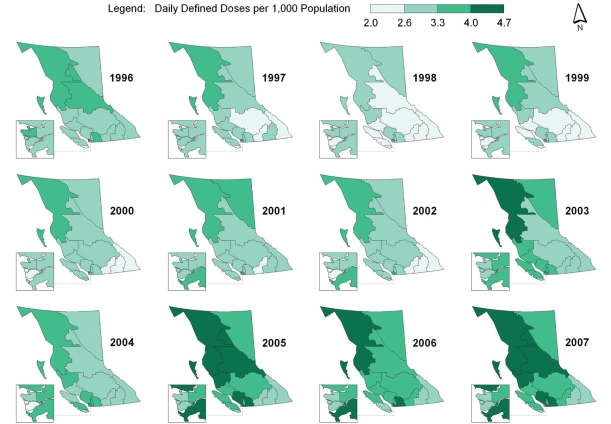
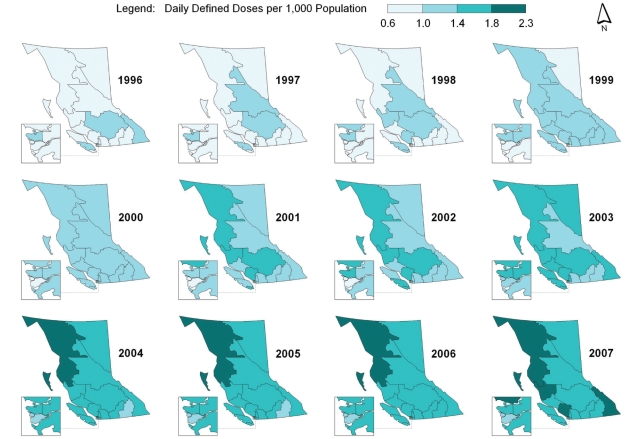
Spatial-temporal mapping identified different rates of antibiotic consumption within BC. In general, overall antibiotic consumption rates were higher in the northern regions of the province but declined over time (Figure 1 and Table 1). Furthermore, the consumption of penicillins (Figure 2), tetracyclines (Figure 3) and trimethoprim/sulfonamides (Figure 4) declined significantly over time across all HSDAs, whereas consumption of macrolides (Figure 5) and quinolones (Figure 6) increased dramatically over time and broadly across the province. No clear pattern was observed in the consumption of cephalosporins (figure not shown).
Figure 1).
Overall antibiotic consumption rates
TABLE 1.
Consumption of antibiotics over time by health service delivery area (HSDA) in British Columbia
| HSDA |
All antibiotics |
Penicillins |
Cephalosporins |
Tetracyclines |
Trimethoprim/sulfonamides |
Macrolides |
Quinolones |
||||||||||||||
|---|---|---|---|---|---|---|---|---|---|---|---|---|---|---|---|---|---|---|---|---|---|
| 1996 | 2007 | %Δ | 1996 | 2007 | %Δ | 1996 | 2007 | %Δ | 1996 | 2007 | %Δ | 1996 | 2007 | %Δ | 1996 | 2007 | %Δ | 1996 | 2007 | %Δ | |
| East Kootenay | 18.9 | 16.5 | –12.8 | 6.6 | 5.4 | –18.4 | 2.3 | 1.8 | –20.2 | 3.2 | 2.4 | –23.2 | 2.2 | 0.9 | –60.2 | 3.0 | 3.2 | 7.1 | 1.1 | 1.9 | 73.5 |
| Kootenay Boundary | 17.7 | 14.3 | –18.9 | 5.8 | 4.0 | –30.8 | 1.6 | 1.4 | –12.9 | 3.6 | 2.5 | –31.3 | 2.5 | 1.1 | –56.0 | 2.7 | 3.0 | 9.8 | 0.9 | 1.5 | 72.1 |
| Okanagan | 17.9 | 15.8 | –11.8 | 5.9 | 4.5 | –23.2 | 1.7 | 1.6 | –6.4 | 3.3 | 2.7 | –18.0 | 2.6 | 1.1 | –58.7 | 2.8 | 3.4 | 21.3 | 0.9 | 1.6 | 76.4 |
| Thompson Cariboo Shuswap | 19.3 | 17.0 | –1.7 | 7.6 | 5.2 | –32.1 | 1.8 | 1.8 | 4.7 | 3.2 | 2.5 | –23.2 | 2.3 | 1.0 | –55.8 | 2.7 | 3.9 | 45.5 | 1.2 | 1.7 | 43.9 |
| Fraser East | 17.3 | 17.6 | 1.9 | 6.3 | 5.2 | –17.4 | 1.6 | 2.3 | 41.8 | 2.6 | 2.2 | –17.0 | 2.1 | 0.9 | –57.6 | 3.4 | 4.5 | 33.2 | 0.8 | 1.7 | 113.1 |
| Fraser North | 19.2 | 16.8 | –12.4 | 7.5 | 5.2 | –30.0 | 1.8 | 2.0 | 13.0 | 3.4 | 2.6 | –24.7 | 1.9 | 0.8 | –59.8 | 3.2 | 3.9 | 23.8 | 0.9 | 1.6 | 79.0 |
| Fraser South | 18.1 | 18.2 | 0.6 | 7.1 | 5.9 | –15.9 | 1.9 | 2.3 | 23.4 | 2.8 | 2.3 | –16.6 | 1.8 | 0.8 | –57.3 | 3.3 | 4.5 | 34.5 | 0.9 | 1.7 | 93.0 |
| Richmond | 17.5 | 14.1 | –19.2 | 6.8 | 4.7 | –30.4 | 1.6 | 1.6 | 0.7 | 3.1 | 2.3 | –25.1 | 1.5 | 0.6 | –60.2 | 3.2 | 3.0 | –5.5 | 0.8 | 1.2 | 50.3 |
| Vancouver | 20.6 | 16.3 | –20.8 | 7.8 | 5.0 | –35.9 | 1.9 | 1.9 | –2.2 | 3.6 | 2.7 | –23.2 | 2.2 | 1.1 | –51.9 | 3.5 | 3.3 | –5.0 | 1.1 | 1.6 | 48.8 |
| North Shore/Coast Garibaldi | 18.1 | 18.1 | –0.2 | 6.1 | 4.8 | –21.3 | 1.4 | 2.0 | 35.4 | 3.5 | 3.2 | –8.1 | 2.2 | 1.1 | –48.6 | 3.3 | 4.2 | 26.8 | 1.0 | 1.9 | 88.3 |
| South Vancouver Island | 17.5 | 16.6 | –5.3 | 5.5 | 4.6 | –15.6 | 1.4 | 1.4 | 5.6 | 3.7 | 3.5 | –4.9 | 2.7 | 1.3 | –52.1 | 2.6 | 3.1 | 19.1 | 1.0 | 1.7 | 74.4 |
| Central Vancouver Island | 18.7 | 16.4 | –12.2 | 6.2 | 5.0 | –19.7 | 1.9 | 1.7 | –8.8 | 3.6 | 2.6 | –28.0 | 2.2 | 1.0 | –52.0 | 3.1 | 3.6 | 14.9 | 1.1 | 1.6 | 39.9 |
| North Vancouver Island | 15.8 | 17.0 | 7.1 | 5.0 | 5.1 | 1.3 | 1.6 | 2.0 | 27.9 | 3.1 | 2.5 | –17.7 | 1.9 | 0.9 | –51.5 | 2.8 | 3.6 | 31.4 | 0.9 | 1.6 | 84.0 |
| Northwest | 20.7 | 22.5 | 8.8 | 8.4 | 8.1 | –4.3 | 1.3 | 1.9 | 44.7 | 3.3 | 3.3 | 1.1 | 2.4 | 1.1 | –53.9 | 3.6 | 4.7 | 29.8 | 0.9 | 2.3 | 140.8 |
| Northern Interior | 19.6 | 18.0 | –8.4 | 6.9 | 6.1 | –11.3 | 1.7 | 1.8 | 9.3 | 3.7 | 2.5 | –32.0 | 2.2 | 1.0 | –55.1 | 3.6 | 4.1 | 14.1 | 1.0 | 1.7 | 62.9 |
| Northeast | 18.5 | 16.8 | –9.3 | 7.6 | 6.5 | –14.7 | 1.4 | 1.7 | 22.9 | 3.4 | 2.1 | –39.1 | 2.0 | 0.7 | –66.5 | 2.9 | 3.5 | 20.9 | 0.6 | 1.6 | 143.8 |
%Δ Percentage change from 1996 to 2007
Figure 2).
Consumption of penicillins
Figure 3).
Consumption of tetracyclines
Figure 4).
Consumption of trimethoprim/sulfonamides
Figure 5).
Consumption of macrolides
Figure 6).
Consumption of quinolones
The present correlation analysis identified many relationships among antibiotic consumption, socioeconomic factors and climatic conditions in BC (Table 2). Overall antibiotic consumption was directly correlated with a higher proportion of Aboriginals in a population (r=0.788, P<0.001), whereas no relationship was seen with other visible minority populations. Specifically, the use of penicillins (r=0.826, P<0.001) and quinolones (r=0.682, P=0.004) was strongly and significantly associated with a higher proportion of Aboriginals in a population. Overall antibiotic and penicillin consumption were also directly correlated with lower levels of education (r=0.548, P=0.028 and r=0.727, P=0.001, respectively). The use of penicillins and macrolides was also directly correlated with populations younger than 15 years of age (penicillins: r=0.794, P<0.001; macrolides: r=0.769, P=0.001) and the physician-to-population ratio (penicillins: r=0.603, P=0.013; macrolides: r=0.642, P=0.007). A direct correlation was also found among trimethoprim/sulfonamide use, populations older than 65 years of age (r=0.598, P=0.014) and mortality rate (r=0.722, P=0.002); cephalosporin use and the number of persons per household (r=0.575, P=0.020); and macrolide use and household income (r=0.556, P=0.025).
TABLE 2.
Pearson’s correlation (r) of 2006 antibiotic consumption, socioeconomic factors and climatic conditions in British Columbia
|
All antibiotics |
Penicillins |
Cephalosporins |
Tetracyclines |
Trimethoprim/sulfonamides |
Macrolides |
Quinolones |
||||||||
|---|---|---|---|---|---|---|---|---|---|---|---|---|---|---|
| Variable | r | P | r | P | r | P | r | P | r | P | r | P | r | P |
| Aboriginal population | 0.788 | <0.001 | 0.826 | <0.001 | 0.003 | 0.992 | 0.251 | 0.348 | 0.115 | 0.672 | 0.476 | 0.062 | 0.682 | 0.004 |
| Visible minority population | −0.313 | 0.239 | −0.201 | 0.455 | 0.176 | 0.514 | −0.156 | 0.564 | −0.475 | 0.063 | −0.169 | 0.532 | −0.431 | 0.096 |
| No high school diploma | 0.548 | 0.028 | 0.727 | 0.001 | 0.159 | 0.555 | −0.291 | 0.274 | −0.173 | 0.521 | 0.491 | 0.053 | 0.403 | 0.122 |
| Low income | −0.344 | 0.192 | −0.223 | 0.406 | 0.094 | 0.730 | −0.116 | 0.670 | −0.398 | 0.126 | −0.283 | 0.288 | −0.405 | 0.120 |
| Household income | 0.345 | 0.190 | 0.443 | 0.086 | 0.297 | 0.264 | −0.215 | 0.424 | −0.522 | 0.038 | 0.556 | 0.025 | 0.043 | 0.875 |
| Household size | 0.282 | 0.290 | 0.449 | 0.081 | 0.575 | 0.020 | −0.463 | 0.071 | −0.816 | <0.001 | 0.561 | 0.024 | −0.018 | 0.947 |
| Population <15 years | 0.657 | 0.006 | 0.794 | <0.001 | 0.448 | 0.082 | −0.345 | 0.190 | −0.481 | 0.060 | 0.769 | 0.001 | 0.369 | 0.159 |
| Population ≥65 years | −0.478 | 0.061 | −0.728 | 0.001 | −0.293 | 0.272 | 0.266 | 0.318 | 0.598 | 0.014 | −0.497 | 0.050 | −0.140 | 0.605 |
| Mortality rate | −0.308 | 0.246 | −0.591 | 0.016 | −0.295 | 0.268 | 0.302 | 0.256 | 0.722 | 0.002 | −0.345 | 0.190 | 0.011 | 0.968 |
| Campylobacteriosis rate | −0.249 | 0.352 | −0.398 | 0.127 | 0.077 | 0.777 | 0.334 | 0.206 | 0.056 | 0.837 | −0.348 | 0.186 | −0.153 | 0.571 |
| Doctor-to-population ratio | 0.408 | 0.117 | 0.603 | 0.013 | 0.461 | 0.072 | −0.555 | 0.026 | −0.617 | 0.011 | 0.642 | 0.007 | 0.140 | 0.606 |
| January average temperature | −0.054 | 0.844 | −0.324 | 0.221 | 0.265 | 0.321 | 0.370 | 0.158 | 0.134 | 0.621 | −0.117 | 0.667 | 0.085 | 0.755 |
| July average temperature | −0.515 | 0.041 | −0.556 | 0.025 | −0.071 | 0.795 | −0.296 | 0.265 | 0.065 | 0.810 | −0.267 | 0.317 | −0.274 | 0.304 |
| January total precipitation | 0.116 | 0.670 | −0.151 | 0.577 | 0.487 | 0.056 | 0.201 | 0.456 | −0.077 | 0.776 | 0.195 | 0.469 | 0.073 | 0.787 |
| July total precipitation | 0.384 | 0.142 | 0.607 | 0.013 | −0.175 | 0.516 | −0.029 | 0.915 | −0.087 | 0.749 | 0.160 | 0.555 | 0.262 | 0.328 |
| Annual total precipitation | 0.356 | 0.176 | 0.090 | 0.742 | 0.341 | 0.197 | 0.440 | 0.088 | 0.080 | 0.769 | 0.246 | 0.358 | 0.305 | 0.250 |
The consumption of some classes of antibiotics was inversely correlated with populations older than 65 years of age (penicillins: r=−0.728, P=0.001; macrolides: r=−0.497, P=0.050), mortality rate (penicillins: r=−0.591, P=0.016), doctor-to-population ratio (tetracyclines: r=−0.555, P=0.026; trimethoprim/sulfonamides: r=−0.617, P=0.011) and household size (trimethoprim/sulfonamides: r=–0.816, P<0.001).
The relationships between antibiotic consumption and climatic conditions was also identified. The overall use of out-patient antibiotics (r=−0.515, P=0.041) and penicillins (r=−0.556, P=0.025) was inversely correlated with July (summer) average temperature, whereas penicillin consumption was directly correlated with July total precipitation (r=0.607, P=0.013).
Table 3 shows a summary of regression models on selected antibiotics. The results demonstrated a direct association among the proportion of Aboriginals in the community, household income, climatic conditions and overall antibiotic consumption (r2=0.759). An evaluation of individual drugs showed that for penicillin consumption, there was a direct association with the proportion of Aboriginals in the population and climatic conditions, but an inverse association with the proportion of elderly individuals (65 years of age or older) in the population (r2=0.814). Mortality rate and Aboriginal population were directly associated with trimethoprim/sulfonamide use (r2=0.653). Macrolide consumption was found to be directly associated with the younger population (younger than 15 years of age) and climatic conditions (r2=0.758).
TABLE 3.
Summary of regression models for selected drug classes
| Dependent variable* | Independent variables in final regression model | Unstandardized coefficients (standard error) | Standardized coefficients | P | r2 |
|---|---|---|---|---|---|
| J01 (overall) | Constant | 16.675 (0.093) | <0.001 | 0.759 | |
| Aboriginal population† | 1.232 (0.093) | 0.474 | <0.001 | ||
| Household income† | 0.500 (0.093) | 0.192 | <0.001 | ||
| Sine component | 2.093 (0.132) | 0.570 | <0.001 | ||
| Cosine component | 1.494 (0.132) | 0.407 | <0.001 | ||
| J01C (penicillins) | Constant | 5.289 (0.037) | <0.001 | 0.814 | |
| Aboriginal population† | 0.548 (0.041) | 0.461 | <0.001 | ||
| Population ≥65 years† | −0.407 (0.041) | −0.343 | <0.001 | ||
| Sine component | 0.873 (0.053) | 0.521 | <0.001 | ||
| Cosine component | 0.487 (0.053) | 0.290 | <0.001 | ||
| J01E (trimethoprim/sulfonamides) | Constant | 0.938 (0.008) | <0.001 | 0.653 | |
| Aboriginal population† | 0.041 (0.008) | 0.232 | <0.001 | ||
| Household size† | −0.093 (0.010) | −0.523 | <0.001 | ||
| Mortality rate† | 0.064 (0.010) | 0.363 | <0.001 | ||
| J01FA (macrolides) | Constant | 3.588 (0.035) | <0.001 | 0.758 | |
| Population <15 years† | 0.390 (0.035) | 0.397 | <0.001 | ||
| Sine component | 0.882 (0.050) | 0.637 | <0.001 | ||
| Cosine component | 0.608 (0.050) | 0.440 | <0.001 |
Dependent variable: daily consumption rate in defined daily doses per 1000 population/day;
Standardized scores were used
DISCUSSION
In the present study, we documented that overall antibiotic consumption decreased over time, particularly the use of penicillins, tetracyclines and trimethoprim/sulfonamides, and that this decline in use occurred throughout all health authorities in the province. In contrast, the use of macrolides and quinolones increased significantly from 1996 to 2007. Once again, this increase was observed throughout the province; we also observed a north-south gradient in consumption patterns.
We used both Pearson’s correlation and a stepwise regression model to determine which variables were associated with provincial differences in antibiotic use. The proportion of the population younger than 15 years of age, Aboriginal population, physician-to-population ratio, and the cooler, wetter climate in the northern regions of the province were directly correlated with antibiotic consumption, whereas populations older than 65 years of age were inversely correlated. The latter finding is in contrast to previous suggestions that the elderly are large consumers of health care resources including medications. Our data suggests that this is not true for overall antibiotic consumption within the province of BC.
Our study is the first to have demonstrated an association between antibiotic consumption and Aboriginal populations in a region. We did not find a similar association with other ethnic minorities. This observation was seen with both the Pearson’s correlation as well as the stepwise regression analysis and, therefore, is unlikely to have been driven by the mean younger age, educational issues or climatic conditions rather than ethnicity. We also identified a higher rate of consumption in the northern regions of the province. This finding may be related to a higher incidence of infections in the Aboriginal population, a cooler, wetter climate (ie, more time is spent indoors and thereby increasing the risk and incidence of seasonal infections), lack of access to health care services due to the remote nature of communities in the northern sector or simply a lack of understanding about appropriate antibiotic use by the physicians who serve the population of northern BC.
Patient preferences may also play a significant role – studies have shown that patients who expect to get medication are three times more likely to receive it (15–17). Thus, cultural characteristics may also shape attitudes toward antibiotics, and result in higher consumption within regional populations of the province. Finally, the direct correlation of antibiotic consumption and physician-to-population ratio seen in our study has been shown in other studies (13). This phenomenon is not seen in parts of Europe where physicians are salaried and, therefore, is believed to be related to financial incentives for physicians under the fee-for-service scheme because the doctors’ revenue is dependent on the number of patient visits or, in parts of Europe, the number of prescriptions written and the geographical concentration of health care providers and specialists in major urban centres such as Greater Vancouver and Greater Victoria. Our study also identified that a lower level of education was associated with a higher consumption of antibiotics and a consumption of lower cost antibiotics such as penicillin.
Ecological studies such as the present one must be interpreted with caution. The antibiotic use and socioeconomic and climate relationships identified in the present study indicate association and not causation. Geographical mapping and correlation analysis are useful tools for hypothesis generation. Ideally, results of the present study should be confirmed with individual-level information because it is likely that some strong correlations are confounded by other variables. Another limitation of our study was that it was not able to determine whether resistance by various organisms also correlated with consumption of antibiotics because not all microorganisms in the community sector are cultured, nor are they reportable. Moreover, most of the specimens are sent to private laboratories within primary care and, as such, the data are not easily accessible within the public sector. However, European studies (4) have found a direct correlation between consumption of antibiotics and resistance. Thus, we can assume for those sectors and populations in which consumption of antibiotics is high, resistance will also be high.
CONCLUSION
Our study showed that overall antibiotic consumption rates were higher in the northern regions of BC, with an increased use of macrolides and fluoroquinolones over time. A number of socioeconomic determinants were correlated with higher consumption of antibiotics – some of which are modifiable by implementation of new policies and education to change prescribing practices and, hopefully, reduce use and bacterial resistance.
Acknowledgments
Data for the present study were provided by the College of Pharmacists of British Columbia. The authors thank them for providing the data.
Footnotes
FUNDING/CONFLICTS OF INTEREST: The present study was not funded. The authors have no conflicts of interest to declare.
REFERENCES
- 1.Wise R, Hart T, Cars O, et al. Antimicrobial resistance. BMJ. 1998;317:609–10. doi: 10.1136/bmj.317.7159.609. [DOI] [PMC free article] [PubMed] [Google Scholar]
- 2.Bergman H, Huikko S, Pihlajamaki M, et al. Effect of macrolide consumption on erythromycin resistance in Streptococcus pyogenes in Finland in 1997–2001. Clin Infect Dis. 2004;38:1251–6. doi: 10.1086/383309. [DOI] [PubMed] [Google Scholar]
- 3.Austin DJ, Kristinsson KG, Anderson RM. The relationship between the volume of antimicrobial consumption in human communities and the frequency of resistance. Proc Natl Acad Sci USA. 1999;96:1152–6. doi: 10.1073/pnas.96.3.1152. [DOI] [PMC free article] [PubMed] [Google Scholar]
- 4.Bronzwaer SL, Cars O, Buchholz U, et al. A European study on the relationship between antimicrobial use and antimicrobial resistance. Emerg Infect Dis. 2002;8:278–82. doi: 10.3201/eid0803.010192. [DOI] [PMC free article] [PubMed] [Google Scholar]
- 5.Overbye KM, Barrett JF. Antibiotics: Where did we go wrong? Drug Discov Today. 2005;10:45–52. doi: 10.1016/S1359-6446(04)03285-4. [DOI] [PubMed] [Google Scholar]
- 6.Davies J. Where have all the antibiotics gone? Can J Infect Dis Med Microbiol. 2006;17:287–90. doi: 10.1155/2006/707296. [DOI] [PMC free article] [PubMed] [Google Scholar]
- 7.Projan SJ. Why is big pharma getting out of antibacterial drug discovery? Curr Opin Microbiol. 2003;6:427–30. doi: 10.1016/j.mib.2003.08.003. [DOI] [PubMed] [Google Scholar]
- 8.Goossens H, Ferech M, Vander Stichele R, et al. The ESAC Project Group. Outpatient antibiotic use in Europe and the association with resistance: A cross-national database study. Lancet. 2005;365:579–87. doi: 10.1016/S0140-6736(05)17907-0. [DOI] [PubMed] [Google Scholar]
- 9.Ferech M, Coenen S, Malhotra-Kumar S, et al. European Surveillance of Antimicrobial Consumption (ESAC): Outpatient antibiotic use in Europe. J Antimicrob Chemother. 2006;58:401–7. doi: 10.1093/jac/dkl188. [DOI] [PubMed] [Google Scholar]
- 10.Garcia-Rey C, Aguilar L, Baquero F, et al. Importance of local variations in antibiotic consumption and geographical differences of erythromycin and penicillin. J Clin Microbiol. 2002;40:159–64. doi: 10.1128/JCM.40.1.159-164.2002. [DOI] [PMC free article] [PubMed] [Google Scholar]
- 11.García-Rey C, Fenoll A, Aguilar L, Casal J. Effect of social and climatological factors on antimicrobial use and Streptococcus pneumoniae resistance in different provinces in Spain. J Antimicrob Chemother. 2004;54:465–71. doi: 10.1093/jac/dkh375. [DOI] [PubMed] [Google Scholar]
- 12.Di Matteo L. The macro determinants of health expenditure in the United States and Canada: Assessing the impact of income, age distribution and time. Health Policy. 2005;71:23–42. doi: 10.1016/j.healthpol.2004.05.007. [DOI] [PubMed] [Google Scholar]
- 13.Filippini M, Masiero G, Moschetti K. Socioeconomic determinants of regional differences in outpatient antibiotic consumption: Evidence from Switzerland. Health Policy. 2006;78:77–92. doi: 10.1016/j.healthpol.2005.09.009. [DOI] [PubMed] [Google Scholar]
- 14.Patrick DM, Marra F, Hutchinson J, Monnet DL, Ng H, Bowie WR. Per capita antibiotic consumption: How does a North American jurisdiction compare with Europe? Clin Infect Dis. 2004;39:11–7. doi: 10.1086/420825. [DOI] [PubMed] [Google Scholar]
- 15.Avorn J, Solomon DH. Cultural and economic factors that (mis) shape antibiotic use: The nonpharmacologic basis of therapeutics. Ann Intern Med. 2000;133:128–35. doi: 10.7326/0003-4819-133-2-200007180-00012. [DOI] [PubMed] [Google Scholar]
- 16.Cadieux G, Tamblyn R, Dauphinee D, Libman M. Predictors of inappropriate antibiotic prescribing among primary care physicians. CMAJ. 2007;177:877–83. doi: 10.1503/cmaj.070151. [DOI] [PMC free article] [PubMed] [Google Scholar]
- 17.Cockburn J, Pit S. Prescribing behaviour in clinical practice: Patients’ expectations and doctors’ perceptions of patients’ expectations – a questionnaire study. BMJ. 1997;315:520–3. doi: 10.1136/bmj.315.7107.520. [DOI] [PMC free article] [PubMed] [Google Scholar]


