

Abstract
Succinyl-CoA:3-ketoacid-CoA transferase (SCOT) is a mitochondrial enzyme that catalyzes the reversible transfer of coenzyme-A from acetoacetyl-CoA to succinate to form acetoacetate and succinyl-CoA. mRNAs of SCOT and ATP citrate lyase were decreased 55% and 58% and enzyme activities were decreased >70% in pancreatic islets of the GK rat, a model of type 2 diabetes. INS-1 832/13 cells were transfected with shRNAs targeting SCOT mRNA to generate cell lines with reduced SCOT activity. Two cell lines with > 70% knockdown of SCOT activity showed > 70% reduction in glucose- or methyl succinate-plus-β-hydroxybutyrate-stimulated insulin release. Less inhibition of insulin release was observed with two cell lines with less knockdown of SCOT. Previous studies showed knockdown of ATP citrate lyase in INS-1 832/13 cells does not lower insulin release. The results further support work which suggests mitochondrial pathways involving SCOT that supply acetoacetate for export to the cytosol are important for insulin secretion.
Keywords: Type 2 diabetes, succinyl-CoA:3-ketoacid-CoA transferase, acetoacetate, insulin secretion, ATP citrate lyase, gene knockdown
1. INTRODUCTION
The net synthesis within mitochondria of metabolic intermediates using carbon derived from insulin secretagogues and the export of the intermediates to the cytosol, such as for the synthesis of short chain acyl-CoAs and for metabolite shuttles, appears to be essential for the stimulation and support of insulin secretion by the pancreatic beta cell [1]. Glucose is the most potent physiologic stimulant of insulin secretion and it is metabolized via glycolysis to form pyruvate which is taken up by mitochondria where it is decarboxylated by pyruvate dehydrogenase and carboxylated by pyruvate carboxylase at roughly equal rates [2–6]. There is a great deal of evidence that at least one mitochondrial biosynthetic pathway that utilizes pyruvate carboxylase is especially important for insulin secretion. In this pathway the levels of citric acid cycle intermediates, such as malate and citrate are increased and are exported to the cytosol. Through the action of cytosolic enzymes malic enzyme and ATP citrate lyase these metabolites participate in the pyruvate malate and the pyruvate citrate shuttles and also in forming acetyl-CoA in the cytosol [1, 6–8]. The acetyl-CoA can be a precursor for the synthesis of other short chain acyl-CoAs in the cytosol, such as malonyl-CoA [1, 9, 10], acetoacetyl-CoA and HMG-CoA1 [1, 11–14] (Figure 1). The key involvement of pyruvate carboxylase in insulin secretion has been established with siRNA- and shRNA-mediated knock down of the enzyme and glucose-stimulated insulin release in pancreatic islets or insulinoma cells [15–17]. Similar knockdown of cytosolic malic enzyme in insulinoma cell lines or islets inhibited insulin release in some studies [18–21], but not in others [21, 22]. Most likely there is redundancy of pathways that can perform functions similar to or parallel to pathways that use cytosolic malic enzyme.
Figure 1. Schematic depiction of roles of SCOT and ATP citrate lyase in glucose- or methyl succinate plus β-hydroxybutyrate-stimulated insulin secretion.

Glucose-derived carbon can be converted by SCOT into acetoacetate that is exported from the mitochondria to the cytosol and, ultimately, converted into short chain acyl-CoAs in the cytosol (thick arrows). Succinate formed in the SCOT reaction is regenerated by either the GTP or the ATP succinyl-CoA transferase. In the presence of the experimental insulin secretagogue combination of β-hydroxybutyrate and monomethyl succinate, HB-derived carbon can be converted into acetoacetate to supply the same pathways or into acetoacetyl-CoA by SCOT and ultimately into acetyl-CoA for consumption in the citric acid cycle (dashed arrows). Succinate and succinyl-CoA derived from the citric acid cycle and/or from exogenous methyl succinate can feed the SCOT reaction. The pathway involving ATP citrate lyase is also shown. Abbreviations: AACS, acetoacetyl-CoA synthetase; ACAT1 or ACAT2, acetyl-CoA acetyltransferase 1 or 2; ACAA1 or ACCA2, acetyl-CoA acyltransferase 1 or 2.
We recently suggested there is another pathway for the export of precursors of short chain acyl-CoAs to the cytosol [11–14]. This pathway begins with the formation of acetyl-CoA from pyruvate catalyzed by the pyruvate dehydrogenase complex (Figure 1). The acetyl-CoA is converted to acetoacetyl-CoA catalyzed by either of the mitochondrial thiolases, acetyl-CoA acetyltransferase 1 (ACAT1) or acetyl-CoA acyltransferase 2 (ACAA2). The resulting acetoacetyl-CoA combines with succinate in the mitochondria to form acetoacetate and succinyl-CoA. The acetoacetate can be exported from the mitochondria to the cytosol where it can be converted to the same four short chain acyl-CoAs that result from the export of citrate to the cytosol. The enzyme that catalyzes the formation of acetoacetate in the mitochondria is SCOT1 [11] (Figure 1).
The levels of several metabolic enzymes that play key roles in the mitochondrial biosynthetic pathways and/or redox shuttles have been observed to be decreased in pancreatic islets of rodents [23–26] and/or humans [27, 28] with type 2 diabetes. Among the enzymes that are decreased in type 2 diabetes are mitochondrial glycerol phosphate dehydrogenase (mGPD) [27–28] and pyruvate carboxylase [25–27] in islets of both rats and humans. Each of these enzymes is present at rather high levels in islets of normal rodents [6, 29, 31]. However, the level of pyruvate carboxylase appears to be lower in human islets compared to rodent islets and also low compared to other human tissues, such as liver and kidney2. We recently reported that SCOT and ATP citrate lyase are decreased in the islets of the few humans studied [27]. The level of the cytosolic malic enzyme is normal in islets of diabetic humans [27]. Because samples of islets from only a small number of human patients with type 2 diabetes were analyzed for the levels of SCOT and ATP citrate lyase [27], it would be of heuristic value to know whether the observations from human islets could be replicated in islets from an animal model of type 2 diabetes maintained in more standardized conditions than is possible with pancreatic islets from human patients who become pancreatic islet donors. In the current study we measured the levels of transcripts that encode SCOT and ATP citrate lyase and their enzyme activities in pancreatic islets of the GK rat, a model of human type 2 diabetes.
Two of three studies [11, 20, 32] of three studies [11, 32] in which ATP citrate lyase was knocked down with siRNA or shRNA in pancreatic islets or cell lines failed to show inhibition of glucose-stimulated insulin release. Thus, there may be redundancy of pathways, such that other pathways can achieve the same results as pathways that utilize ATP citrate lyase. Therefore, because the pathway we proposed that requires SCOT could be redundant with ATP citrate lyase in respect to supplying precursors for short chain acyl-CoAs to the cytosol, we analyzed this pathway with a knockdown study of SCOT. We developed cell lines that stably express shRNAs with inserts targeting SCOT mRNA from the rat insulinoma INS-1 832/13 cell line. Four cell lines were developed with various levels of knockdown of SCOT protein and enzyme activity that were used to study insulin release.
2. MATERIALS AND METHODS
2.1 Materials
Rabbit anti-human polyclonal ATP citrate lyase antibody (Catalog number 1699–1) was from Epitomics, Burlingame, CA. Rabbit anti-SCOT polyclonal antibody was generated in rodents by TF. Rabbit anti-βactin antibody and all chemicals were from Sigma-Aldrich, St. Louis, MO, in the highest purity available. The INS-1 832/13 cell line was from Hans Hohmeier and Christopher Newgard.
3. EXPERIMENTAL PROCEDURES
3.1 Islets
Pancreatic islets for measurements of activities and amounts of enzymes were supplied in six batches from GK Wistar rats and six batches from nondiabetic Wistar control rats. All rats were male and were from the Karolinska GK rat colony initiated in 1989 with founders from Professor Goto in Sendai, Japan. Approval for the animal studies was obtained from the Ethics Committee on Animal Experiments at the Karolinska Institutet. Islets were isolated in the laboratory of C-GO and shipped as frozen islet pellets to the laboratory of MJM for enzyme activity analysis within one week of islet isolation. Each batch of islets consisted of 500 to 800 islets isolated from one to three rats. GK rat islet donors were two months old (2 batches), three months old (1 batch) and four months old (3 batches). All Wistar rat control islet donors were three months old. The body weights and blood glucose values of the GK rats were 271 ±10 g (13) (range 236–332 g) and 8.8 ±1.0 mM (13) (range 6.1–19.1 mM), respectively, and the body weights and blood glucose values of the nondiabetic Wistar rat controls were 363 ±8 g (11) (range 305–397 g) and 4.8 ±0.1 mM (11) (range 4.1–5.0 mM), respectively (means ±SE (N)).
In addition, islets were isolated as described above for determination of mRNA expression in the laboratory of C-GO. For this purpose, 11 GK rats and 14 Wistar rats were used. Their body weights and blood glucose levels were similar to those of the rats used for measurements of islet enzyme activities.
3.2 Islet mRNA expression
Total mRNA extraction of isolated pancreatic islets followed by DNase I treatment was done with the RNeasy Mini Kit (Qiagen, Hilden, Germany). First-strand cDNA was synthesized from 1 μg total RNA from each rat employing random hexamer oligonucleotide using QuantiTect reverse transcription reagents (Qiagen).
To perform the real time RT-PCR, specific TaqMan assays were designed (Applied Biosystems, Foster City, USA) according to the mRNA sequence of the SCOT (Oxct1, NM_00173523.1) and the ATP citrate lyase genes in the rat. The probes were labeled with 6′-carboxy-fluorescein (FAM) as reporter dye and TAMRA as quencher dye. Amplification was performed using the 5′-nuclease TaqMan method in an ABI 7300 real-time PCR system (Applied Biosystems, Foster City, USA). Experiments were replicated on at least two occasions.
3.3 Enzyme activities
Enzyme activities were measured in supernatant fractions of whole-cell homogenates or mitochondria of pancreatic islets or cell lines prepared as previously described [11]. Briefly cells maintained as monolayers were washed on the cell culture plates and scraped from the plates and homogenized in KMSH solution (220 mM mannitol, 70 mM sucrose and 5 mM potassium Hepes buffer, pH 7.5) containing 1 mM dithiothreitol with 40 strokes in a Potter-Elvehjem homogenizer. A mitochondrial fraction was prepared by differential centrifugation as previously described [6,11]. The twice frozen-thawed whole-cell homogenate or the frozen-thawed mitochondrial fraction was centrifuged at 20,800 × g for 20 min to give a supernatant fraction. Pancreatic islets were gently homogenized in the KMSH solution with a hand-held homogenizer in microfuge test tubes. SCOT was measured in the presence of 50 mM sodium acetoacetate, 0.2 mM succinyl-CoA, 5 mM MgCl2 in 50 mM Tris chloride buffer, pH 8.0 [25], at 30°C. The rate of acetoacetyl-CoA formation was followed by measuring the increase in absorbance at 310 nm. After a background rate was obtained, the reaction was started with the addition of acetoacetate. The background rate was subtracted from the total rate to give the rate attributable to the enzyme. ATP citrate lyase was measured in a reaction mixture containing 5 mM citrate, 0.3 mM coenzyme A, 3 mM ATP, 10 mM MgCl2, 0.15 mM NADH, 1 mM dithiothreitol, 2 units/ml of malate dehydrogenase in 100 mM Tris-chloride buffer, pH 8.0, at 37°. The formation of oxaloacetate was measured by the oxidation of NADH. After a background rate was measured in the presence of enzyme source, the enzyme reaction was started with the addition of citrate as previously described [11]. Cytosolic malic enzyme (ME1) was measured as previously described [33].
3.4 Western Blots
For immunoblotting, the cells were washed twice with PBS and resuspended in KMSH buffer containing protease inhibitor. The protein concentration was measured with the Bradford assay using bovine serum albumin as a standard. Cells or islets were solubilized in sample buffer (1% SDS, 5% glycerol, 65 mM Tris-chloride, pH 6.8, 0.01% bromphenol blue and either 100 mM dithiothreitol or 2.5% β-mercaptoethanol. Proteins in the lysate were separated by electrophoresis on 7.5% polyacrylamide SDS gels and electrotransfered to nitrocellulose membranes. The membranes were blocked with a mixture of 5% milk in Tris-buffered saline (TBS), incubated overnight at 4°C with a suitable dilution of primary antibody in blocking buffer, washed again and treated with the secondary antibody labeled with goat anti-rabbit horseradish peroxidase in blocking buffer. Proteins were then visualized with the Supersignal West Pico Chemiluminescent Substrate Kit (Pierce). Luminescence was captured on a Chemi Doc XRS Gel Documentation System (BioRad) or on KSR-B Luc Ultra Autorad X-ray film (ISC Bioexpress). To demonstrate comparative loading of proteins across lanes, the membranes were washed in TBS containing 0.05% Tween-20) and incubated in Restore Western Blot Stripping Buffer (Pierce) for 15 minutes at room temperature and re-probed with anti-β-actin antibody. To estimate relative densities of the protein bands on x-ray films exposed to the immunoblots the areas and densities of the bands were measured with the BioRad Chemidoc XRS Imaging System and calculated with Quantity One Software.
3.5 SCOT knock-down by siRNA
In vivo expression of siRNAs was accomplished using hygromycin selectable DNA vectors that express hairpin RNA (shRNA). The pSilencer 2.1 U6 Hygro was used to clone DNA inserts between the BamHI and the HindIII sites downstream of the U6 promoter for stable expression of shRNAs that is processed in vivo to generate siRNA. The target sequences used in this study were designed using web-based siRNA design engines and were as follows: Rat SCOT mRNA (GenBank sequence accession number NM_001127580) targets were: SCOT 68, CAAAGGTCGTTCCGGGTAT; SCOT 713, ACGCAGAGTTTGAGCGACA; SCOT 1676, CCATGGAACACTCCGCAAA and SCOT1184, AGAAGAGAATCGAGCGTTT (See Supplemental Table 1 online for the sequence of the entire HindIII-BamHI insert). DNA was transfected into INS-1 832/13 cells using Lipofectamine 2000 reagent (Invitrogen). Selection of stable cell lines was performed in the presence of 150 μg/ml of hygromycin. Pools of cells stably transfected with each plasmid vector targeting one SCOT mRNA target were used for measurements of SCOT and control enzymes and to study insulin release.
3.6 Insulin release studies
Insulin release from stable cell lines derived from INS-1 832/13 cells and expressing shRNA targeting SCOT mRNA was measured as previously described [11]. INS-1 832/13 cells were maintained in RPMI 1640 medium (contains 11.1 mM glucose) supplemented with 10% fetal calf serum, 1 mM sodium pyruvate, 50 μM β-mercaptoethanol, 10 mM sodium Hepes buffer, pH 7.3 (INS-1 medium [34]) plus 100 units/ml penicillin and 100 μg/ml streptomycin. Insulin release was performed in 24-well tissue culture plates. One day before an insulin release experiment was to be performed the glucose concentration in the tissue culture medium was reduced to 5 mM. Two hours before the experiment the medium was replaced with Krebs Ringer bicarbonate buffer, pH 7.3 (modified to contain 15 mM Hepes and 15 mM NaHCO3 with the NaCl concentration adjusted to maintain osmolarity at 310) containing 3 mM glucose and 0.5% bovine serum albumin (BSA) [11–15, 35]. Cells were washed once with the Krebs Ringer Hepes BSA solution and insulin release was studied in 1 ml of this same solution containing secretagogues or non-secretagogues as controls. After 1 h at 37°, samples of incubation solution were collected and centrifuged to sediment any cells floating in the incubation solution. An aliquot of the supernatant fraction was removed and saved for insulin measurements by radioimmunoassay. The plates were then washed once with Krebs Ringer solution containing no added protein. Water was added to the plates and the mixture containing the cells was removed and saved for estimation of total protein by the Bradford method using a dye reagent from Bio-Rad.
3.7 Insulin content
The insulin content of the cell lines was measured by radioimmunoassay in acid-ethanol extracts of the cells. Briefly, 1 ml of 1.5% HCl in 75% ethanol was added to each well containing cells as a monolayer. After one hour the cell extract was removed and vortexed vigorously and frozen until use when a portion of it was diluted in 50 mM potassium phosphate buffer, pH 7.5 containing 0.5% BSA before insulin was measured.
4.0 RESULTS
4.1 Lower SCOT and ATP citrate lyase in islets of GK rats
Table 1 shows that SCOT Oxct1 and ATP citrate lyase mRNA expressions are 55% and 58% lower and enzyme activities are 70% lower and 76% lower, respectively, in pancreatic islets of the GK rat compared to islets of the Wistar rat controls. The level of the SCOT Oxct2a mRNA was extremely low in the islets of both the Wistar rats and the GK rats. Figures 2 and 3 show that SCOT protein and ATP citrate lyase protein are lower in the islets of the GK rats than in the islets of the Wistar rat controls.
Table 1. Lower SCOT and ATP citrate lyase gene expression and enzyme activities in pancreatic islets of GK rats compared to islets of Wistar rats.
Results of gene expression are in arbitrary units and are the means ±SE of 11 batches of Wistar rat islets and 14 batches of GK rat islets. Results of enzyme activities are in nmol acetoacetyl-CoA/min/mg whole-cell protein and nmol oxaloacetate/min/mg whole cell protein for SCOT and ATP citrate lyase, respectively, and are the means ±SE of six batches of islets from each group.
| Wistar Rats | GK Rats | |
|---|---|---|
| SCOT (Oxct1) mRNA Expression | 16.0 ±2.1 | 7.2 ±0.7b |
| ATP Citrate Lyase mRNA Expression | 8.5 ±0.5 | 3.6 ±0.3b |
| SCOT Activity | 17.2 ±3.5 | 5.2 ±0.6a |
| ATP Citrate Lyase Activity | 85 ±11 | 20 ±7.2 (6)b |
p < 0.01 and
p < 0.001 vs Wistar control
Figure 2. Lower SCOT protein in islets of GK rats compared to islets of Wistar rats.

Immunoblot showing individual densities of the SCOT bands relative to the average of the three Wistar control bands. After the membrane was probed for SCOT it was additionally probed with anti-actin antibody to show loading of protein across the lanes. The intent was to add 10 μg whole-cell protein per lane. However, even though the actin bands suggest heavier loading of total cell protein in the GK islet lanes, the densities of the SCOT bands in the GK lanes are still lower than in the Wistar lanes. The relative densities shown were not corrected for the probable lower amounts of total cell protein in the Wistar lanes.
Figure 3. Lower ATP citrate lyase protein in pancreatic islets of GK rats compared to islets of Wistar rats.
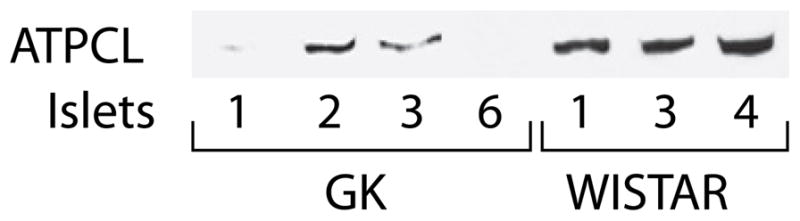
Immunoblot with 15, 13.5, 15, 16, 9.5, 11.5 and 9 μg protein per lane in lanes with islet samples GK-1, 2, 3 and 6 and Wistar-1, 3 and 4, respectively.
4.2 SCOT knockdown inhibits insulin release
Four regions of the SCOT gene were targeted with shRNA in INS-1 832/13 cells resulting in cell lines with varying degrees of knockdown of SCOT protein (Figure 4) and enzyme activity in whole-cell homogenates and mitochondria (Figure 5) compared to the parent INS-1 832/13 cell line and the CHS cell line that contains a non-targeting insert. The two cell lines with lesser knockdown of SCOT (SCOT 713 and SCOT 68) showed variability among individual experiments in the extent of SCOT protein knockdown (Figure 4) or knockdown of SCOT activity in the whole-cell homogenate compared to the SCOT activity in mitochondria (SCOT 713, Figure 5), or in knockdown of glucose-stimulated- vs methyl-succinate-plus-β-hydroxybutyrate-stimulated insulin release (SCOT 68, Figure 5). The SCOT 713 cell line was the cell line with least knockdown of SCOT activity and protein and it showed only about 25% decreases in glucose-stimulated and monomethyl succinate-plus-β-hydroxybutyrate-stimulated insulin release. The SCOT 68 cell line showed about a 50% decrease in the SCOT level and a 50% decrease in glucose-stimulated insulin release, but no decrease in methyl succinate-plus-β-hydroxybutyrate-stimulated insulin release, while the two cell lines, SCOT 1676 and SCOT 1184, with about 75% knockdown of whole-cell SCOT protein and SCOT enzyme activity, as well as SCOT mitochondrial activity, showed 70–80% reductions in insulin release in response to either of the insulin stimulants compared to the control cell lines. The growth rate of SCOT 1184 cell line, but not the growth rates of the other cell lines, was 20% slower than that of the CHS control cell line.
Figure 4. Various levels of knockdown of SCOT protein with stable transfection of shRNA inserts targeting different regions of SCOT mRNA in INS-1 832/13 cell lines.

Three immunoblots with 20 μg whole-cell protein/lane from the same three or four cell lines studied at various passage numbers are shown (713 and 68, passage 6, all panels; 1184, passage 4 in middle panel and passage 7, bottom panel; 1676, passage 4 in top and middle panels; passage 11 in bottom panel; CHS, passages 19 or 20). The CHS cell line is a control transfected with a non-targeting shRNA insert. The densities of the SCOT protein bands are shown relative to within each blot with 100% equal to CHS (top panel), 713 (middle panel) and average CHS (bottom panel).
Figure 5. Decreased glucose- or methylsuccinate-plus-β-hydroxybutyrate-stimulated insulin release is proportional to knockdown of SCOT enzyme activity in cell lines derived from INS-1 832/13 cells.

Cells were incubated in the presence of either 11.1 mM glucose or 10 mM monomethylsuccinate (MMS) plus 5 mM D-β-hydroxybutyrate (HB) for 1 h. Results are the means ±SE of 16–26 replicate incubations for glucose and 12–16 for MMS + HB, except for the cell line SCOT1184 where N = 8 for glucose and N = 4 for MMS + HB. Results of enzyme activities are the mean ±SE of three preparations of each cell line whole-cell homogenate supernatant fractions and triplicate measurements of mitochondrial supernatant fractions. Insulin release of the parent INS-1 832/13 cell line was 19.7 ±1.5 and 10.2 ±0.9 mU insulin/mg whole-cell protein stimulated by glucose and MMS + HB, respectively. Insulin release of the parent INS-1 832/13 cell line and CHS control cell line in the absence of a stimulus was always < 5% of glucose-stimulation and < 10% of MMS + HB stimulation. The specific SCOT enzyme activity of the whole-cell homogenate supernatant fraction and mitochondrial supernatant fraction of the INS-1 832/13 cell line were 5.2 ±0.6 and 17.6 ±1.7 nmol acetoacetyl-CoA formed/min/mg protein, respectively. ap < 0.05 or bp < 0.001 vs the INS-1 832/13 control or the CHS control cell line transfected with a non-targeting shRNA insert.
4.3 Control enzymes and insulin content
The activity of cytosolic malic enzyme and ATP citrate lyase were measured in the cell lines showing the various decreases in SCOT enzyme activity and insulin release to obtain some assurance that the decreases in secretagogue-stimulated insulin release was not due to an off target effect. Control enzyme activities of the SCOT-targeted cell lines were not significantly different from the control cell line (Table 2).
Table 2. Normal specific enzyme activities of non-targeted enzymes malic enzymes and ATP citrate lyase in cell lines with various knockdown SCOT activities and glucose-stimulated insulin release.
Enzyme activities are expressed as nmol product/min/mg whole-cell supernatant fraction protein and are the mean ±SE of (N) replicate measurements.
| Cell line | Malic Enzyme | ATP Citrate Lyase | ||
|---|---|---|---|---|
| Activity | % of Control | Activity | % of Control | |
| 832/13 | 77 ±10 (3) | 100 | 129 ±8 (8) | 100 |
| CHS | 79 ±11 (3) | 103 | 137 ±12 (6) | 106 |
| SCOT 68 | 99 ±9 (3) | 130 | 123 ±6 (4) | 95 |
| SCOT 713 | 73±7 (3) | 95 | 134 ±13 (4) | 104 |
| SCOT 1676 | 72 ±10 (3) | 93 | 104 ±11 (10) | 81 |
| SCOT 1184 | 59 ±7 (3) | 77 | 106 ±3 (6) | 82 |
The insulin content (mean ±SE (N)) of the CHS cell line possessing a non-targeting insert was 394 ±23 (12) milliunits insulin/mg cell protein (8). The insulin contents of the SCOT 68 and 713 cell lines which showed moderately decreased insulin release were not significantly different from that of the control CHS cell line and when expressed as percentages relative to the CHS line set at 100% were as follows: SCOT 68 (108 ±11% (8)), SCOT 713 (103 ±6 % (8). The insulin contents of the SCOT 1184 cell line (61 ±9% (12)) and SCOT 1676 (59 ±6% (12)) with severely decreased secretagogue-stimulated insulin release were lower than that of the CHS cell line. However, since only 2% to 5% of the total insulin content of the cell lines was released during the one-hour period of exposure to glucose or methyl succinate plus β-hydroxybutyrate, it is unlikely that these decreases in insulin content were large enough to be the cause of the lower insulin release. The lower insulin contents may mean that the SCOT reaction in some way influences insulin synthesis.
5.0 DISCUSSION
5.1 Low SCOT and ATP citrate lyase in GK islets
Our recent study of pancreatic islets from a small number of human patients with type 2 diabetes showed that the islet enzyme mRNA expression, activities and protein levels of SCOT and ATP citrate lyase are decreased in type 2 diabetes [27]. The results of the current study with islets of the GK rat support the idea that the levels of these two enzymes are decreased in type 2 diabetes. It appears that the levels of islet enzymes that are involved in pathways important for shuttling reducing equivalents across the inner mitochondrial membrane to the cytosol (mGPD) [23–28], or are involved in synthesis of citric acid cycle intermediates (mitochondrial anaplerosis), such as pyruvate carboxylase [25–27], or enzymes, such as SCOT (ref 27 and Table 1 and Figure 2 herein), that are involved in biosynthesis of other mitochondrial metabolites, are decreased in type 2 diabetes. ATP citrate lyase, which is also decreased in the islets in type 2 diabetes (ref 27 and Table 1 and Figure 3 herein), can participate in redox shuttles by converting citrate into oxaloacetate in the cytosol [9, 10]. Besides forming oxaloacetate, ATP citrate lyase also forms acetyl-CoA from citrate in the cytosol and the acetyl-CoA can be converted to three other short chain acyl-CoAs. SCOT forms acetoacetate in the mitochondria that can be exported to the cytosol and converted into the same four short chain acyl-CoAs (Figure 1). A number of other metabolic enzymes including succinate dehydrogenase, fumarase, quinone reductase, cytochrome C oxidase, malate dehydrogenase, aspartate aminotransferase and cytosolic malic enzyme are normal in islets of GK rats or Zucker diabetic fatty rats [24–27] and/or humans [25–27] with type 2 diabetes. The levels of the biotin-containing carboxylases, propionyl-CoA carboxylase and methylcrotonyl-CoA carboxylase that catalyze reactions very similar to pyruvate carboxylase are not lowered in diabetic rats and humans [25–27], indicating the decrease in pyruvate carboxylase is specific. While the decreased levels of the above enzymes may contribute to the abnormal insulin secretion in type 2 diabetes, the decreases are not likely the primary cause of the abnormal islet function because using insulin treatment to restore normoglycemia in GK rats with decreased mGPD and pyruvate carboxylase normalizes the levels of these enzymes [25]. In the current study, insulin treatment of the GK rat did not increase mRNA transcripts that encode SCOT (unpublished observation).
5.2 Knockdown of SCOT and insulin release
As Figure 5 shows, knockdown of SCOT with shRNA lowers glucose-stimulated insulin release in the INS-1 832/13 insulinoma cell line. Two previous studies showed that severe lowering of the level of ATP citrate lyase with siRNA or shRNA did not inhibit glucose-stimulated insulin release in the INS-1 832/13 cell line [11, 32] or rat pancreatic islets [32], whereas one study in which ATP citrate lyase was lowered 30–67% in the INS-1 832/13 cell line did inhibit glucose-stimulated insulin release. The pathway involving SCOT is redundant with the pathway involving ATP citrate lyase for supplying carbon precursors of short chain acyl-CoAs to the cytosol (Figure 1) and this may be why knockdown of ATP citrate lyase does not usually inhibit insulin release. The reason why knockdown of SCOT alone inhibits insulin release, while knockdown of ATP citrate lyase does not, is unclear at this time but may underscore the importance of SCOT for supplying acetoacetate for export to the cytosol for formation of short chain acyl-CoAs.
The thick arrows in Figure 1 show the pathway that involves SCOT in glucose-stimulated insulin secretion. In this pathway SCOT catalyzes the conversion of acetoacetyl-CoA derived from glucose carbon to acetoacetate. Succinate is converted to succinyl-CoA in the reaction and the succinyl-CoA can be reconverted to succinate catalyzed by either the GTP or the ATP succinyl-CoA transferase resulting in a regenerative cycle for succinate. The acetoacetate can be exported from the mitochondria where it can be a precursor for formation of short chain acyl-CoAs (Figure 1). The fact that the SCOT 68 cell line which showed moderate knockdown of SCOT with strong lowering of glucose stimulated insulin release, but with no lowering of methyl succinate-plus-β-hydroxybutyrate insulin release, which supplies acetoacetate to the cells, may highlight the importance of acetoacetate formation in glucose-stimulated insulin secretion.
The inhibition of insulin release stimulated by β-hydroxybutyrate in combination with methyl succinate in the INS-1 832/13-derived cell lines (Figure 5) provides more direct evidence for the SCOT pathway’s existence in the beta cell. Insulin release stimulated by the combination of these experimental compounds would not likely occur in vivo, but can occur with flux through the reverse direction of the pathway that uses the SCOT reaction in glucose-stimulated insulin release. The “reverse” pathway (Figure 1, dashed arrows) begins with β-hydroxybutyrate dehydrogenase converting β-hydroxybutyrate to acetoacetate. SCOT can catalyze the conversion of the exogenously-derived acetoacetate to combine with succinyl-CoA from the citric acid cycle to generate acetoacetyl-CoA and succinate. The additional succinate derived from the exogenously-added methyl succinate, via a mass action effect, can also increase succinyl-CoA to feed the SCOT reaction (Figure 1) and in addition the succinate can replenish other four-carbon intermediates of the citric acid cycle. Either of the mitochondrial thiolases, ACAT1 or ACAA2, can split the resulting acetoacetyl-CoA into two acetyl-CoA molecules which can condense with oxaloacetate to form citrate for metabolism in the citric acid cycle to generate energy for the stimulation of insulin release. In addition, the acetoacetate can be exported to the cytosol to directly form short chain acyl-CoAs as described above.
5.3 Conclusions
The results of the current study of the GK rat, a rodent model of type 2 diabetes, show that the activities and protein of SCOT and ATP citrate lyase are decreased in the pancreatic islets of this rat and agree with results of studies of human pancreatic islets [27]. These decreases appear to be caused by low gene expression because the levels of mRNA transcripts that encode the two enzymes are decreased compared to the transcript levels in islets from control Wistar rats (Table 1). Chronic knockdown of SCOT in the INS-1 832/13 cell line severely lowered glucose- and methyl succinate-plus-β-hydroxybutyrate-stimulated insulin release (Figure 5). Previous studies showed that knockdown of ATP citrate lyase in the INS-1 832/13 cell line [11, 32] and rat pancreatic islets [32] is not associated with lowered insulin secretion. In further support of the pathways that use SCOT, we previously showed that in INS-1 832/13 cells knockdown of another enzyme of this pathway, acetoacetyl-CoA synthetase, which converts acetoacetate to acetoacetyl-CoA from which other short chain acyl-CoAs can be synthesized in the cytosol (Figure 1), lowers secretagogue-stimulated insulin release [11]. In addition, we observed that acetoacetate or β-hydroxybutyrate in combination with other metabolites stimulate insulin release in INS-1 832/13 cells and potentiate glucose-induced insulin release in rat pancreatic islets [12, 13]. Thus the current results strongly support other less direct evidence [11–14] that suggests the importance in insulin secretion of (a) pathway(s) involving SCOT in which insulin secretagogues can be metabolized in the mitochondria to acetoacetate. The acetoacetate can be exported to the cytosol and used for synthesis of short chain acyl-CoAs (Figure 1). This pathway can be used instead of, or in concert with, a pathway involving ATP citrate lyase that converts citrate exported from mitochondria to acetyl-CoA which is a precursor for other short chain acyl-CoAs in the cytosol.
Supplementary Material
Acknowledgments
This work was supported by NIH Grant DK28348, the Nowlin Family Fund of the Lutheran Community Foundation and the Oscar C. Rennebohm Foundation (to MJM) and Swedish Research Council and Swedish Diabetes Association (to CGO). We thank Elisabeth Noren-Krog for excellent technical assistance.
Footnotes
Abbreviations used: HMG-CoA, hydroxymethylglutaryl-CoA; mGPD, mitochondrial glycerolphosphate dehydrogenase; SCOT, succinyl-CoA:3-ketoacid-CoA transferase
MJM, unpublished observations.
Publisher's Disclaimer: This is a PDF file of an unedited manuscript that has been accepted for publication. As a service to our customers we are providing this early version of the manuscript. The manuscript will undergo copyediting, typesetting, and review of the resulting proof before it is published in its final citable form. Please note that during the production process errors may be discovered which could affect the content, and all legal disclaimers that apply to the journal pertain.
References
- 1.MacDonald MJ, Fahien LA, Brown LJ, Hasan NM, Buss JD, Kendrick MA. Perspective: emerging evidence for signaling roles of mitochondrial anaplerotic products in insulin secretion. Am J Physiol Endocrin Metab. 2005;288:E1–15. doi: 10.1152/ajpendo.00218.2004. [DOI] [PubMed] [Google Scholar]
- 2.MacDonald MJ. Metabolism of the insulin secretagogue methyl succinate by pancreatic islets. Arch Biochem Biophys. 1993;300:201–205. doi: 10.1006/abbi.1993.1028. [DOI] [PubMed] [Google Scholar]
- 3.MacDonald MJ. Estimates of glycolysis, pyruvate (de)carboxylation, pentose phosphate pathway, and methyl succinate metabolism in incapacitate pancreatic islets. Arch Biochem Biophys. 1993;300:205–214. doi: 10.1006/abbi.1993.1413. [DOI] [PubMed] [Google Scholar]
- 4.MacDonald MJ. Glucose enters mitochondrial metabolism via both carboxylation and decarboxylation of pyruvate in pancreatic islets. Metabolism. 1993;42:1229–1231. doi: 10.1016/0026-0495(93)90118-8. [DOI] [PubMed] [Google Scholar]
- 5.Khan A, Ling ZC, Landau BR. Quantifying the carboxylation of pyruvate in pancreatic islets. J Biol Chem. 1996;271:2539–2542. doi: 10.1074/jbc.271.5.2539. [DOI] [PubMed] [Google Scholar]
- 6.MacDonald MJ. Feasibility of a mitochondrial pyruvate malate shuttle in pancreatic islets. Further implication of cytosolic NADPH in insulin secretion. J Biol Chem. 1995;270:20051–20058. [PubMed] [Google Scholar]
- 7.MacDonald MJ. Evidence for the malate-asparate shuttle in pancreatic islets. Arch Biochem Biophys. 1982;213:643–649. doi: 10.1016/0003-9861(82)90594-x. [DOI] [PubMed] [Google Scholar]
- 8.Eto K, Tsubamoto Y, Terauchi Y, Sugiyama T, Kishimoto T, Takahashi N, Yamauchi N, Kubota N, Murayama S, Aizawa T, Akanuma Y, Aizawa S, Kasai H, Yazaki Y, Kadowaki T. Role of NADH shuttle system in glucose-induced activation of mitochondrial metabolism and insulin secretion. Science. 1999;283:981–985. doi: 10.1126/science.283.5404.981. [DOI] [PubMed] [Google Scholar]
- 9.Farfari S, Schulz V, Corkey B, Prentki M. Glucose-regulated anaplerosis and cataplerosis in pancreatic beta-cells: possible implication of a pyruvate/citrate shuttle in insulin secretion. Diabetes. 2000;49:718–726. doi: 10.2337/diabetes.49.5.718. [DOI] [PubMed] [Google Scholar]
- 10.Flamez D, Berger V, Kruhøffer M, Orntoft T, Pipeleers D, Schuit FC. Critical role for cataplerosis via citrate in glucose-regulated insulin release. Diabetes. 2002;51:2018–2024. doi: 10.2337/diabetes.51.7.2018. [DOI] [PubMed] [Google Scholar]
- 11.MacDonald MJ, Smith AD, III, Hasan NM, Sabat G, Fahein LA. Feasibility of pathways for transfer of acyl groups from mitochondria to the cytosol to form short chain acyl CoAs in the pancreatic beta cell. J Biol Chem. 2007;282:30596–30606. doi: 10.1074/jbc.M702732200. [DOI] [PubMed] [Google Scholar]
- 12.MacDonald MJ, Longacre MJ, Stoker SW, Brown LJ, Hasan NM, Kendrick MA. Acetoacetate and β-hydroxybutyrate in combination with other metabolites release insulin from INS-1 cells and provide clues about pathways in insulin secretion. Am J Physiol Cell Physiol. 2008;294:C442–C450. doi: 10.1152/ajpcell.00368.2007. [DOI] [PubMed] [Google Scholar]
- 13.MacDonald MJ, Hasan NM, Longacre MJ. Studies with leucine, β-hydroxybutyrate and ATP citrate lyase-deficient cells support the acetoacetate pathway of insulin secretion. Biochim Biophys Acta. 2008;1780:966–972. doi: 10.1016/j.bbagen.2008.03.017. [DOI] [PMC free article] [PubMed] [Google Scholar]
- 14.MacDonald MJ, Stoker SW, Hasan NM. Anaplerosis from glucose, α-ketoisocaproate, and pyruvate in pancreatic islets, INS-1 cells and liver mitochondria. Mol Cell Biochem. 2008;313:195–202. doi: 10.1007/s11010-008-9757-x. [DOI] [PubMed] [Google Scholar]
- 15.Hasan NM, Longacre MJ, Stoker SW, Boonsaen T, Jitrapakdee S, Kendrick MA, Wallace JC, MacDonald MJ. Impaired anaplerosis and insulin secretion in insulinoma cells caused by siRNA-mediated suppression of pyruvate carboxylase. J Biol Chem. 2008;283:28048–28059. doi: 10.1074/jbc.M804170200. [DOI] [PMC free article] [PubMed] [Google Scholar]
- 16.Xu J, Han J, Long YS, Epstein PN, Liu YQ. The role of pyruvate carboxylase in insulin secretion and proliferation in rat pancreatic beta cells. Diabetologia. 2008;51:2022–2030. doi: 10.1007/s00125-008-1130-9. [DOI] [PMC free article] [PubMed] [Google Scholar]
- 17.Jensen MV, Joseph JW, Ilkayeva O, Burgess S, Lu D, Ronnebaum SM, Odegaard M, Becker TC, Sherry AD, Newgard CB. Compensatory responses to pyruvate carboxylase suppression in islet beta-cells. Preservation of glucose-stimulated insulin secretion. J Biol Chem. 2006;281:22342–22351. doi: 10.1074/jbc.M604350200. [DOI] [PubMed] [Google Scholar]
- 18.Pongratz RL, Kibbey RG, Shulman GI, Cline GW. Cytosolic and mitochondrial malic enzyme isoforms differentially control insulin secretion. J Biol Chem. 2007;282:200–207. doi: 10.1074/jbc.M602954200. [DOI] [PubMed] [Google Scholar]
- 19.Xu J, Han J, Long YS, Lock J, Weir GC, Epstein PN, Liu YQ. Malic enzyme is present in mouse islets and modulates insulin secretion. Diabetologia. 2008;51:2281–2289. doi: 10.1007/s00125-008-1155-0. [DOI] [PMC free article] [PubMed] [Google Scholar]
- 20.Guay C, Madiraju SR, Aumais A, Joly E, Prentki M. A role for ATP-citrate lyase, malic enzyme, and pyruvate/citrate cycling in glucose-induce insulin secretion. J Biol Chem. 2007;282:35657–35665. doi: 10.1074/jbc.M707294200. [DOI] [PubMed] [Google Scholar]
- 21.Ronnebaum SM, Jensen MV, Hohmeier HE, Burgess SC, Zhou YP, Qian S, MacNeil D, Howard A, Thornberry N, Ilkayava O, Lu D, Sherry AD, Newgard CB. Silencing of cytosolic or mitochondrial isoforms of malic enzyme has no effect on glucose-stimulated insulin secretion from rodent islets. J Biol Chem. 2008;283:28909–28917. doi: 10.1074/jbc.M804665200. [DOI] [PMC free article] [PubMed] [Google Scholar]
- 22.Brown LJ, Longacre MJ, Hasan NM, Kendrick MA, Stoker SW, MacDonald MJ. Chronic reduction of the cytosolic or mitochondrial NAD(P)-malic enzyme does not affect insulin secretion in a rat insulinoma cell line. J Biol Chem. 2009;284:35359–35367. doi: 10.1074/jbc.M109.040394. [DOI] [PMC free article] [PubMed] [Google Scholar]
- 23.Giroix MH, Rasschaert J, Bailbe D, Leclercq-Meyer V, Sener A, Portha B, Malaisse WJ. Impairment of glycerol phosphate shuttle in islets from rats with diabetes induced by neonatal streptozocin. Diabetes. 1991;40:227–232. doi: 10.2337/diab.40.2.227. [DOI] [PubMed] [Google Scholar]
- 24.Ostenson CG, Abdel-Halim SM, Rasschaert J, Malaisse-Lagae F, Meuris S, Sener A, Efendic S, Malaisse WJ. Deficient activity of FAD-linked glycerophosphate dehydrogenase in islets of GK rats. Diabetologia. 1993;36:722–726. doi: 10.1007/BF00401142. [DOI] [PubMed] [Google Scholar]
- 25.MacDonald MJ, Efendic S, Ostenson CG. Normalization by insulin treatment of low mitochondrial glycerol phosphate dehydrogenase and pyruvate carboxylase in pancreatic islets of the GK rat. Diabetes. 1996;45:886–890. doi: 10.2337/diab.45.7.886. [DOI] [PubMed] [Google Scholar]
- 26.MacDonald MJ, Tang J, Polonsky KS. Low mitochondrial glycerol phosphate dehydrogenase and pyruvate carboxylase in pancreatic islets of Zucker diabetic fatty rats. Diabetes. 1996;45:1626–1630. doi: 10.2337/diab.45.11.1626. [DOI] [PubMed] [Google Scholar]
- 27.MacDonald MJ, Longacre MJ, Langberg EC, Tibell A, Kendrick MA, Fukao T, Ostenson CG. Decreased levels of metabolic enzymes in pancreatic islets of patients with type 2 diabetes. Diabetologia. 2009;52:1087–1091. doi: 10.1007/s00125-009-1319-6. [DOI] [PMC free article] [PubMed] [Google Scholar]
- 28.Fernandez-Alvarez J, Conget I, Rasschaert J, Sener A, Gomis R, Malaisse WJ. Enzymatic, metabolic and secretory patterns in human islets of type 2 (non-insulin-dependent) diabetic patients. Diabetologia. 1994;37:177–181. doi: 10.1007/s001250050090. [DOI] [PubMed] [Google Scholar]
- 29.MacDonald MJ. High content of mitochondrial glycerol-3-phosphate dehydrogenase in pancreatic islets and its inhibition by diazoxide. J Biol Chem. 1981;256:8287–8290. [PubMed] [Google Scholar]
- 30.Brown LJ, Koza RA, Everett C, Reitman ML, Marshall L, Fahien LA, Kozak LP, MacDonald MJ. Normal thyroid thermogenesis but reduced viability and adiposity in mice lacking the mitochondrial glycerol phosphate dehydrogenase. J Biol Chem. 2002;277:32892–32898. doi: 10.1074/jbc.M202408200. [DOI] [PubMed] [Google Scholar]
- 31.Schuit F, De Vos A, Farfari S, Moens K, Pipeleers D, Brun T, Prentki M. Metabolic fate of glucose in purified islet cells. Glucose-regulated anaplerosis in beta cells. J Biol Chem. 1997;272:18572–18579. doi: 10.1074/jbc.272.30.18572. [DOI] [PubMed] [Google Scholar]
- 32.Joseph JW, Odegaard ML, Ronnebaum SM, Burgess SC, Muehlbauer J, Sherry AD, Newgard CB. Normal flux through ATP-citrate lyase or fatty acid synthase is not required for glucose-stimulated insulin secretion. J Biol Chem. 2007;282:31592–31600. doi: 10.1074/jbc.M706080200. [DOI] [PubMed] [Google Scholar]
- 33.MacDonald MJ, Longacre MJ, Kendrick MA. Mitochondrial malic enzyme (ME2) in pancreatic islets of the human, rat and mouse and clonal insulinoma cell lines. Simple enzyme assay for mitochondrial malic enzyme 2. Arch Biochem Biophys. 2009;488:100–104. doi: 10.1016/j.abb.2009.07.004. [DOI] [PMC free article] [PubMed] [Google Scholar]
- 34.Asfari M, Janjic D, Meda P, Li G, Halban PA, Wollheim CB. Establishment of 2-mercaptoethanol-dependent differentiated insulin-secreting cell lines. Endocrinology. 1992;130:167–178. doi: 10.1210/endo.130.1.1370150. [DOI] [PubMed] [Google Scholar]
- 35.Hohmeier HE, Mulder H, Chen G, Henkel-Rieger R, Prentki M, Newgard CB. Isolation of INS-1-derived cell lines with robust ATP-sensitive K+ channel-dependent and –independent glucose-stimulated insulin secretion. Diabetes. 2000;49:424–430. doi: 10.2337/diabetes.49.3.424. [DOI] [PubMed] [Google Scholar]
Associated Data
This section collects any data citations, data availability statements, or supplementary materials included in this article.