Abstract
Slow-wave sleep is characterized by spontaneous alternations of activity and silence in corticothalamic networks, but the causes of transition from silence to activity remain unknown. We investigated local mechanisms underlying initiation of activity, using simultaneous multisite field potential, multiunit recordings, and intracellular recordings from 2 to 4 nearby neurons in naturally sleeping or anesthetized cats. We demonstrate that activity may start in any neuron or recording location, with tens of milliseconds delay in other cells and sites. Typically, however, activity originated at deep locations, then involved some superficial cells, but appeared later in the middle of the cortex. Neuronal firing was also found to begin, after the onset of active states, at depths that correspond to cortical layer V. These results support the hypothesis that switch from silence to activity is mediated by spontaneous synaptic events, whereby any neuron may become active first. Due to probabilistic nature of activity onset, the large pyramidal cells from deep cortical layers, which are equipped with the most numerous synaptic inputs and large projection fields, are best suited for switching the whole network into active state.
Keywords: intracellular, intrinsic, oscillations, sleep, synaptic, synchronization
Introduction
Slow-wave sleep is characterized by the presence of slow oscillation in the electroencephalogram (EEG; Blake and Gerard 1937). This slow oscillation consists of alternating periods of silence and activity in the corticothalamic networks (Contreras and Steriade 1995; Steriade et al. 2001; Timofeev et al. 2001). The active states are associated with depolarized membrane potential, vigorous synaptic activity, and cell firing, whereas during silent states, membrane potential is hyperpolarized and cells do not discharge. The high-density EEG recording in humans revealed that the slow oscillation spread over the cortex as traveling waves that may originate at different sites but typically in prefrontal-orbitofrontal regions (Massimini et al. 2004). In agreement with these human EEG data, our simultaneous multisite intracellular recordings in cat neocortex revealed that activity originated typically, but not exclusively, at a certain location (area 5/7 border) and spread from there in both anterior and posterior directions (Volgushev et al. 2006). All neurons in the neocortex, and most neurons in their target structures, are involved in the slow rhythm and oscillate in-phase, being simultaneously silent or simultaneously active (Steriade et al. 1993a, 1993b, 1993c; Contreras and Steriade 1995; Timofeev and Steriade 1996; Steriade et al. 2001; Mahon et al. 2006; Volgushev et al. 2006). How does activity originate during silent state, when no action potentials are generated by neocortical neurons? Three hypotheses on the origin of activity have been proposed. The first hypothesis suggests that spontaneous transmitter release in large neuronal populations occasionally depolarizes some cells to the firing threshold, thus initiating an active state in the network (Timofeev et al. 2000a). The “spontaneous release” hypothesis predicts that activity may start in any neuron, although cells receiving largest excitatory convergence will have higher probability of being activated before the others. The second hypothesis suggests that transition from silence to activity is mediated by intrinsic oscillations of layer V pyramidal neurons, which remain more depolarized because of their intrinsic or synaptic properties and generate some spikes between the active states when other cortical neurons are silent (Sanchez-Vives and McCormick 2000). Once initiated by layer V neurons, activity then propagates to other cortical layers. The “layer V neuron” hypothesis predicts that activity always originates in these neurons, whereas it appears later in other cells. The third hypothesis attributes transitions from silent to active states to the selective synchronization of spatially structured neuronal ensembles involving a small number of cells (Cossart et al. 2003). The “selective synchronization” hypothesis predicts that even during the silent states, some neurons of the network still generate irregular spontaneous firing. More recent studies provided controversial results. Intracortical recordings from epileptic patients demonstrated that active states originate in superficial layers (Cash et al. 2009). However, optical and patch-clamp recordings from layers II–III neurons from visual and somatosensory cortex of healthy rats demonstrated very low firing rates of these neurons, making them unlikely candidates for active state initiation (Waters and Helmchen 2006; Greenberg et al. 2008). Extracellular unit recordings from layer V neurons revealed that each neuron has its unique spiking pattern (Luczak et al. 2007) that contradicts the idea of stochastic origin of active states (Timofeev et al. 2000a; Cossart et al. 2003) but supports the hypothesis that particular set of neurons lead active state origin (Sanchez-Vives and McCormick 2000; Sanchez-Vives et al. 2008; Sakata and Harris 2009).
To test the above hypotheses and to understand the origin of active states, we investigated in which layer and in cells of which type subthreshold activity starts first and how it is transformed into neuronal firing. We performed multisite local field potential (LFP), extracellular multiunit, and intracellular recordings from closely located neurons in cat neocortex during natural slow-wave sleep and anesthesia-induced slow oscillation. We show that in local neocortical networks subthreshold activity could originate first in any neuron and at any depth, but activation of large pyramidal cells from deep layers is more likely to occur first, probably due to the large excitatory convergence on these cells.
Materials and Methods
Experiments were carried out in accordance with the guidelines published in the NIH Guide for the Care and Use of Laboratory Animals (NIH publication no. 86-23, revised 1987) and were approved by the Committee for Animal Care of Laval University.
Preparation
Experiments in Anesthetized Animals
Acute experiments were carried out on 16 adult cats of both sexes that had been anesthetized with ketamine and xylazine (10–15 and 2–3 mg/kg i.m., respectively). All pressure points and the tissues to be incised were infiltrated with lidocaine (0.5%). The animals were paralyzed with gallamine triethiodide and artificially ventilated, maintaining the end-tidal CO2 concentration at 3.5–3.8%. A permanent sleep-like state, as ascertained by continuous recording of the EEG, was maintained throughout the experiments by administering additional doses of ketamine (5 mg/kg). The body temperature was monitored by a rectal probe and maintained at 37 °C via a feedback-controlled heating pad. The heart rate was continuously monitored (90–110 bpm). The stability of intracellular recordings was ensured by cisternal drainage, bilateral pneumothorax, hip suspension, and by filling the hole made for recordings with a solution of 4% agar.
Experiments in Nonanesthetized Animals
Experiments on nonanesthetized animals were conducted on 2 adult cats, chronically implanted as previously described (Steriade et al. 2001; Timofeev et al. 2001). Briefly, surgical procedures for chronic implantation of recording and stimulating electrodes were carried out under deep barbiturate anesthesia (Somnotol, 35 mg/kg, i.p.), followed by 2–3 administrations, every 12 h, of analgesic (buprenorphine, 0.03 mg/kg, i.m.) to prevent pain. Penicillin (500 000 units i.m.) was injected during 3 consecutive days. During surgery, the cats were implanted with electrodes for electro-oculogram, electromyogram from neck muscles, and intracortical EEG recordings. In addition, a chamber allowing the intracellular penetrations of micropipettes was placed over neocortical areas 5 and 7. Acrylic dental cement was used to fix on the skull the electrodes and recording chamber.
Recording
LFP were recorded in the vicinity of impaled neurons and also from more distant sites, using either tungsten electrodes (10–12 MΩ) or 16-channel silicon probe (NeuroNexus Technologies, Inc. Ann Arbor, MI, USA) with 100-μm separation between recorded sites, inserted perpendicularly to the surface in neocortical areas 5, 7, or 21. Dual, triple, or quadruple intracellular recordings from suprasylvian association areas 5 and 7 were performed using glass micropipettes filled with a solution of 2.5 M potassium acetate. A high-impedance amplifier with active bridge circuitry was used to record the membrane potential and to inject current into the neurons. Neurons were recorded throughout the cortical thickness, whereby lateral distance between simultaneously recorded cells was usually about 100 μm but never exceeded 300 μm. The recorded cells were electrophysiologically identified as previously described (Connors and Gutnick 1990; Gray and McCormick 1996; Steriade et al. 1998; Steriade 2004). All electrical signals were sampled at 20 kHz and digitally stored on Vision (Nicolet, WI, USA). Offline computer analysis of electrographic recordings was done with IgorPro software (Lake Oswego, OR, USA) and with custom written MATLAB (The MathWorks, Inc.) programs. At the end of experiments, the cats were given a lethal dose of pentobarbital (50 mg/kg i.v.).
Analysis
To quantify the timing of the active state onset, we used 2 methods. With the first method, we fitted portions of the membrane potential traces (or of LFP recordings), which included the transitions from silent to active states with a sigmoid function and defined the onset time of active state at 10% of the fit amplitude (see Figs. 1, 4, 5, and 7). A reference channel was chosen arbitrarily, and the onset time of active state detected in recordings from each other electrode was then compared with this reference. These values were calculated for every cycle to produce delay histograms (see Figs. 1, 5, and 7). Varying the intervals used for sigmoid fitting did not significantly affect results on estimation of timing of active state onset (Fig. S1). In the second method, for detection of active and silent states in intracellular recordings, we used a combination of the level of membrane potential and the strength of its fluctuations (Volgushev et al. 2006). The mean membrane potential and its standard deviation (SD) were calculated in a running window of 25 ms, and occurrence of pairs of mean and SD values were plotted as 3D distribution (Fig. S2). Silent states form a sharp peak at hyperpolarized potentials and low SD values, whereas active states are represented by a broader hill at more depolarized potentials and higher SD values. Because the location of the peaks corresponding to active and silent states differs along both axes, the use of a combination of these 2 parameters improves detection and separation of the states. For detection of states in the LFP, we used the method based on different spectral composition of active and silent states and the increased contribution of high frequency fluctuations to the LFP during active states (Mukovski et al. 2007).
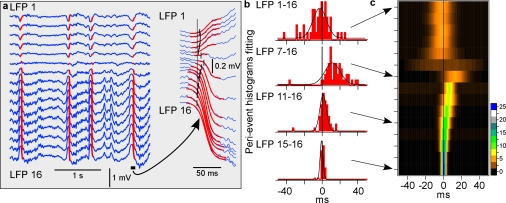
Figure 1.
Depth profile of the LFP during natural slow-wave sleep. (a) LFPs recorded with a 16-channel Michigan probe, inserted perpendicularly to the cortical surface. Red lines show sigmoidal fits of the transitions from silent state to active states. The point at which a fit reached 10% of its amplitude was taken as the onset time of an active state. One cycle is shown at expanded scale. (b) Histograms of delays of the active state onsets in indicated channels relative to the activity onset in channel 16, taken as the reference. Fifty cycles were used. Black lines show Gaussian fits. (c) Depth profile of active state onsets. For each channel, Gaussian fit of the distribution of activity-onset delays relative to channel 16 is shown, color coded for n cycles as indicated by the scale bar.
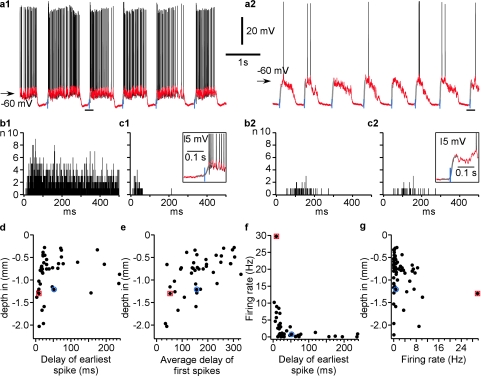
Figure 4.
Cells from deep layers fire earlier than other cells at the onset of active state. (a) Intracellular recording from 2 cells in area 7 of cat neocortex, with an exceptionally high firing rate (a1) and low firing rate (a2). Black traces show original recordings, superimposed red traces show the same segment of recordings after removing action potentials. The onset of active states (blue vertical lines) was determined with sigmoid fit (gray line) of the transition from silent to active state, at 10% of the fit amplitude. Insets show enlarged cycles indicated by the horizontal bars in (a). (b) Histograms of all spikes in cells shown in a1 and a2 relative to the active state onset (b1, 49 cycles, b2, 65 cycles). Bin width is 1 ms. (c) Histograms of the first spike delay at onsets of active states. Note that even in the cell with a very high firing rate, the first spike occurred several milliseconds after the onset of cell depolarization. No spikes occurred before the active state (depolarization) started. (d) Cell depth plotted against the delay of the earliest spike from all active states. Note that earliest spike delays in cells located between −1.0 and −1.4 mm were shorter than in other cells. (e) Cell depth plotted against the first spike delay averaged over all active states. Note again that cells from deep layers have a tendency to fire earlier than others. (f) Firing rate of cells plotted against the delay to the earliest spike at the onset of an active state. Note that cells with higher firing rate had shorter earliest spike delays. (g) Cell depth plotted against their firing rate. In (d–g), red square symbols mark data from the cell shown in a1, and blue circle symbols show data from the cell presented in a2.
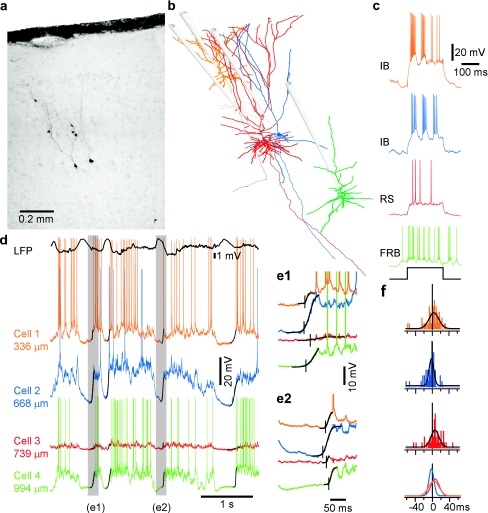
Figure 5.
Onsets of active states in local neuronal constellations. Data from 4 simultaneously recorded neurons are color coded; each neuron is represented by its own color in b–f. (a) Microphotograph and (b) Neurolucida reconstructions of 4 simultaneously recorded pyramidal cells. The gray neuron was recorded prior to cell-3 (red) with the same electrode. Position of recording electrodes is shown schematically. (c) Responses of the neurons from b to depolarizing current pulses and their electrophysiological identification as IB, RS, and FRB cells. (d) LFP and intracellular activities of 4 simultaneously recorded neurons. Black lines superimposed on membrane potential traces show sigmoid fits of active state onsets. (e) Two periods from d shown at expanded scale. Vertical bars indicate active state onsets. Note the different order of activity onset in neurons in the 2 episodes. (f) Distributions of delays of active state onsets in cells 1–3 relative to the activity onset in cell 4 taken as reference. The lowermost panel shows an overlay of the 3 distributions. Note the negative shift of the cell 2, blue delay distribution, indicating that this IB cell had a tendency to lead in the majority of cycles and the positive shift of histogram for cell 3 (red) indicating that this RS cell was often the last involved in activity.
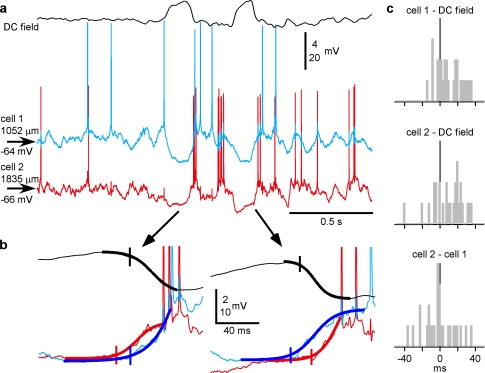
Figure 7.
The high variability of active state onsets in cells during natural sleep. (a) Simultaneously recorded DC field potential and intracellular activity of 2 closely located (<100 μm in lateral distance) neurons. (b) Two cycles from (a) shown at expanded scale. Action potentials are truncated. The thick line shows sigmoid fits of transitions to active states. Note the opposite order of activity onset in the 2 cells in 2 consecutive cycles. (c) Distributions of the activity-onset delays in the 2 cells relative to the onset of active state in DC field potential and in the simultaneously recorded cell. Note that all distributions cover zero, and thus, in any pair, the opposite orders of activation were encountered, with delays up to 40 ms.
For current-source density (CSD) analysis (see Fig. 2), the LFP recordings were filtered between 0.5 and 6 Hz to eliminate the influence of other rhythm. According to original description (Nicholson and Freeman 1975; Mitzdorf and Singer 1978; Mitzdorf 1985), we used the following formula to calculate the CSD:
where Φi is the field potential in mV at a given electrode i, R is in MΩ, Z is the distance between electrodes in mm, Im is CSD in mV/mm2.
Figure 2.
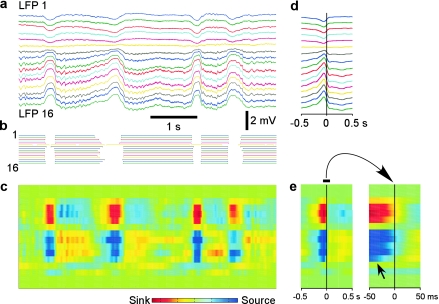
Alternating pattern of current sinks and sources during natural slow-wave sleep revealed with CSD analysis. (a) Depth profile of LFPs recorded with a 16-channel silicon probe inserted perpendicularly to the cortical surface. (b) Active states detected in LFP traces from (a). (c) CSD analysis of the traces from (a). Note alternating pattern of sinks and sources corresponding to the slow waves in the LFP. (d) Depth profile of averaged LFPs during the transition from silent to active states. Mid amplitude in the transition from silent to active states in channel 16 in a 150-s recording segment were taken as reference (zero point in timescale in (d) for calculating averages (n = 101) in all channels. (e) Averaged CSD during the transition from silent to active state, and its central portion at 10-fold higher temporal resolution (right panel). Note that during active states, the flow of current is less pronounced and more variable in terms of spatiotemporal organization of sources and sinks than during silent states.
For population analysis of activity onsets in groups of 2–4 simultaneously recorded neurons (see Fig. 6d), we calculated the delay of activity onset in a particular cell relative to the mean onset time of the recorded group of cells for every transition from silent to active state. These delays were compiled for many cycles (more than 50), and the mean delay for each cell was calculated and plotted in relation to the recording depth (blue points in Fig. 6d) and electrophysiological type of the cell (see Fig. 11b).
Figure 6.
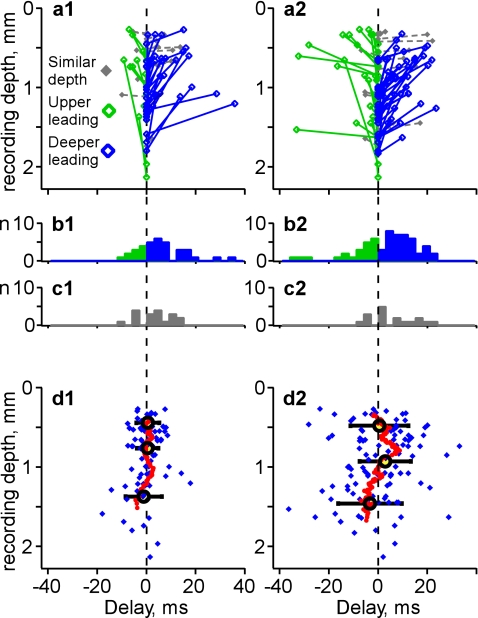
Depth profile of activity onset in simultaneously recorded neurons: Population analysis. (a) Dependence of activity onset on the recording depth in cell pairs. Each pair of simultaneously recorded neurons is represented by 2 symbols connected with a line. Y-coordinates show the depth at which the cell was recorded. Delays of activity onsets in the upper cell in a pair were calculated relative to the activity onsets in the deeper cell, taken as reference. Positive delays (blue) indicate pairs with deeper cell leading; negative delays (green) indicate pairs with upper cell leading. Gray indicates recordings with similar depth (vertical difference <100 μm). Left column, analysis of the onsets of active states obtained with the method of sigmoid fits; right column, detection of the beginning of developed active states using the method based on values of membrane potential and its SD. (b,c) Distributions of the delays in cell pairs, color coded as in (a). (d) Dependence of the delay of activity onset in state clusters on recording depth. Each blue diamond symbol represents data for one cell. Running averages (red symbols) were calculated for sets of 17 neurons. For gross averages (cycles, ±SD), cells were segregated in 3 nearly equally populated groups, (d1) above 575 μm (n = 27), between 575 and 1050 μm (n = 27), and deeper than 1050 μm (n = 27). (d2) above 670 μm (n = 36), between 670 and 1100 μm (n = 35), and deeper than 1100 μm (n = 36). Note that, most often, activity started earlier in the deeper neurons.
Figure 11.
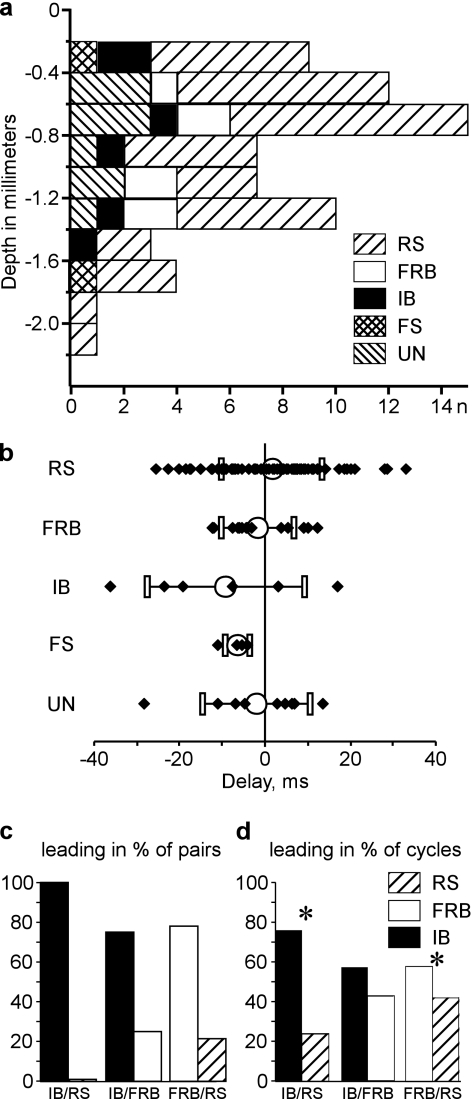
IB cells are leading the onset of active states. (a) Depth distribution of different types of neocortical neurons, as indicated by symbols: RS, FRB, IB, and fast spiking (FS). UN—unidentified neurons. Note that neurons of all electrophysiological types were found at any depth. (b) Delay of onsets of clustered active states in cells of different electrophysiological types. (c,d) Activity onset in pairs composed of different cell types. IB cells were leading in all pairs consisting of IB/RS cells (n = 5 pairs), and in 3 of 4 IB/FRB pairs. In these pairs, the IB cells were also leading in most of individual activity cycles (IB/RS: n = 210 cycles; IB/FRB, n = 182 cycles). In FRB/RS pairs, FRB cells were leading in 7 of 9 pairs, and in the majority of cycles (n = 544 cycles). *In (d) indicates significant difference, P < 0.05 to a bilateral binomial test approximated by normal law. For IB/FRB pairs, P = 0.054.
Results
We studied the origin of active states in local neocortical networks during slow-wave sleep and anesthesia-induced slow oscillation using multisite LFP, multiunit activities, and simultaneous intracellular recordings from 2 to 4 neurons. To obtain the depth profile of the field potentials and distribution of current sinks and sources, we made recordings with a 16-channel silicon probe inserted perpendicularly to the cortical surface. The same recordings were also used to estimate the depth profile of multiunit activities during slow-wave sleep. To further investigate the underlying neuronal processes, simultaneous recordings of LFP from deep layers and intracellular activity of 2–4 closely located neurons were used.
Depth Profile of Field Potentials, Current Sinks and Sources during Natural Slow-Wave Sleep
During natural slow-wave sleep, the LFP displays characteristic picture of slow oscillation (Fig. 1), which reflect alternation of active and silent states in the neocortical network (Steriade et al. 2001; Timofeev et al. 2001; Rudolph et al. 2007). Slow waves are evident throughout the cortex, but their amplitude and polarity change gradually with recording depth.
To study the depth profile of activity onset and to see whether it originates in a particular cortical layer, we detected the onsets of activity in LFP recorded simultaneously at different depth. LFP waves, corresponding to the transitions from silence to activity were fitted with a sigmoid curve, and the time point at 10% of the fit amplitude was taken as the onset of active state (Fig. 1a). The activity onset time detected with this method changed only marginally when the length of the intervals containing the silent-active transition, which were used for fitting was changed, thus showing that detection of onset time was robust (Fig. S1). For each channel, a distribution of activity onsets relative to the deepest recorded channel (LFP-16, Fig. 1b,c) was calculated. This analysis revealed clearly different patterns of activity onsets in superficial and deep layers. In deep layers, activity started typically at 1400–1600 μm, (Fig. 1c, channels 14–16) and propagated from there toward the middle of the cortex (Fig. 1c, channel 7). Both the peak shift and width of the onset delay distributions increased systematically in channels 14 through 7, indicating the increase of delays of active state onsets and their variability (Fig. 1b,c). In the superficial layers, the LFP signal was inversed as compared with deep recordings, the distributions of activity-onset delays were broader indicating that activity in the superficial layers appeared with highly variable timing relative to deep recordings (Fig. 1c). All but one distribution of activity-onset delays covered zero, demonstrating that activity may appear first at any depth (Fig. 1c). Similar results were obtained, when the onsets of active states were detected with a method exploiting differential spectral composition of the LFP during active and silent states (Mukovski et al. 2007) (data not shown). Similar results were obtained in ketamine–xylazine anesthetized cats (Chauvette et al. 2007).
To investigate further the depth distribution of possible sources of activity during slow sleep oscillation, we performed CSD analysis (Nicholson and Freeman 1975; Mitzdorf and Singer 1978; Mitzdorf 1985). In the CSD map (Fig. 2c), extracellular current sinks correspond to intracellular inward (depolarizing) current, whereas current sources correspond to intracellular outward (hyperpolarizing) current (Mitzdorf and Singer 1978; Mitzdorf 1985). The map reveals a strikingly clear relation between alternating pattern of current sinks and sources and alternating periods of active and silent states (Fig. 2a–c). During silent states, we observed strong sinks in the upper layers (positions 3–6 in Fig. 2c) and sources in deeper layers (positions 8–12). Upon the transition to active states, the picture reverses to the opposite: sinks in the deeper layers and sources in the upper layers. During active states, the sources and sinks are generally weaker and much more variable both in space and in time than during silent states, indicating that during activity in neocortical networks, the flow of currents through the cortical depth is less regular and subject to stronger variability. Activity onset–triggered average shows that the reversal of the depth profile of sinks and sources is typical for the transition from silence to activity: A sharp transition from a strong superficial sink and deeper source to weaker deep sinks and superficial sources stands out very clear in Figure 2e (n = 101 episodes averaged for each channel). Examination at higher temporal resolution reveals that during the transition to activity, a switch from sources to sinks occurs earlier around channel 12 (Fig. 2e, right panel, see arrow) and then “spreads” upward, toward channel 8. This observation is consistent with the depth profile of activity onset, described above.
Depth Distribution of Firing at the Onset of Active State in Simultaneously Recorded Multiunit Activity during Slow-Wave Sleep
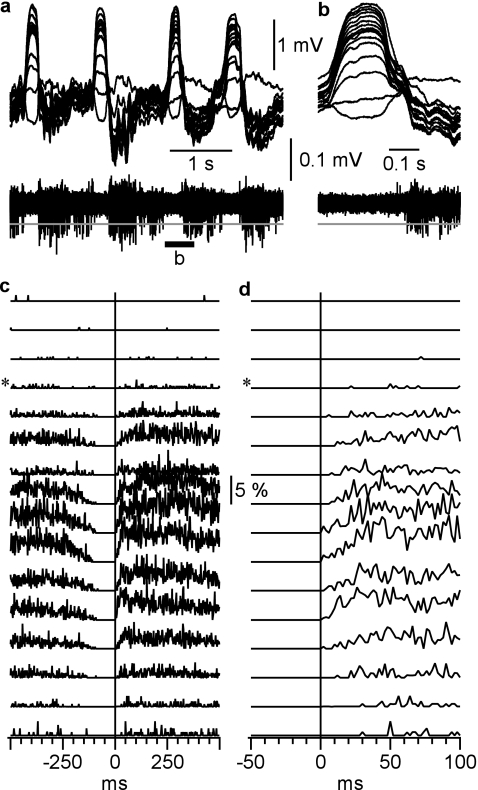
To study depth profile of firing of neocortical neurons during transition from silent to active state, we performed multiunit recordings during slow-wave sleep (Fig. 3). The onset of active state was detected using sigmoid fits of the field potential from deepest electrode, at 10% of the amplitude of transition from silent to active state (see Fig. 1 for detail). Distinct from in vitro results (Sanchez-Vives and McCormick 2000; Sanchez-Vives et al. 2008), in vivo multiunit recordings during natural slow-wave sleep did not show any firing during silent state at any cortical depth (Fig. 3). Absence of firing during the silent state stands out clearly both in individual recordings (Fig. 3a,b) and in the averaged data for 290 silence–activity cycles recorded at 5 different locations in suprasylvian gyrus during 5 sleep episodes (Fig. 3c,d). The earliest firing was detected just after the onset of active state in electrodes 8–12, which corresponds to the depth of 800–1200 μm and thus to layer V of the suprasylvian gyrus (Hassler and Muhs-Clement 1964). Activities recorded from that depth have also showed the highest firing probability (Fig. 3c,d). Neurons start to discharge only when depolarized to their firing threshold. In these experiments, first spikes occur after field potential recordings already started a transition toward active states, indicating that at least some neurons started to depolarize at this time.
Figure 3.
Depth distribution of neuronal firing during slow-wave sleep. (a) LFP (top traces) and multiunit activity (bottom trace) recordings at the border of cortical areas 5 and 7 (associative cortex) during short episode of slow-wave sleep. Recordings were performed with a 16-channel silicon probe inserted perpendicularly to the cortical surface. The recording sites were separated by 100 μm, the upper recording site was just below cortical surface. LFP and multiunit activity traces were obtained from the same electrodes, by band-pass filtering 0.1 Hz to 10 kHz and 0.5–10 kHz, respectively. (b) A segment from (a) as indicated by the bar, at higher temporal resolution. (c) Probability distributions of multiunit firing during a cycle of slow oscillation. Pooled data from 290 cycles from 5 different sleep episodes. Spikes were detected as all peaks that exceeded a threshold (gray lines in a and b), set at 5× SD of the noise fluctuations during silent state. * Indicates the electrode at which the polarity of slow waves were reversed. Vertical line shows onset of active state determined in the LFP recorded from the deepest electrode. (d) Zoom in on the silent to active state transition from (c). Note that the first firing occurs in neurons located between 800 and 1200 μm from cortical surface.
To investigate the relation between the onset of neuronal depolarization and the onset of firing, we performed intracellular recordings from the same cortical area from cats under ketamine–xylazine anesthesia (Fig. 4), which closely reproduces sleep slow oscillation (Contreras and Steriade 1995). During slow oscillation, the membrane potential of neocortical neurons switched between 2 states: active state, associated with depolarized membrane potential, vigorous synaptic activity and firing, and silent state, during which membrane potential was hyperpolarized and the cells did not generate action potentials (Fig. 4, see also figs. 5, 7–10 and Fig. S2). Active state onsets were determined using sigmoid fits of the membrane potential traces after removal of spikes (Fig. 4a). Active state onset was used then as a trigger to build histograms of all spikes (Fig. 4b) and of the first spikes (one from each active state, Fig. 4c). Using these data, for each cell, we determined the minimum delay of the first spike among all active states (“earliest spike”) and calculated the average delay of the first spikes in that cell. This analysis showed that cells from deep layers have a clear tendency to fire before other cells. Both the earliest spike delay and averaged first spike delay were shorter in deep-layer cells (Fig. 4d,e). In agreement with modeling studies (Marsalek et al. 1997; Diesmann et al. 1999), we found that the earliest spike delays were shortest for neurons that exhibited highest firing rates (Fig. 4f). In agreement with our extracellular unit recordings during slow-wave sleep (Fig. 3), we found that highest firing rates were observed in cells recorded deeper than 800 μm (Fig. 4g).
Figure 10.
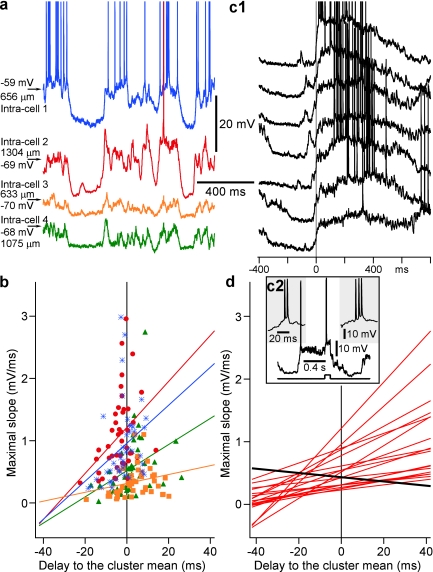
Earlier involvement in activity is associated with slower transitions to active states. (a) A segment of simultaneous quadruple intracellular recording from closely located neurons in area 7, performed under ketamine/xylazine anesthesia. (b) Maximal slope of a transition from silent to active state, estimated from sigmoid fitting, plotted against the delay of the cell relative to the mean onset of activity in the cluster. Each point shows data for one cycle. For each cell, a regression line is shown. Color code corresponds to the 4 cells in (a). Note that in cycles in which activity onset in a cell was earlier than in other cells (negative delays), the slope of transition was smaller, typical for a progressive synaptic buildup. (c1) Examples of transitions from silent to active state in a cell that often showed a strong buildup of depolarization prior to the transition. Zero time is half amplitude of depolarization. The cell was IB, as identified by bursts during both spontaneous activity (left inset in c2) and in responses to depolarizing current pulses (right inset in c2). (d) Relation between maximal slope of transition from silent to active states and the delay of activity onset in the cell relative to the mean onset in the cluster. Regression lines (as in b) for 18 cells. Note that in 17 of 18 neurons, earlier onsets of active state were associated with smaller slopes of transition. The only one cell showing an inverse relation (black line) is illustrated in c.
Activity Onset in Simultaneously Recorded Nearby Neurons during Slow Oscillation and Slow-Wave Sleep
To study cellular mechanisms of the active state onsets, which underlay the slow waves, we made simultaneous LFP and quadruple, triple, or dual intracellular recordings from nearby neurons (<200 μm lateral distance, Fig. 5). Most of recordings were made under ketamine/xylazine anesthesia. The recorded cells were electrophysiologically identified (Fig. 5c), and some of them (n = 12) were intracellularly labeled and reconstructed using a Neurolucida system (Fig. 5a,b). On a coarse timescale, periods of activity and silence occurred at about the same time in all simultaneously recorded nearby neurons, independent of their depth (Fig. 5d, see also Figs. 7 and 10 and Fig. S2). We never observed inversed phase relation between slow waves in membrane potential traces of simultaneously recorded neurons.
To quantify the timing of the active states in simultaneously recorded neurons, we have used 2 approaches, similar to those used in analysis of LFP. The first method used the time at 10% amplitude of a sigmoid fitting of the transition from silent to active state to identify “the onset of active state” (Fig. 5e, see Fig. 1 and Fig. S1 for onsets in LFP). The second method exploited the level of membrane potential and the strength of its fluctuations (Volgushev et al. 2006) to separate states (Fig. S2) and thus detected “the beginning of developed active states.” The results obtained with both state detection methods are described together.
On the fine timescale, the sequence of involvement of simultaneously recorded neurons in activity was not uniform but varied from one cycle to the other, whereby any neuron could be leading in some particular cycles (Fig. 5e and Fig. S2b). Distributions of activity-onset delays in any cell relative to the other always covered zero, indicating the high variability in the sequence of activation of neurons (Fig. 5f).
Population analysis of activity onset estimated with both methods revealed that neurons recorded in deep layers were leading, as indicated by high occurrence of negative delays in these cells as compared with superficial layer neurons (Fig. 6a,d). In neurons recorded at intermediate depths, activity usually started after the other cells, as indicated by the high occurrence of positive delays. Finally, in cells from superficial layers, positive and negative delays were nearly equally frequent, and the spread of delays was high. This depth profile stands out very clearly in the plot of running average of activity-onset delays (red symbols in Fig. 6d). For further quantification of the dependence of activity onset on recording depth, we segregated the cells by the recording depth in 3 nearly equally populated groups. Group averages confirmed the above conclusions. For the “onsets” of active states (method of sigmoid fitting), the averaged delay was negative for the group of deep cells (−1.1 ± 7.4 ms, mean ± SD, n = 27, mean depth 1373 μm, all cells located deeper than 1050 μm), but positive, close to zero for the middle group (0.5 ± 4.4 ms, n = 27, mean depth 763 μm, ranging from 575 to 1050 μm), and the group of superficial cells (0.6 ± 4.7 ms, n = 27, mean depth 442 μm, all cells located superficially to 575 μm) (Fig. 6d1). The averaged delay of “developed” active states was negative, –3.38 ± 13.2 ms (n = 36) in the group of deep-layer cells (mean recorded depth 1476 μm, all cells located deeper than 1100 μm), positive in the middle group (2.9 ± 10.6 ms, mean depth 920 μm, depth ranging from 670 to 1100 μm, n = 35), and close to zero in the group of superficially located cells (0.56 ± 12.46 ms, mean depth 485 μm, all cells located superficially to 670 μm, n = 36) (Fig. 6d2). Slight difference in timing estimated with the 2 methods could be due to the different steepness of activity onset in different neurons. Figure S3 illustrates such an example, with large time difference in the onsets of active states in 2 neurons but a much less difference in the timing of the beginning of the developed state. Opposite examples, with smaller time difference of the onsets and larger time difference between developed states were also observed (data not shown). The reason for the different steepness of activity onset could be a combination of the strength of synaptic drive, properties of individual synaptic responses, and intrinsic membrane properties of a cell (Llinás 1988; Wang et al. 2006; Cruikshank et al. 2007). Conclusion on the earlier onset of activity in deep-layer cells is further substantiated by the pairwise analysis. For each pair of simultaneously recorded cells, we have calculated activity-onset delay in the more superficially recorded cell relative to the deeper neuron in the pair. The pairs in which the deeper cell was leading were encountered by far more frequently than the pairs with the upper cell leading (25 pairs, blue vs. 10 pairs, green, in Fig. 6a1,b1; and 54 pairs, blue, vs. 23 pairs, green, in Fig. 6a2,b2). P values for deeper versus upper leading of a bilateral binomial test approximated by normal law were 0.011 for “onsets of active states” (Fig. 6a1) and 0.0004 for “developed active states method” (Fig. 6a2) indicating highly significant differences. Interestingly, this difference was clearly expressed also in the pairs composed of cells with only minor depth difference (<100 μm, n = 23 pairs, gray in Fig. 6a2,c2 and n = 18 pairs, gray in Fig. 6a1,c1).
To verify whether the conclusions drawn from intracellular recordings made under ketamine/xylazine anesthesia hold true for natural slow-wave sleep, we performed intracellular recordings from single cells and simultaneous intracellular from pairs of cells in nonanesthetized and nonparalyzed cats (Figs. 7 and 8). Similar to previous studies (Steriade et al. 2001; Timofeev et al. 2001; Rudolph et al. 2007), during quiet waking and rapid-eye-movement sleep, the LFP displayed typical activated pattern and neurons remained in active state (data not shown). During slow-wave sleep, the large amplitude slow waves in the LFP were associated with transitions between silent and active states in the membrane potential of cortical neurons (Figs. 7a and 8a). Analysis of simultaneous recordings from 5 pairs of RS neurons confirmed that the main characteristics of slow oscillations seen in the multisite intracellular recordings under ketamine/xylazine anesthesia are also evident during natural slow-wave sleep. Specifically, in recordings made during natural slow-wave sleep, we found evidence for 1) clear correspondence between slow waves in the LFP and alternations of active and silent states in the membrane potential, with common periods of activity and silence in simultaneously recorded cells (Fig. 7a). 2) Variable sequential order of involvement of recorded cells in activity, whereby the order of cell involvement may reverse even in the nearby cycles separated by less than 1 s (Fig. 7b). 3) Variable delays between activity onsets in simultaneously recorded neurons relative one to the other and the LFP waves, the delays occasionally reaching tens of milliseconds (Fig. 7c). Taken together, these results show that inferences from the data obtained during anesthesia-induced slow oscillation provide useful clues on cellular mechanisms of natural slow-wave sleep.
Figure 8.
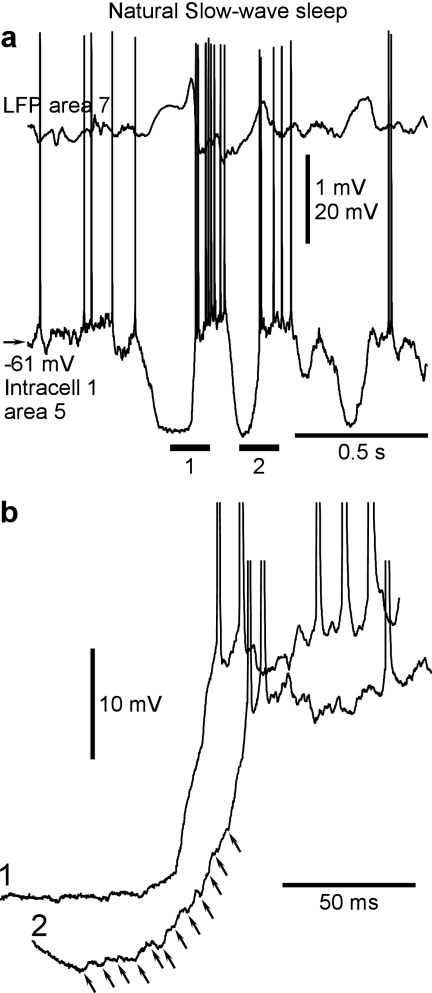
Progressive buildup versus sharp transitions from silent to active states. (a) Intracellular and LFP recordings during natural slow-wave sleep. (b) Zoom in on active state onsets from 2 consecutive cycles. Note the presence of many individual events (oblique arrows) in the onset with slow development of depolarization (2) and a smooth slope of a rapid transition (1).
Synaptic Buildup at the Onset of Active States
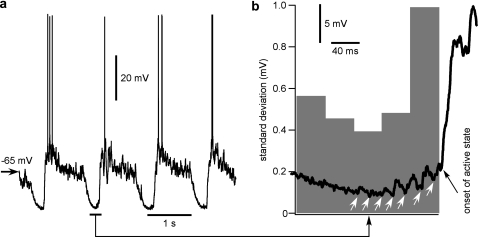
The onset of active states is dominated by excitatory conductances (Haider et al. 2006; Rudolph et al. 2007). They may be produced by either spike-independent spontaneous transmitter release (minis) or synaptic release triggered by action potentials generated by neurons that are already engaged in activity. Because minis have small amplitude and are not synchronized, a minis-driven onset of active state in a neuron should manifest itself by a slow buildup of depolarization before the spiking threshold is eventually reached. If active states of the network originate by this mechanism, the slow buildup of depolarization prior/at the beginning of active state should be most often encountered in leading neurons. In contrast to spontaneous origin of activity, active states in neurons driven by already activated network should exhibit faster depolarization at the transition from the silent to active state. We have looked for these characteristic signatures in transitions in intracellular recordings during natural sleep (Fig. 8) and in anesthetized cats (Fig. 9). In all these experimental conditions, we have observed transitions toward active states of both types, with slow or rapid buildup of depolarization. Figure 8 illustrates transitions of both slow and fast types in the neighboring activity cycles, recorded in the same cell during natural slow-wave sleep. Figure 8b, (1) shows a rapid transition with a smooth front and no clearly discernible individual synaptic potentials. In the next cycle, transition in that cell was slow, with an uneven front on which many individual synaptic events that summate and build up the depolarization toward the active state are apparent (Fig. 8b, 2). Both types of transitions were also observed under ketamine/xylazine anesthesia (Fig. 9). A signature of spontaneous release-driven onset of active states would be an increase of the membrane potential variability toward the end of silent states due to the increased spontaneous release. Indeed, the SD of the membrane potential clearly increased in presumably leading neurons in the majority of cycles of slow oscillation just prior to the onset of active state (Fig. 9b). If a slow buildup of depolarization due to spontaneous release indeed plays a role in initiation of active states, it should be most pronounced in neurons that engage in activity earlier than other cells. To test this conjecture, we used multisite intracellular recordings and computed for each neuron and oscillation cycle the relation between the maximal slope of transition to an active state and delay of the onset of active state in that neuron relative to other simultaneously recorded neurons (Fig. 10). Results of this analysis are consistent with the above conjecture: In a vast majority of neurons (17 of 18), transition was slower when the cell was involved earlier in the active state (Fig. 10b,d). However, one neuron recorded at a depth of 900 μm (which corresponds to upper layer 5 according to Hassler and Muhs-Clement 1964) exhibited atypical behavior. It had the fastest slope of transition to active state in those cycles when it was leading other cells but a slightly slower transition when activated later than other cells (Fig. 10d, black line). Typical for this neuron was a clear presence of synaptic events prior to the onset of active state (Fig. 10c, 1) and bursts of action potentials during spontaneous activity and current injection (Fig. 10c, 2). This and other neurons with such properties are best suited to lead onsets of network active states.
Figure 9.
Membrane potential fluctuations increase just before the onset of active state. (a) Intracellular recording in suprasylvian gyrus (area 7) of cat anesthetized with a mixture of ketamine and xylazine. (b) A segment from a is enlarged and superposed on a histogram showing the averaged membrane potential SD (n = 50 cycles, 0 time is active state onset defined with sigmoid fit). Bin width is 40 ms. Note the large increase in the SD of the membrane potential just prior to the active state onset.
Next, we investigated if active states originated earlier in neurons of a particular electrophysiological class. In agreement with our previous observations (Timofeev et al. 2000b), all electrophysiological types of neurons could be recorded at any depth (Fig. 11a). The group analysis revealed a clear tendency for intrinsically bursting (IB) neurons to lead in activity onsets (averaged delay –9.0 + 18.4 ms, n = 7 cells, Fig. 11b). Two kinds of pairwise analyses corroborate this result. The IB neurons were leading in all 5 pairs consisting of an IB and a regular-spiking (RS) cell, and in 3 of 4 pairs consisting of an IB and a fast-rhythmic-bursting (FRB) cell (Fig. 11c). Furthermore, in these pairs, the IB cells were leading in the majority of individual cycles (Fig. 11d, 76.4% of cycles in IB–RS pairs, P < 0.001 and 57.1% of cycles in IB/FRB pairs, P = 0.054). These results show that despite the stochastic nature of active state onset, the IB cells engage in active states before other neurons, and are thus in the position to either initiate or to spread the onset of active state.
Discussion
Our study of local mechanisms of origin of slow oscillation with multisite LFP, multiunit recordings, and simultaneous intracellular recordings from 2 to 4 neurons revealed a clear depth profile of activity onsets. In both, extracellular and intracellular recordings, activity started most frequently at deep locations but appeared later in the middle of the cortex. This general tendency was apparent despite a high cycle-to-cycle variability of onsets at any depth. Our data emphasize that the LFP waves and the distribution of current sinks and sources were mirror-like in the deep as compared with the superficial layers. In contrast to the LFP and CSD, the slow waves in the membrane potential of simultaneously recorded neurons were always in-phase, independent of their depth. We never observed firing during hyperpolarizing silent state in multiunit recordings or intracellular recordings obtained during both natural slow-wave sleep and ketamine/xylazine-induced slow oscillations. This result is in a striking contrast to some previous studies performed in vitro (Sanchez-Vives and McCormick 2000; Compte et al. 2003; Sanchez-Vives et al. 2008) or with in vivo multiunit recordings from sensory cortices of anesthetized rats (Hasenstaub et al. 2007; Sakata and Harris 2009), which observed firing of some neurons during silent state of the network. Our multiunit recordings during natural sleep and intracellular recordings under ketamine/xylazine anesthesia show that deep layer (presumably layer V) neurons have a clear tendency to depolarize and fire action potentials at the onset of active state earlier than other neurons and thus lead the onset of activity in the network. The leading neurons revealed a prominent synaptic buildup prior to the onset of active states, when no firing was observed in nearby neurons, and the firing of the first action potential in these neurons had the shortest latency from the onset of active states. This conclusion on the leading role of large deep layer pyramids in the onset of active states is in agreement with previous studies (Sanchez-Vives and McCormick 2000; Sakata and Harris 2009), but stands in a marked contrast to results of intracortical recordings from human cortex surrounding epileptic foci, in which active states originated in superficial layers (Cash et al. 2009). One possible reason for this peculiar finding could be alterations of cell properties in the cortical tissue surrounding epileptic foci.
Cortical Origin of Active States during Slow Sleep Oscillation
Several lines of evidence show that alternation of active and silent states, which underlies slow oscillation, is of cortical origin. The slow oscillation was observed in athalamic animals (Steriade et al. 1993b) and other isolated cortical preparations (Sanchez-Vives and McCormick 2000; Timofeev et al. 2000a) but not in the thalamus of decorticated animals (Timofeev and Steriade 1996). Our results provide further evidence corroborating this assumption. In the case of initiation of cortical activity by thalamic input, a characteristic picture of current sinks originating in the granular layer and spreading to other cortical layers would be expected (Mitzdorf and Singer 1978; Mitzdorf 1985). Moreover, if thalamocortical neurons would contribute significantly to initiation of active states (Hughes et al. 2002; Zhu et al. 2006, Crunelli and Hughes 2010), multiunit recordings would reveal the earliest firing at the onset of active states in layer IV cells, which receive strongest thalamic input. Because such patterns of CSD and multiunit firing were never observed during transitions to active states, thalamic initiation of active states could be excluded.
Origin of Activity: What Drives the First Neuron to Generate the First Spike?
Three hypothetic mechanisms have been proposed so far to explain the intracortical origin of activity during slow oscillation: spontaneous release (Timofeev et al. 2000a), intrinsic properties of layer V neurons (Sanchez-Vives and McCormick 2000), and selective synchronization of small neuronal ensembles (Cossart et al. 2003) (see the Introduction).
The latter mechanism requires that at least some neurons are active and generate spikes during the silent states of the cortical network. In this and previous studies (Contreras and Steriade 1995; Timofeev and Steriade 1996; Steriade et al. 2001; Timofeev et al. 2001; Volgushev et al. 2006), not a single neuron was systematically active while other cells were in silent states. Thus, firing of a particular set of neurons during network silence was not observed, contradicting the notion that specific set of neurons is responsible for initiating network active states (Sanchez-Vives and McCormick 2000; Cossart et al. 2003).
Several arguments make the mechanism relying exclusively on intrinsic oscillations in layer V neurons (Sanchez-Vives and McCormick 2000), or other cortical neurons, an unlikely explanation of the origin of active states in vivo. Most of the known intrinsic currents that are capable of maintaining prolonged depolarization and firing require a strong initial signal for their activation (Fleidervish and Gutnick 1996; Pedroarena and Llinás 1997). The source for such a signal is lacking during the silent state, when no action potentials are generated in the network. The only current that is activated close to the resting membrane potential and that can lead to a cell discharge is hyperpolarization-activated depolarizing current (McCormick and Pape 1990). However, this current is weak in cortical neurons and cannot lead to their discharges as it does in the thalamic neurons. Direct proof that intrinsic properties of cortical neurons cannot alone support initiation of active states comes from in vitro studies showing that active states are abolished by blocking postsynaptic glutamate receptors (Sanchez-Vives and McCormick 2000; Shu et al. 2003). It is worth noting that the exclusive role of layer 5 neurons in the generation of active states was demonstrated only in slices maintained in “modified” artificial cerebrospinal fluid. In these conditions, all (Sanchez-Vives and McCormick 2000) or about a half (Shu et al. 2003) of layer V neurons continuously fire during silent states. Such a pattern was never observed in vivo in anesthetized or naturally sleeping cats (see above).
The mechanism of initiation of activity, which relies on spontaneous release (Timofeev et al. 2000a), appears more realistic. Active states originate from silent state, when all cortical neurons are silent and do not fire spikes, and thus only spike-independent, spontaneous release takes place (Salin and Prince 1996; Paré et al. 1997; Timofeev et al. 2000a). Its total postsynaptic effect on a neuron depends on the number of synapses at the neuron and the frequency of spontaneous events. In the neocortex, silent states are associated with an increase of extracellular Ca2+ concentration (Massimini and Amzica 2001; Crochet et al. 2005) that mediates an increase in evoked release probability toward the end of silent state (Crochet et al. 2005). The frequency of miniatures is positively correlated with both of these factors (Prange and Murphy 1999); therefore, it should increase toward the end of a silent state (Timofeev et al. 2000a). Because excitatory synapses are much more numerous than inhibitory, increasing frequency of spontaneous release at all synapses is likely to shift its net balance toward excitation (Haider et al. 2006; Rudolph et al. 2007). This scenario is supported by the fact that some transitions from silence to activity during natural sleep (Fig. 8) or anesthesia (Figs. 9 and 10) indeed exhibited a slow buildup of depolarization with a large number of individual synaptic events discernible on its slope. The first spike occurs in deeply lying neurons when depth-positive field potential already started transition in depth negative direction but before sharp transition (Fig. 3). Therefore, it is possible that only a few neurons from deep layers started to depolarize at this time. According to cortical dipole generation theory (Niedermeyer and Lopes da Silva 2005), only a few neurons from layer V might be necessary to influence the generation of EEG events. Eventually, the depolarization induced by spontaneous release would reach the threshold, leading to generation of action potentials. In this scenario, any neuron could generate the first spike. This conclusion is supported by our results, showing that activity may originate first in any neuron (Figs. 5 and 7 and Fig. S2), and by the results of in vitro imaging study, demonstrating that activity could start from any neuronal group (Cossart et al. 2003). However, for statistical reasons, cells with the largest number of inputs, such as large layer 5 pyramids (DeFelipe and Farinas 1992), would have advantages in sensing and summating both spontaneous synaptic events and EPSPs from other, just activated, cells. Once large layer V pyramids are activated, their broad projections and the ability to generate bursts of action potentials, which increase their postsynaptic impact (Lisman 1997; Timofeev et al. 2000a), make them best suited for activation of other neurons (Sanchez-Vives and McCormick 2000; Timofeev et al. 2000a). These properties of large layer V pyramids might be especially important for integration of spontaneous and evoked synaptic potentials and activation of other cells in slices, where connectivity is severely reduced. This could be a likely reason why Sanchez-Vives and McCormick (2000) in their pioneer work on oscillations in slices found that large layer V pyramidal neurons were responsible for active state initiation.
A major role for large layer V pyramids and IB cells in the initiation and spread of active states in the network in vivo is supported by the tendency of these cells to show earlier onset of activity as compared with cells of other types and from other layers. This tendency was apparent in both multiunit recordings during natural sleep (Fig. 3) and in intracellular recordings under ketamine/xylaxine anesthesia (Figs. 4 and 11). However, our results also show that this leading role is due not to the intrinsic oscillations of layer V pyramids but rather to their ability to integrate spontaneous events effectively because of the large dendritic tree and huge excitatory convergence onto these cells.
Origin of Current Sinks and Sources during Slow Oscillation
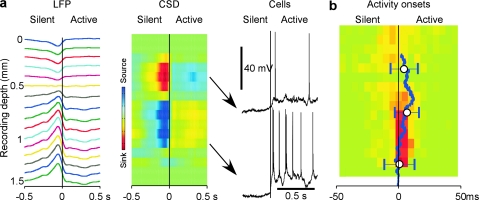
In the superficial and the deep layers, the LFP signal and the distribution of current sinks and sources are clearly different. At 600–700 μm from the surface, the polarity of the waves in the LFP is inversed (Niedermeyer and Lopes da Silva 2005), and also the picture of current sinks and sources is mirror-like: Strong superficial sinks and deep sources during silent states alternate with deep sinks and superficial sources during active states. In a marked contrast to the LFP, the intracellular recordings showed no phase reversal with the recording depth. In the neurons recorded simultaneously above and below 600 μm, slow membrane potential oscillations are always in-phase but never in contraphase one to the other (Fig. 5, 10, and 12a). Interestingly, despite the difference in the depth profile of polarity of slow waves in the LFP and in membrane potential of neurons, the delays in the onset of developed active states as determined using LFPs or intracellular recordings have similar depth profiles (Fig. 12b).
Figure 12.
Comparison of the depth profiles of field potential and intracellular events during slow oscillation. (a) Depth profile of the LFP, CSD, and intracellular activity during transition from silent to active state during natural slow-wave sleep. Arrows show approximate depth of the 2 neurons relative to the CSD profile (LFP and CSD plots are from Fig. 2). (b) Depth profile of the onsets of active states in the LFP (data from Fig. 1) and the running average of active state onsets in intracellularly recorded neurons (data from Fig. 6d2).
Thus, not all cells contributed equally to the macroscopic picture of slow waves. Contribution of a cell to the LFP signal depends on its electric asymmetry and on its ability to maintain differential charges of its compartments along axo-somato-dendritic axis (Niedermeyer and Lopes da Silva 2005). Large pyramidal neurons from deep layers, with their apical dendrites reaching the cortical surface, are well suited to produce electrical signals sensed by LFP electrodes (Niedermeyer and Lopes da Silva 2005). Due to the large electrotonic distance, the membrane potential at 2 compartments may differ by several millivolts (Schiller et al. 1997; Stuart et al. 1997) and thus cause significant current flow along the apical dendrites. Reversal of slow-wave polarity in the LFP depth profile comes then as natural consequence of differential location of recording electrode relative to the dipoles of large pyramids from deep layers.
Intracellular recordings showed that during silent states, somata of all cortical cells in all layers are hyperpolarized, and no action potentials are generated. However, spike-independent spontaneous transmitter release might still take place (Salin and Prince 1996; Paré et al. 1997; Timofeev et al. 2000a). Because at the dendrites the number of excitatory synapses is several-fold higher than of inhibitory, but at/close to soma inhibitory synapses prevail, the spontaneous input might lead to a depolarization of dendrites relative to the soma. High density of potassium channels may contribute further to the outward current at axosomatic compartment (Saganich et al. 2001; Pruss et al. 2005; Guan et al. 2006; Hu et al. 2007). Combination of these factors would produce net inward current at dendrites (extracellular current sink in upper layers) but net outward current at somatic region (extracellular current source in deep layers), as observed during silent states.
During active states, synaptic activity increases dramatically. Experimental data from cortical slices and computer simulations suggest that excitatory and inhibitory inputs to cortical cells are balanced (Destexhe et al. 2003; Shu et al. 2003), and in behaving animals, inhibition even dominates (Rudolph et al. 2007). The relative contribution of inhibition may be enhanced because inhibitory interneurons integrate the excitatory inputs more effectively (Markram et al. 2004; Povysheva et al. 2006; Cruikshank et al. 2007) and are capable of generating high-frequency nonadapting trains of action potentials, thus compensating for the smaller number of inhibitory synapses. As a result, strong excitatory and inhibitory inputs with inhibition dominating will produce in the dendrites high amplitude fluctuations, while changing little the mean level of dendritic membrane potential. In contrast, somatic membrane potential in layer V large pyramids during active states is depolarized by up to 15–20 mV relative to silent states, and cells generate axosomatic action potentials. Due to these factors, polarity of the somatodendritic dipole changes to the opposite: During active states, net inward current flows in the soma (extracellular sinks in deep layers) but net outward current through the dendrites (extracellular sources in superficial layers).
Conclusion: A Scenario for Active State Onset
Results of our study suggest that large pyramidal cells from deep layers play a central role in initiation and spread of active states during slow oscillation in vivo. Both LFP and intracellular recordings point to an earlier activation in deep layers, and both multiunit and intracellular recordings point to an earlier firing of cells located in layer V. This activation starts from the silent state, when no cells are firing. Because slow oscillation has a cortical origin, absence of cell firing during silent states restricts possible mechanisms of active state origin to spike-independent processes. The spike-independent process causes buildup of depolarization that occasionally reaches spike threshold in some cells. Firing of these cells initiates the activity in the rest of network. Spontaneous release necessary for active state initiation may occur not only from nerve terminals but also from glial cells surrounding synapses (Fellin et al. 2009). In contrast to earlier hypotheses, we suggest that activity does not necessarily originate in layer V cells. Due to the stochastic nature of spontaneous transmitter release, the first transition from silence to activity may occur in any neuron. However, because of the large number of synaptic inputs and the broad divergence of the outputs, large layer V pyramidal neurons are best suited for integration of spontaneous inputs and initiation of activity in the whole neocortical network.
Supplementary Material
Supplementary material can be found at: http://www.cercor.oxfordjournals.org/.
Funding
Canadian Institutes of Health Research (MOP-37862, MOP-67175); National Science and Engineering Research Council (grant 298475); National Institute of Neurological Disorders and Stroke (1R01NS060870-01) to I.T.; Bundesministerium für Bildung und Forschung (01GQ07112) and startups from University of Connecticut to M.V; Canadian Institutes of Health Research fellowship to S.C.; and Fonds de la Recherche en Santé du Québec Research Scholarship to I.T.
Supplementary Material
Acknowledgments
We are grateful to Michael Mukovski for the help with data processing, to Anton Sirota for advice on the CSD analysis, and to Marina Chistiakova for comments on early versions of the manuscript. Conflict of Interest: None declared.
References
- Blake H, Gerard RW. Brain potentials during sleep. Am J Physiol. 1937;119:692–703. [Google Scholar]
- Cash SS, Halgren E, Dehghani N, Rossetti AO, Thesen T, Wang C, Devinsky O, Kuzniecky R, Doyle W, Madsen JR, et al. The human K-complex represents an isolated cortical down-state. Science. 2009;324:1084–1087. doi: 10.1126/science.1169626. [DOI] [PMC free article] [PubMed] [Google Scholar]
- Chauvette S, Volgushev M, Mukovski M, Timofeev I. Local origin and long-range synchrony of active state in neocortex during slow oscillation. In: Timofeev I, editor. Mechanisms of spontaneous active states in the neocortex. Kerala (India): Research Signpost; 2007. pp. 73–92. [Google Scholar]
- Compte A, Sanchez-Vives MV, McCormick DA, Wang X-J. Cellular and network mechanisms of slow oscillatory activity (<1 Hz) and wave propagations in a cortical network model. J Neurophysiol. 2003;89:2707–2725. doi: 10.1152/jn.00845.2002. [DOI] [PubMed] [Google Scholar]
- Connors BW, Gutnick MJ. Intrinsic firing patterns of divers neocortical neurons. Trends Neurosci. 1990;13:99–104. doi: 10.1016/0166-2236(90)90185-d. [DOI] [PubMed] [Google Scholar]
- Contreras D, Steriade M. Cellular basis of EEG slow rhythms: a study of dynamic corticothalamic relationships. J Neurosci. 1995;15:604–622. doi: 10.1523/JNEUROSCI.15-01-00604.1995. [DOI] [PMC free article] [PubMed] [Google Scholar]
- Cossart R, Aronov D, Yuste R. Attractor dynamics of network UP states in the neocortex. Nature. 2003;423:283–288. doi: 10.1038/nature01614. [DOI] [PubMed] [Google Scholar]
- Crochet S, Chauvette S, Boucetta S, Timofeev I. Modulation of synaptic transmission in neocortex by network activities. Eur J Neurosci. 2005;21:1030–1044. doi: 10.1111/j.1460-9568.2005.03932.x. [DOI] [PubMed] [Google Scholar]
- Cruikshank SJ, Lewis TJ, Connors BW. Synaptic basis for intense thalamocortical activation of feedforward inhibitory cells in neocortex. Nat Neurosci. 2007;10:462–468. doi: 10.1038/nn1861. [DOI] [PubMed] [Google Scholar]
- Crunelli V, Hughes SW. The slow (<1 Hz) rhythm of non-REM sleep: a dialogue between three cardinal oscillators. Nat Neurosci. 2010;13:9–17. doi: 10.1038/nn.2445. [DOI] [PMC free article] [PubMed] [Google Scholar]
- DeFelipe J, Farinas I. The pyramidal neuron of the cerebral cortex: morphological and chemical characteristics of the synaptic inputs. Prog Neurobiol. 1992;39:563–607. doi: 10.1016/0301-0082(92)90015-7. [DOI] [PubMed] [Google Scholar]
- Destexhe A, Rudolph M, Pare D. The high-conductance state of neocortical neurons in vivo. Nat Rev Neurosci. 2003;4:739–751. doi: 10.1038/nrn1198. [DOI] [PubMed] [Google Scholar]
- Diesmann M, Gewaltig MO, Aertsen A. Stable propagation of synchronous spiking in cortical neural networks. Nature. 1999;402:529–533. doi: 10.1038/990101. [DOI] [PubMed] [Google Scholar]
- Fellin T, Halassa MM, Terunuma M, Succol F, Takano H, Frank M, Moss SJ, Haydon PG. Endogenous nonneuronal modulators of synaptic transmission control cortical slow oscillations in vivo. Proc Natl Acad Sci U S A. 2009;106:15037–15042. doi: 10.1073/pnas.0906419106. [DOI] [PMC free article] [PubMed] [Google Scholar]
- Fleidervish IA, Gutnick MJ. Kinetics of slow inactivation of persistent sodium current in layer V neurons of mouse neocortical slices. J Neurophysiol. 1996;76:2125–2130. doi: 10.1152/jn.1996.76.3.2125. [DOI] [PubMed] [Google Scholar]
- Gray CM, McCormick DA. Chattering cells: superficial pyramidal neurons contributing to the generation of synchronous oscillations in the visual cortex. Science. 1996;274:109–113. doi: 10.1126/science.274.5284.109. [DOI] [PubMed] [Google Scholar]
- Greenberg DS, Houweling AR, Kerr JND. Population imaging of ongoing neuronal activity in the visual cortex of awake rats. Nat Neurosci. 2008;11:749–751. doi: 10.1038/nn.2140. [DOI] [PubMed] [Google Scholar]
- Guan D, Lee JCF, Tkatch T, Surmeier DJ, Armstrong WE, Foehring RC. Expression and biophysical properties of Kv1 channels in supragranular neocortical pyramidal neurones. J Physiol (Lond) 2006;571:371–389. doi: 10.1113/jphysiol.2005.097006. [DOI] [PMC free article] [PubMed] [Google Scholar]
- Haider B, Duque A, Hasenstaub AR, McCormick DA. Neocortical network activity in vivo is generated through a dynamic balance of excitation and inhibition. J Neurosci. 2006;26:4535–4545. doi: 10.1523/JNEUROSCI.5297-05.2006. [DOI] [PMC free article] [PubMed] [Google Scholar]
- Hasenstaub A, Sachdev RNS, McCormick DA. State changes rapidly modulate cortical neuronal responsiveness. J Neurosci. 2007;27:9607–9622. doi: 10.1523/JNEUROSCI.2184-07.2007. [DOI] [PMC free article] [PubMed] [Google Scholar]
- Hassler R, Muhs-Clement K. Architektonischer Aufbau des sensomotorischen und parietalen Cortex der Katze. J Hirnforschung. 1964;6:377–422. [PubMed] [Google Scholar]
- Hu H, Vervaeke K, Storm JF. M-channels (Kv7/KCNQ channels) that regulate synaptic integration, excitability, and spike pattern of CA1 pyramidal cells are located in the perisomatic region. J Neurosci. 2007;27:1853–1867. doi: 10.1523/JNEUROSCI.4463-06.2007. [DOI] [PMC free article] [PubMed] [Google Scholar]
- Hughes SW, Cope DW, Blethyn KL, Crunelli V. Cellular mechanisms of the slow (<1 Hz) oscillation in thalamocortical neurons in vitro. Neuron. 2002;33:947–958. doi: 10.1016/s0896-6273(02)00623-2. [DOI] [PubMed] [Google Scholar]
- Lisman JE. Bursts as a unit of neural information: making unreliable synapses reliable. Trends Neurosci. 1997;20:38–43. doi: 10.1016/S0166-2236(96)10070-9. [DOI] [PubMed] [Google Scholar]
- Llinás RR. The intrinsic electrophysiological properties of mammalian neurons: insights into central nervous system function. Science. 1988;242:1654–1664. doi: 10.1126/science.3059497. [DOI] [PubMed] [Google Scholar]
- Luczak A, Bartho P, Marguet SL, Buzsaki G, Harris KD. Sequential structure of neocortical spontaneous activity in vivo. Proc Natl Acad Sci U S A. 2007;104:347–352. doi: 10.1073/pnas.0605643104. [DOI] [PMC free article] [PubMed] [Google Scholar]
- Mahon S, Vautrelle N, Pezard L, Slaght SJ, Deniau J-M, Chouvet G, Charpier S. Distinct patterns of striatal medium spiny neuron activity during the natural sleep-wake cycle. J Neurosci. 2006;26:12587–12595. doi: 10.1523/JNEUROSCI.3987-06.2006. [DOI] [PMC free article] [PubMed] [Google Scholar]
- Markram H, Toledo-Rodriguez M, Wang Y, Gupta A, Silberberg G, Wu C. Interneurons of the neocortical inhibitory system. Nat Rev Neurosci. 2004;5:793–807. doi: 10.1038/nrn1519. [DOI] [PubMed] [Google Scholar]
- Marsalek P, Koch C, Maunsell J. On the relationship between synaptic input and spike output jitter in individual neurons. Proc Natl Acad Sci U S A. 1997;94:735–740. doi: 10.1073/pnas.94.2.735. [DOI] [PMC free article] [PubMed] [Google Scholar]
- Massimini M, Amzica F. Extracellular calcium fluctuations and intracellular potentials in the cortex during the slow sleep oscillation. J Neurophysiol. 2001;85:1346–1350. doi: 10.1152/jn.2001.85.3.1346. [DOI] [PubMed] [Google Scholar]
- Massimini M, Huber R, Ferrarelli F, Hill S, Tononi G. The sleep slow oscillation as a traveling wave. J Neurosci. 2004;24:6862–6870. doi: 10.1523/JNEUROSCI.1318-04.2004. [DOI] [PMC free article] [PubMed] [Google Scholar]
- McCormick DA, Pape HC. Properties of a hyperpolarization-activated cation current and its role in rhythmic oscillation in thalamic relay neurons. J Physiol. 1990;431:291–318. doi: 10.1113/jphysiol.1990.sp018331. [DOI] [PMC free article] [PubMed] [Google Scholar]
- Mitzdorf U. Current source-density method and application in cat cerebral cortex: investigation of evoked potentials and EEG phenomena. Physiol Rev. 1985;65:37–100. doi: 10.1152/physrev.1985.65.1.37. [DOI] [PubMed] [Google Scholar]
- Mitzdorf U, Singer W. Prominent excitatory pathways in the cat visual cortex (A 17 and A 18): a current source density analysis of electrically evoked potentials. Exp Brain Res. 1978;33:371–394. doi: 10.1007/BF00235560. [DOI] [PubMed] [Google Scholar]
- Mukovski M, Chauvette S, Timofeev I, Volgushev M. Detection of active and silent states in neocortical neurons from the field potential signal during slow-wave sleep. Cereb Cortex. 2007;17:400–414. doi: 10.1093/cercor/bhj157. [DOI] [PubMed] [Google Scholar]
- Nicholson C, Freeman JA. Theory of current source-density analysis and determination of conductivity tensor for anuran cerebellum. J Neurophysiol. 1975;38:356–368. doi: 10.1152/jn.1975.38.2.356. [DOI] [PubMed] [Google Scholar]
- Niedermeyer E, Lopes da Silva F. Electroencephalography: basic principles, clinical applications and related fields. Philadelphia (PA): Lippincott Williams & Wilkins; 2005. p. 1309. [Google Scholar]
- Paré D, Lebel E, Lang EJ. Differential impact of miniature synaptic potentials on the soma and dendrites of pyramidal neurons in vivo. J Neurophysiol. 1997;78:1735–1739. doi: 10.1152/jn.1997.78.3.1735. [DOI] [PubMed] [Google Scholar]
- Pedroarena C, Llinás R. Dendritic calcium conductances generate high-frequency oscillation in thalamocortical neurons. Proc Natl Acad Sci U S A. 1997;94:724–728. doi: 10.1073/pnas.94.2.724. [DOI] [PMC free article] [PubMed] [Google Scholar]
- Povysheva NV, Gonzalez-Burgos G, Zaitsev AV, Kroner S, Barrionuevo G, Lewis DA, Krimer LS. Properties of excitatory synaptic responses in fast-spiking interneurons and pyramidal cells from monkey and rat prefrontal cortex. Cereb Cortex. 2006;16:541–552. doi: 10.1093/cercor/bhj002. [DOI] [PubMed] [Google Scholar]
- Prange O, Murphy TH. Correlation of miniature synaptic activity and evoked release probability in cultures of cortical neurons. J Neurosci. 1999;19:6427–6438. doi: 10.1523/JNEUROSCI.19-15-06427.1999. [DOI] [PMC free article] [PubMed] [Google Scholar]
- Pruss H, Derst C, Lommel R, Veh RW. Differential distribution of individual subunits of strongly inwardly rectifying potassium channels (Kir2 family) in rat brain. Mol Brain Res. 2005;139:63–79. doi: 10.1016/j.molbrainres.2005.05.006. [DOI] [PubMed] [Google Scholar]
- Rudolph M, Pospischil M, Timofeev I, Destexhe A. Inhibition determines membrane potential dynamics and controls action potential generation in awake and sleeping cat cortex. J Neurosci. 2007;27:5280–5290. doi: 10.1523/JNEUROSCI.4652-06.2007. [DOI] [PMC free article] [PubMed] [Google Scholar]
- Saganich MJ, Machado E, Rudy B. Differential expression of genes encoding subthreshold-operating voltage-gated K+ channels in brain. J Neurosci. 2001;21:4609–4624. doi: 10.1523/JNEUROSCI.21-13-04609.2001. [DOI] [PMC free article] [PubMed] [Google Scholar]
- Sakata S, Harris KD. Laminar structure of spontaneous and sensory-evoked population activity in auditory cortex. Neuron. 2009;64:404–418. doi: 10.1016/j.neuron.2009.09.020. [DOI] [PMC free article] [PubMed] [Google Scholar]
- Salin PA, Prince DA. Spontaneous GABAA receptor-mediated inhibitory currents in adult rat somatosensory cortex. J Neurophysiol. 1996;75:1573–1588. doi: 10.1152/jn.1996.75.4.1573. [DOI] [PubMed] [Google Scholar]
- Sanchez-Vives MV, Descalzo VF, Reig R, Figueroa NA, Compte A, Gallego R. Rhythmic spontaneous activity in the piriform cortex. Cereb Cortex. 2008;18:1179–1192. doi: 10.1093/cercor/bhm152. [DOI] [PubMed] [Google Scholar]
- Sanchez-Vives MV, McCormick DA. Cellular and network mechanisms of rhythmic recurrent activity in neocortex. Nat Neurosci. 2000;3:1027–1034. doi: 10.1038/79848. [DOI] [PubMed] [Google Scholar]
- Schiller J, Schiller Y, Stuart G, Sakmann B. Calcium action potentials restricted to distal apical dendrites of rat neocortical pyramidal neurons. J Physiol. 1997;505(Pt 3):605–616. doi: 10.1111/j.1469-7793.1997.605ba.x. [DOI] [PMC free article] [PubMed] [Google Scholar]
- Shu Y, Hasenstaub A, McCormick DA. Turning on and off recurrent balanced cortical activity. Nature. 2003;423:288–293. doi: 10.1038/nature01616. [DOI] [PubMed] [Google Scholar]
- Steriade M. Neocortical cell classes are flexible entities. Nat Rev Neurosci. 2004;5:121–134. doi: 10.1038/nrn1325. [DOI] [PubMed] [Google Scholar]
- Steriade M, Nuñez A, Amzica F. A novel slow (<1 Hz) oscillation of neocortical neurons in vivo: depolarizing and hyperpolarizing components. J Neurosci. 1993a;13:3252–3265. doi: 10.1523/JNEUROSCI.13-08-03252.1993. [DOI] [PMC free article] [PubMed] [Google Scholar]
- Steriade M, Nuñez A, Amzica F. Intracellular analysis of relations between the slow (<1 Hz) neocortical oscillations and other sleep rhythms of electroencephalogram. J Neurosci. 1993b;13:3266–3283. doi: 10.1523/JNEUROSCI.13-08-03266.1993. [DOI] [PMC free article] [PubMed] [Google Scholar]
- Steriade M, Contreras D, Dossi RC, Nuñez A. The slow (<1 Hz) oscillation in reticular thalamic and thalamo-cortical neurons: scenario of sleep rhythm generation in interacting thalamic and neocortical networks. J Neurosci. 1993c;13:3284–3299. doi: 10.1523/JNEUROSCI.13-08-03284.1993. [DOI] [PMC free article] [PubMed] [Google Scholar]
- Steriade M, Timofeev I, Durmuller N, Grenier F. Dynamic properties of corticothalamic neurons and local cortical interneurons generating fast rhythmic (30–40 Hz) spike bursts. J Neurophysiol. 1998;79:483–490. doi: 10.1152/jn.1998.79.1.483. [DOI] [PubMed] [Google Scholar]
- Steriade M, Timofeev I, Grenier F. Natural waking and sleep states: a view from inside neocortical neurons. J Neurophysiol. 2001;85:1969–1985. doi: 10.1152/jn.2001.85.5.1969. [DOI] [PubMed] [Google Scholar]
- Stuart G, Schiller J, Sakmann B. Action potential initiation and propagation in rat neocortical pyramidal neurons. J Physiol. 1997;505(Pt 3):617–632. doi: 10.1111/j.1469-7793.1997.617ba.x. [DOI] [PMC free article] [PubMed] [Google Scholar]
- Timofeev I, Grenier F, Bazhenov M, Sejnowski TJ, Steriade M. Origin of slow cortical oscillations in deafferented cortical slabs. Cereb Cortex. 2000a;10:1185–1199. doi: 10.1093/cercor/10.12.1185. [DOI] [PubMed] [Google Scholar]
- Timofeev I, Grenier F, Steriade M. Impact of intrinsic properties and synaptic factors on the activity of neocortical networks in vivo. J Physiol (Paris) 2000b;94:343–355. doi: 10.1016/s0928-4257(00)01097-4. [DOI] [PubMed] [Google Scholar]
- Timofeev I, Grenier F, Steriade M. Disfacilitation and active inhibition in the neocortex during the natural sleep-wake cycle: an intracellular study. Proc Natl Acad Sci U S A. 2001;98:1924–1929. doi: 10.1073/pnas.041430398. [DOI] [PMC free article] [PubMed] [Google Scholar]
- Timofeev I, Steriade M. Low-frequency rhythms in the thalamus of intact-cortex and decorticated cats. J Neurophysiol. 1996;76:4152–4168. doi: 10.1152/jn.1996.76.6.4152. [DOI] [PubMed] [Google Scholar]
- Volgushev M, Chauvette S, Mukovski M, Timofeev I. Precise long-range synchronization of activity and silence in neocortical neurons during slow-wave sleep. J Neurosci. 2006;26:5665–5672. doi: 10.1523/JNEUROSCI.0279-06.2006. [DOI] [PMC free article] [PubMed] [Google Scholar]
- Wang Y, Markram H, Goodman PH, Berger TK, Ma J, Goldman-Rakic PS. Heterogeneity in the pyramidal network of the medial prefrontal cortex. Nat Neurosci. 2006;9:534–542. doi: 10.1038/nn1670. [DOI] [PubMed] [Google Scholar]
- Waters J, Helmchen F. Background synaptic activity is sparse in neocortex. J Neurosci. 2006;26:8267–8277. doi: 10.1523/JNEUROSCI.2152-06.2006. [DOI] [PMC free article] [PubMed] [Google Scholar]
- Zhu L, Blethyn KL, Cope DW, Tsomaia V, Crunelli V, Hughes SW. Nucleus- and species-specific properties of the slow (<1 Hz) sleep oscillation in thalamocortical neurons. Neuroscience. 2006;141:621–636. doi: 10.1016/j.neuroscience.2006.04.069. [DOI] [PMC free article] [PubMed] [Google Scholar]
Associated Data
This section collects any data citations, data availability statements, or supplementary materials included in this article.


