

Abstract
Optical recording techniques were applied to the turtle cerebellum to localize synchronous responses to microstimulation of its cortical layers and reveal the cerebellum's three-dimensional processing. The in vitro yet intact cerebellum was first immersed in voltage–sensitive dye and its responses while intact were compared to those measured in thick cerebellar slices. Each slice is stained throughout its depth, even though the pial half appeared darker during epi-illumination and lighter during trans-illumination. Optical responses were shown to be mediated by the voltage–sensitive dye because the evoked signals had opposite polarity for 540- and 710-nm light, but no response to 850-nm light.
Molecular layer stimulation of the intact cerebellum evoked slow transverse beams. Similar beams were observed in the molecular layer of thick transverse slices but not sagittal slices. With low currents, beams in transverse slices were restricted to sublayers within the molecular layer, conducting slowly away from the stimulus site. These excitatory beams were observed nearly all the way across the turtle cerebellum, distances of 4-6 mm. Microstimulation of the granule cell layer of both transverse or sagittal slices either evoked a local membrane depolarization restricted to a radial wedge, but these radial responses did not activate measurable molecular layer beams in transverse slices.
White matter microstimulation in sagittal slices (near the ventricular surface of the turtle cerebellum) activated the granule cell and Purkinje cell layers, but not the molecular layer. These responses were nearly synchronous, were primarily caudal to the stimulation, and were blocked by cobalt ions. Therefore, synaptic responses in all cerebellar layers contribute to optical signals recorded in intact cerebellum in vitro (Brown and Ariel, 2009). Rapid radial signaling connects a sagittally-oriented, fast-conduction system of the deep layers with the transverse-oriented, slow-conducting molecular layer, thereby permitting complex temporal processing between two tangential but orthogonal paths in the cerebellar cortex.
Keywords: Synchrony, Climbing Fibers, Purkinje Cells, Parallel Fibers
1. Introduction
Some signals within the cerebellar cortex (Cb) are synchronized (Blenkinsop and Lang, 2006; Shin et al., 2006) to enable accurate neural computations necessary to coordinate complex behaviors (Llinas, 2009; Yarom and Cohen, 2002). However, the conduction of synchronous messages is difficult to reveal within the Cb's different planes and layers. Information from mossy fiber (MF) inputs travel in a radial plane up towards the pial surface via ascending axons (AA) of the granule cells (GC). Those axons in turn then branch orthogonally in the transverse plane to form parallel fibers (PF) which travel several millimeters. Those fibers then synapse on Purkinje cells (PC) whose dendrites in the molecular layer (ML) are oriented orthogonally in the sagittal plane and receive strong excitation from climbing fibers (CF) aligned in that sagittal plane. Additionally, in some species including turtles, the CF and MF in the underlying white matter (WM) travel roughly the sagittal plane from the peduncle in the rostral Cb.
To study the topography of Cb activation, optical recordings were previously made of the intact Cb (Cohen and Yarom, 1999; Coutinho et al., 2004; Ebner et al., 2005; Knopfel et al., 2009). However, these studies lack information on the laminar localization of the response conduction (Konnerth et al., 1987). It is not known if sagittal response bands is localized in specific Cb layers or if responses to climbing fibers are limited to deeper sublayers within the molecular layer while responses of parallel fibers are only found in the outer sublayers, as some anatomy suggests (Hillman, 1969; Kunzle, 1985)? To localize responses to different Cb layers, the turtle was selected because its Cb in not foliated and can be studied when that tissue is intact (Chan et al., 1988) or sliced within a single transverse or sagittal plane (Chan et al., 1989).
Previous studies using microelectrode recordings in the highly foliated mammalian cerebellar cortex indicated that synchronized complex spikes were found in narrow sagittal bands of Cb (Lang, 2001; Sugihara et al., 1993). Local mossy fiber input activates a circular region called a ‘patch’ (Cohen and Yarom, 1998), though activation of a patch is relatively ineffective in propagating laterally along the parallel fibers (Bower and Devor, 2003; Rokni et al., 2007). By contrast, stimulation of many adjacent parallel fibers within the molecular layer evokes a ‘beam’ along the transverse plane (Eccles et al., 1966); (Cohen and Yarom, 1999; Diez-Garcia et al., 2007; Dunbar et al., 2004; Elias et al., 1993). In addition, a sagittal band of activation is evoked by stimulation of climbing fiber inputs from the inferior olivary nucleus (Chen et al., 1996; Gao et al., 2006; Rokni et al., 2007; Sasaki et al., 1989).
A previous report of optical recordings of transverse skate Cb slices reported that evoked signals were only observed in the molecular layer which spread slowly from the stimulation site, having its latency increase with distance (Konnerth et al., 1987). Here, using optical recordings of turtle Cb slices, we also demonstrate a slow parallel fiber beam that activates tissue within the turtle cerebellum's molecular layer. Rapid radial patches of activity were also observed by granule cell layer stimulation. Finally, using sagittal slices, a large band of synchronized, asymmetric activation in the Purkinje and granule cell layers was observed during white matter stimulation. Although synchronization has been observed in Purkinje cell responses to climbing fibers (Sugihara et al., 1993), these results indicate that cerebellar response synchronization also exists in the granule cell layer, suggesting that arrival of mossy fiber signals may facilitate accurate control of motor function by the cerebellum.
2. Results
2.1 Cellular Source of Optical Signal
Previous optical recordings in the intact Cb demonstrate that optical responses have different topographies that depend on the site of microstimulation (for details, see Brown and Ariel, 2009). Figure 1E shows an example of response topography recorded using an intact stained Cb. From the data of the intact Cb recordings, two ellipses were drawn on the image of the Cb showing the best computer fit of the optical response field due to electrical stimulation of the molecular layer (pink) or the white matter (blue) on the ventricular surface (for details, see Brown and Ariel, 2009). Therefore, thick slices of Cb were cut in two planes, from intact stained Cb, transverse and sagittal.
Figure 1.
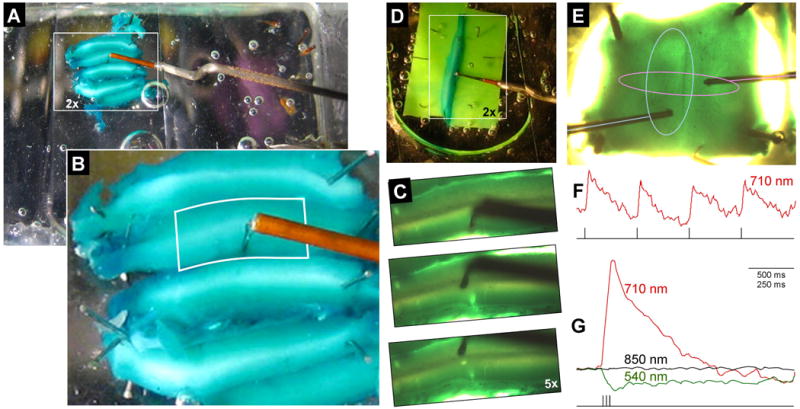
Turtle cerebellar slices stained with voltage-sensitive dye and fixed in the recording chamber. A,B) photographs during ambient fluorescent room illumination by a camera in the front of the microscope directed toward the microscope stage. The oxygenated media enters from the hypodermic needle at the lower right in A, passes over the tissue and then is aspirated from the back compartment of the chamber (not shown). For optical clarity, the slices are covered with a rectangle of cover slip glass. The depth of the slices were ∼800 μm, measured from the pia to its ventricular surface. A) Many adjacent slices were affixed to the clear Sylgard floor of the chamber using stainless steel pins. To access the tissue, the shank of a bipolar stimulating electrode is repeatedly bent at right angles to avoid touching the cover glass, the chamber walls, and the microscope objective. A white box demarcates the area that can be recorded using a 2× microscope objective. B) Enlarged view of inset in A. The outlined region shows an area recorded using a 5× microscope objective. C) Slices, now transilluminated by the microscope's tungsten-halogen bulb and photographed by the microscope's camera, results in a different tissue hue for the same tissue in A,B. The top image shows an electrode tip placed in molecular layer. The electrode tip is subsequently placed in the Purkinje cell layer (middle panel) and the granule cell layer (bottom panel), leaving a visible hole of its previous insertions. D) In some experiments, tissue was stabilized without pins by squeezing one Cb slice between two pieces of green Sylgard. E) Photograph of an intact stained turtle Cb pinned in each corner to the Sylgard floor of the recording chamber and transilluminated by the microscope condenser. The two cut peduncles are in the lower (rostral) left and right corners. In this ventricular view, the thin vertical sulcus is the midline raphe and two bipolar stimulating electrodes can be seen on each side. Optical recordings of left electrode microstimulation (light blue line) of the white matter elicited a sagittal response field (light blue ellipse). Microstimulation of the right electrode (pink line) whose tip was in the molecular layer evoked a thinner transverse beam (pink ellipse). Stimulation consisted of single 100 μs, 100 μA current pulses using 710-nm illumination. This tissue was late sliced to show layered staining (see Fig. 2 D,E). F) Optical responses during illumination of 710-nm light of a single diode to single pulses (using a Cb prepared similar to E). G) Average traces of 5 responses to a train of 3 stimuli. Three traces, evoked during three wavelengths of trans-illumination, are superimposed. The strength and change in polarity of the 710- and 540-nm responses are consistent with the spectral response of RH482 dye. The lack of 850-nm responses indicates that there is no contribution to the optical response by an intrinsic tissue signal due to this microstimulation. All subsequent figures display the relative changes in absorbance, only using 710-nm light with an upward deflections representing membrane depolarizations.
Before investigating response topography in Cb slices, the source of the optical signals were verified to relate to rapid membrane voltage changes to local microstimulation (Fig. 1F, four individual 75 μA, 100 μs current pulses to the molecular layer, see stimulus trace below). This trace exhibits clear transient depolarizations recorded with millisecond resolution (equivalent to increases in absorbance of narrow-band red light). Stronger responses were evoked by brief three-pulse trains and their responses were averaged and superimposed for identical stimulation for which the transilluminating light path was interrupted with a different interference filters (Fig. 1G). Based on the voltage sensitivity of RH482 (Momose-Sato et al., 1999), the dye absorbance increases in red light, decreased in green light and is insensitive to infrared light. Transilluminating with 710-nm ± 35nm light (displayed as a red line) resulted in the equivalent to a strong rapid membrane depolarization, while transilluminating with the 540 ± 20 nm interference filter (displayed as a green line) evoked a response with the same time course but inverted polarity. Responses during 850 ± 75 nm light (displayed as a black LINE on Fig. 1G) was absent. These results support the expectation that these evoked optical signals result from voltage-sensitive dye changes within the Cb neuronal membrane. If these signals were due to intrinsic signals of optical dispersion, a response should have been observed because 850 nm light is still sensed the photodiodes in the array.
2.2 Layer Identification of the Stained Cb Slice
To localize stimulation and recording to specific Cb layers of the thick Cb slices, it was necessary to identify the layers using transilluminated white light. Initially, it was not obvious which half of the slice was the granule cell layer (GCL) and which was the molecular layer (ML). According to the lipophilic properties of the dye and the abundance of synaptic membrane in ML, one would expect that RH482 would preferentially accumulate in ML, resulting in a darker blue-green appearance. However, in the transilluminated recording chamber, we noted that one side had a blue-green tint, while the opposite side was darker (Fig. 2E). Therefore, before recording optical signals from slices, it was necessary to learn to identify the pia and WM of each Cb slice.
Figure 2.
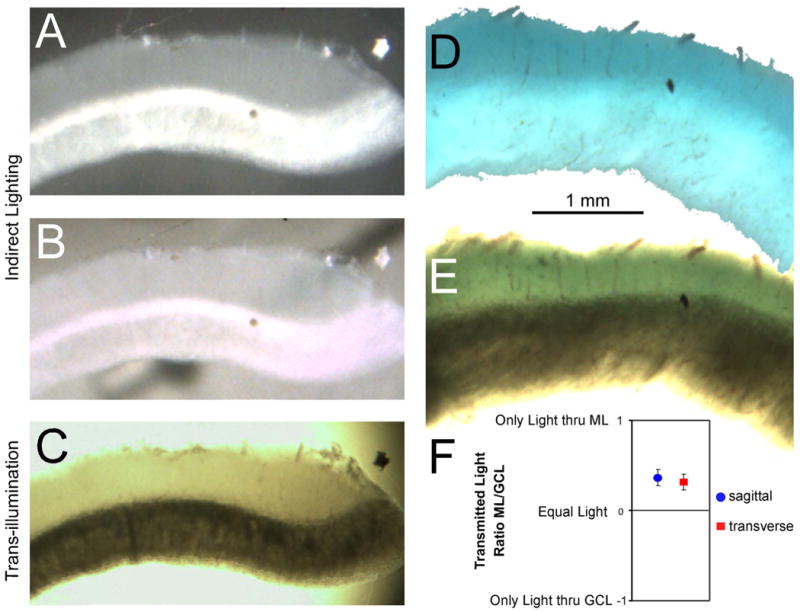
Layer analysis of light transmission and dye staining of Cb slices (molecular layer up, focused by the 5× objective). A-C) Photographs of an identical transverse unstained Cb slice under different illumination conditions: A) unstained slice placed on a black background, photographed using indirect white light, B) unstained slice placed on a white background, photographed using indirect white light, C) unstained slice trans-illuminated by the microscope condenser. In B, note that molecular layer is translucent because an oblique thin black object below the slice darkens the slice at that level. Although this slice is unstained, the granule cell layer caused greater light scattered, making it darker when transilluminated and light during indirect lighting. In this example, the Purkinje cell layer exhibited the same phenomena. D,E) Photographs of other transverse slices from a Cb that was stained for an hour prior to slicing: D) stained slice placed on a white background, photographed using indirect white light, E) stained slice trans-illuminated by the microscope condenser. This slice was cut obliquely to show wider Cb layers. Even though the molecular layer is more darkly stained than the granule cell layer (D), the granule cell layer of the trans-illuminated slice appears darker (E). All these tissues were lightly fixed prior to slicing 250 μm sections. F) Graph showing the ratio of transmitted light through molecular and granule cell layers, from equal samples of 17 transverse and sagittal 500 – 1000 μm stained slices, as measured by the photodiode array during the optical recordings.
Cb layers were ultimately identified by viewed the slices under different illumination conditions. With unstained slices (Fig. 2A-C left column), it is clear that indirectly lit slices can have an opposite contrast compared to slices that are transilluminated. In addition, the Purkinje Cell Layer (PCL) was often apparent running along the middle of the slice. By carefully observing the slice orientation from the tissue chopper as it was placed on a glass slide under the microscope objective, we verified that the dark region observed during transillumination included the GCL and PCL. Based on this layering identification, we noted a more subtle feature that could always identify the lighter (molecular) layer: the presence of interspersed radial blood vessels. The dorsal surface is presumably the origin of those vessels because visible vasculature travels in the pia. In contrast, the ventricular surface is very avascular.
Similar layering phenomena also can be observed in Cb slices stained with voltage sensitive dye (Fig. 2D-E). With the optimal indirect lighting, the ML had a darker blue color than the GCL/PCL (Fig. 2D). However, during transillumination with white light, the relative difference in blue staining is obscured by the overall darkness of the tissue. This bias for a darker ML was quantified for a large sample of stained slices (Fig. 2F) based on the RLI recorded after each slice was placed in the recording chamber (see Experimental Procedure). The ratio of average intensity in the molecular and granule cell layers was computed such that slices with brighter MLs were values up to positive 1 and brighter GCLs were values down to negative 1. As seen in figure 2F, the average value were positive, both for slices cut in the transverse and sagittal planes.
The darkness of the GCL results presumably from the high density of small cell bodies, which scatter the transilluminated light more than the ML. This light scatter appears to be a static phenomenon because optical signals did not change during 850-nm light (Fig. 1G). That absence of an ‘inherent’ or ‘intrinsic’ signal indicates that light scatter, although prominent in the GCL, is not modulated by membrane voltage, even during synchronized membrane depolarization. Therefore, the responses of diodes within the array can be compared because the optical signals of each diode were normalizing by the resting light intensity (see Experimental Procedure).
2.3 Voltage-sensitive Dye Signals in Transverse Slices
Molecular layer stimulation in the intact Cb evokes a transverse beam that extends across the midline, nearly reaching both lateral edges of the Cb (Brown and Ariel, 2009). To examine this beam in Cb slices, optical signals were first measured in transverse sections at low magnification (Fig. 3A). A bipolar stimulating electrode was visually positioned into the lighter layer of the transilluminated tissue (Fig. 3B, bottom panel). Using a 2× microscope objective, the Cb was activated initially at the stimulation point (Fig. 3A, top panel, a pseudocolor response superimposed on a monochrome image of the Cb slice). Then the activation of the Cb spread far from the stimulation point in both directions towards both lateral edges of the Cb (Fig. 3A, bottom panel, recorded \35.2 ms after the stimulus pulse, measuring approximately 6 mm using the 2× objective).
Figure 3.
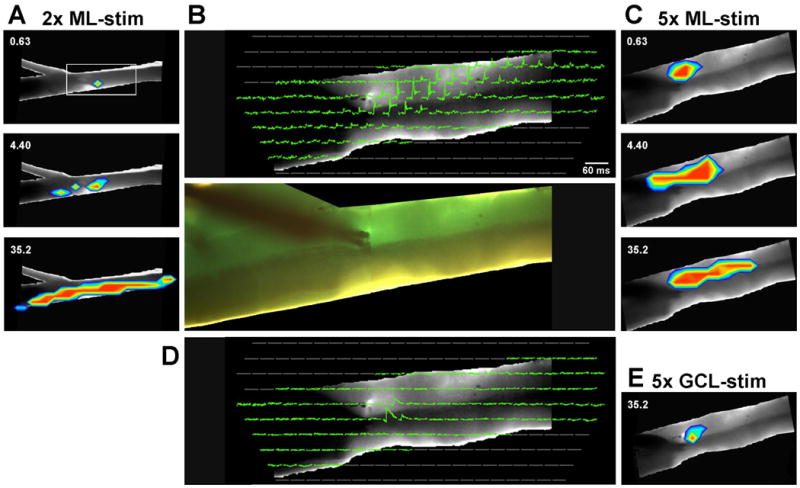
Optical signals measured in a transverse Cb slice. B) Traces from individual diodes show averaged optical responses to single current pulses (similar to Fig. 1). Only diodes that image the slice are displayed using a 5× microscope objective. In the top panel of B, traces are shown during microstimulation of the deep molecular layer, proximal to the Purkinje cell layer. The bottom panel of B shows the position of the tips of the bipolar stimulating electrode. Because 6 or more rows of diodes image the Cb depth, it was possible to display the response as a series of pseudocolor images forming a transverse excitatory beam adjacent to the Purkinje cells (three frames in C). The numbers in C indicate the post-stimulus time in ms. A) Using a 2× objective, a series of pseudocolor images show responses to the same microstimulation of the molecular layer as in B. At this magnification, only 2 diodes image the Cb depth, resulting in an inaccurate registration of the responses with the photograph; the excitation appears in the granule cell layer. However, using this magnification, it is clear that the transverse beam extends many millimeters in both directions. D) The stimulating electrode was moved into the granule cell layer, resulting in only a local region of optical responses. The individual diode traces are displayed as in the top panel in B. E) A pseudocolor image shows the extent of excitation 32.5 ms after microstimulation within the granule cell layer shown in D.
However, that lower magnification resulted in the measurement of the entire 1-mm depth of the Cb by only 2-3 diodes from pia to ventricular surface. Thus, using the 2× microscope objective, response localization within the Cb layers was often inaccurate (Fig. 3A). Therefore, ML microstimulation was repeated at the same location while recording through the 5× microscope objective. With this objective, the depth of the Cb is represented by 7-8 diodes, resulting in an accurate localization of the response to specific Cb layers (Fig. 3B,C). The response to this deep ML stimulation was a transverse beam in the deeper half of the ML. The remaining analysis and figures only use data recorded through the 5× objective, even though the total extent of lateral edge to lateral edge responses could not be measured. Responses using both objectives can also be compared in the video files for Fig. 3A and 3C in the Supplement.
Responses to ML microstimulation were next compared to that of identical microstimulation after the bipolar stimulating electrode was visually repositioned at or just below the Purkinje cell layer (Fig. 3D, E). The traces in the photodiode array show that only three diodes clearly responded (Fig. 3D), seen as a small patch of activation in the pseudocolor image (Fig. 3E; and video file in the Supplement). It appears that, relative to direct parallel fiber activation, stimulating a small number of PCs or adjacent ascending axons of granule cells is ineffective in evoking a lateral beam of activation.
The conduction velocity of the lateral beam was directly examined in a different example in figure 4. The bipolar stimulating electrode was placed in the middle of ML (Fig. 4A) resulting in the activation of diodes entirely within the ML (Fig. 4C). As with all traces shown in these figures, the amplitude of the diode responses were scaled to the absolute level of light reaching each diode (RLI; Fig. 4B) so that the traces are not dependent on local differences in staining or slice thickness. Comparing two distant points, separated by 2.8 cm along the parallel fiber beam (Fig. 4C-E), indicates that the timing difference of response onset was 14 ms. The conduction velocity is computed as 0.206 m/s, consistent with the average speed in the intact Cb (0.244 m/s, Brown and Ariel, 2009). A series of pseudocolor images shows that the sequence of activation is a clear function of distance from the stimulation (Fig. 4E and video files in the Supplement).
Figure 4.
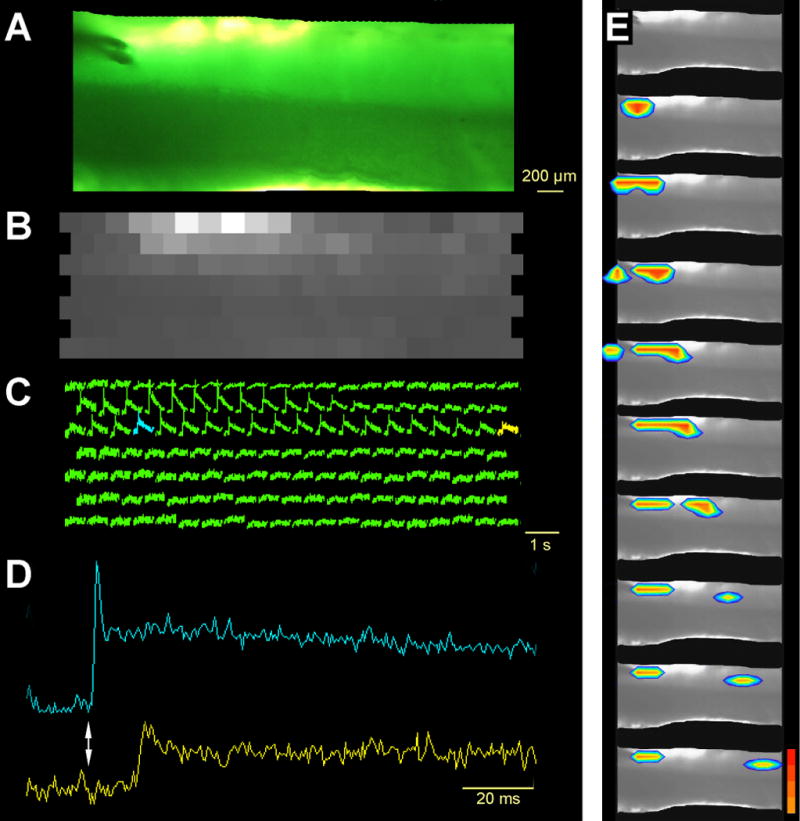
Optical signals measured in a transverse Cb slice in response to microstimulation of the shallow molecular layer close to the pia. A) Photograph of trans-illuminated slice focused by the 5× objective, showing the position of the tips of the bipolar stimulating electrode. B) The resting light levels (RLI) measured by the photodiodes prior to stimulation. Note that the granule cell layer is darker than the molecular layer during transillumination, as quantified in figure 2. The levels indicate the relative staining of the tissue and allow for the normalization of diode responses to be expressed as a relative change in optical signals, as shown in C. The blue and yellow traces in C were marked to identify the source for the expanded traces in D. The diode marked blue was adjacent to one of the bipolar electrode tips and responded immediately following the stimulation (vertical arrow). The diode marked yellow was 3.3 mm from the stimulation point and exhibited a clear 13 ms latency. E) A series of pseudocolor images demonstrate that the transverse excitatory beam is near the pia and travels slowly in both directions from the stimulation point.
2.4 Voltage-sensitive Dye Signals in Sagittal Slices
Identical optical recording experiments were repeated using slices cut in the sagittal plane. As with responses in transverse slices (Figs. 4D,E), microstimulation of the GCL evoked a small local patch of activation in sagittal slices (not shown). However, unlike in transverse slices, microstimulation of the ML also evoked a small local patch of activation, presumably because parallel fibers are cut short in the sagittal slices. The most surprising finding was observed during WM microstimulation on the ventricular surface. Like sagittal activation observed in the intact turtle Cb (Brown and Ariel, 2009), the response in the sagittal slice activated an extended region of cortex in the caudal Cb. However, the lamination pattern of the slice response revealed two components. First, there was a large response in the local radial column of the Cb cortex. More interesting, though, was the presence of a second component in an extended region of cortex in the caudal Cb within the granule cell layer and its adjacent Purkinje cell layer.
Figure 5 displays an example of a sagittal slice's response to WM stimulation on the ventricular surface (pink dot in Fig. 5A and 5C). The asymmetry of the conduction of the response from the stimulus point (trace 2 in Fig. 5A) can be observed in the rostral response (trace 1) and the caudal response (trace 3). Comparing these equidistant diodes, the caudal diode has a larger amplitude response. In addition, all the diodes in the caudal direction have nearly equal amplitude. Moreover, the caudal diodes have nearly identical timing (Fig. 5B and a video file in the Supplement). These synchronous responses are very different from the sequential activation evoked bidirectionally by ML stimulation using transverse Cb slices (Figs. 3 and 4).
Figure 5.
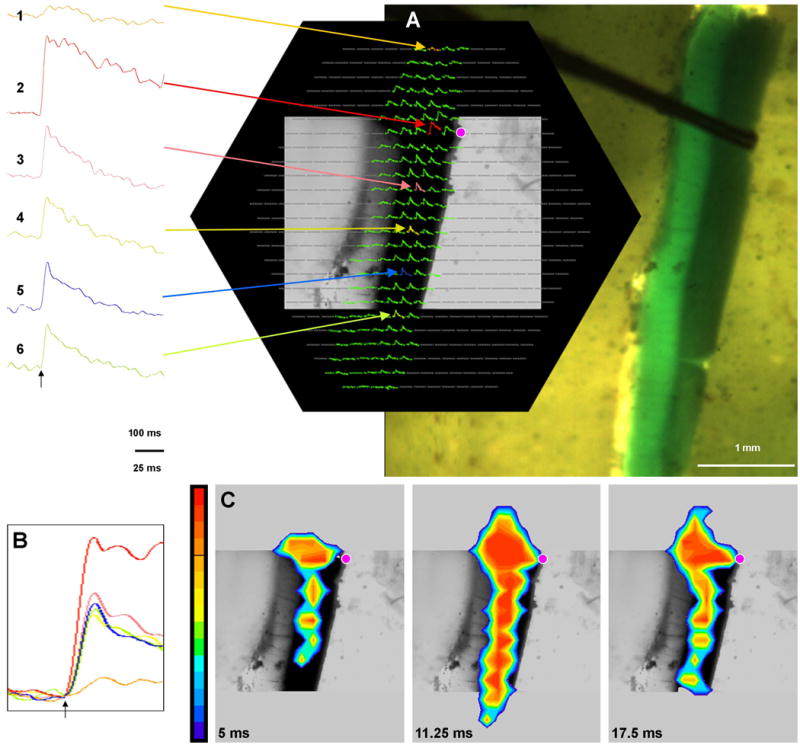
Optical signals measured in a sagittal Cb slice, sandwiched between two Sylgard slabs, in response to microstimulation of the white matter. A) Hexagonal 464-diode array, only displaying traces of diodes that image the slice using a 5× microscope objective. This hexagon overlies a 2× photograph of the slice with its pial surface on the left and its caudal side down. The position of the electrode tip can be seen in the white matter on the ventricular surface near the granule cell layer. This stimulation site is marked with a pink dot on the array. In the array, traces of six equally spaced diodes within the granule cell layer are shown in color, with corresponding magnified traces to the left. A black arrow below those magnified traces indicates the time of stimulation. Note that the response in the top trace (tan, 1-mm rostral to the stimulus) was much smaller than that of the bottom trace (light green, 2-mm caudal to the stimulus). Calibration bar = 100 ms. B) Those six traces are further magnified and superimposed in B. Note that the responses of these traces have a nearly simultaneous onset. Calibration bar = 25 ms. C) A series of pseudocolor images show that the response field encroaches locally into the molecular layer but otherwise is limited to the granule cell layer more than 2.5 mm in the caudal direction. Post-stimulus times are indicated for each frame.
2.5 Differences in Response Latency in Transverse and Sagittal Slices
Recordings from intact Cb indicate that ML microstimulation evoked a slowly traveling wave away from the stimulus point in both directions along the transverse plane (Fig. 1E, (Brown and Ariel, 2009). In contrast, WM microstimulation elicited a synchronized response in the sagittal plane. The onset latencies of optical responses from thick Cb slices were examined to compare to the timing of the intact tissue from specific Cb layers. Measurements were made with the same software and displayed using the same formats as those shown for the intact tissue (Brown and Ariel, 2009).
Examples of three timing measurements are show in Figure 6 and in three video files in the Supplement (A,B: transverse slice; C,D: sagittal slice; E,F: patch response). Next to the pseudocolor response of the transverse slice response is an inset of a grayscale latency map, showing that the latency was shortest at the point of ML stimulation (pink dot) and became gradually longer in both directions (diodes with the longest latencies are black; a zero latency response are white). This relationship between distance and latency is quantified in figure 6B, showing a slope that represents a conduction velocity 0.184 m/sec. The grayscale latency map for the sagittal slice response indicates that the response latency did not vary as a function of the distance from the stimulus site (Fig. 6C). Likewise, the latency-distance plot did not reveal a significant slope of its regression line (p > 0.01; Fig. 6D). Similarly, the example showing a response to stimulation in the GCL (Fig. 6E) has a latency that appears nearly synchronous. The extent of the response field of this patch example was large enough to allow for an analysis of a possible latency distance relationship, indicating that there was no significant slope of its regression line (p > 0.01; Fig. 6F).
Figure 6.
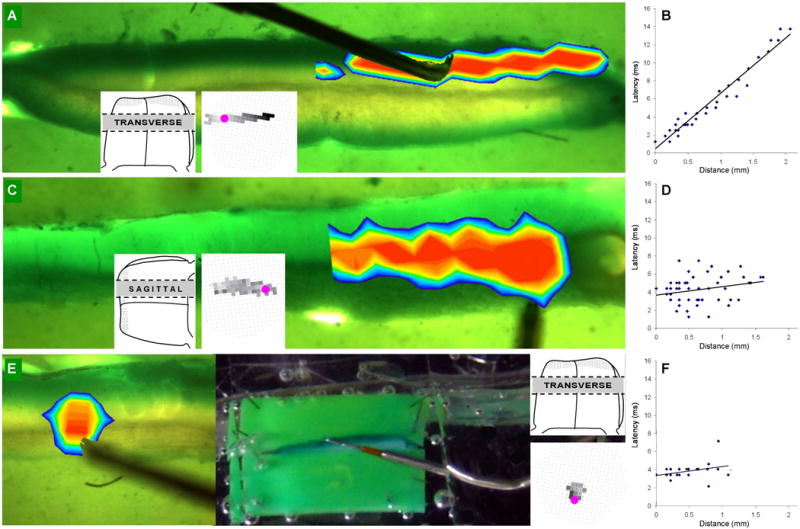
Examples of optical responses, comparing their lamination and response latency of Cb slices sandwiched between two Sylgard slabs. A) The bidirectional response in the molecular layer is observed in the pseudocolor image superimposed on its transverse slice. The inset shows its grayscale latency map indicating that diodes further from the stimulus site had longer response latencies (see Experimental Procedure). B) A latency-distance plot, based on data from the transverse slice in A, of the response latencies and distances of the responsive diodes from the stimulus site (see Experimental Procedure). These data were fitted to a line by least squares regression and show a clear increase in latency as a function of distance. C) Using a sagittal slice, the response field was unidirectional in the granule cell and Purkinje cell layers caudal to the stimulus site. The inset shows its grayscale latency map which has no trend of changing response latencies. D) A latency-distance plot of the data shown in C, shows a flat regression line that was not statically significant (p > 0.01) in this sagittal slice. E) The pseudocolor image shows the response field for stimulation in the granule cell layer. The response travels a very limited distance into the overlying molecular layer. F) A latency-distance plot from data in E shows a synchronous response in the small patch of responses.
The response timing following ML stimulation of transverse slices, WM stimulation of sagittal slices and GCL stimulation in any Cb slice is quantified in Figure 7. On average, the conduction velocity in the ML of the turtle transverse Cb slice was 0.235 m/s (Fig. 7A, red line), a value consistent with that measured in the intact Cb (0.244 m/s, Brown and Ariel). On the other hand, the red lines representing the average slope of the latency-distance plot were not statistically significant (p > 0.01), indicating that conduction velocities could not be measured for optical signals emanating from the stimulus sites in WM and GCL.
Figure 7.
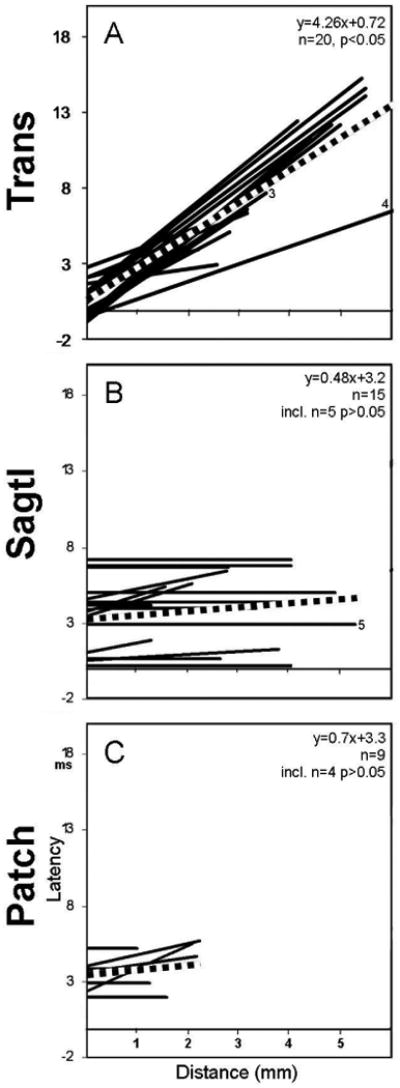
Latency-distance plots of the sample of three stimulus sites. The three rows correspond to the three rows of figure 6: A) Top row shows regression lines of 20 latency-distance plots from molecular layer stimulation of transverse slices. B) Middle row shows regression lines of 15 latency-distance plots during white matter stimulations of sagittal slices. C) Bottom row shows regression lines of 9 latency-distance plots during granule cell layer stimulation of transverse slices. The numbers 3-5 indicate specific regression lines derived from data used in figures 3-5, respectively.
It is possible that responses observed during the WM and GCL stimulation resulted from either antidromic activation of PCs or local spread of the stimulus current. The final experiment asked whether the caudal activation of Cb by WM stimulation required 1) synaptic transmission from mossy or climbing fibers, or 2) non-synaptic depolarization from antidromic spikes that activate PC cells and their adjacent proximal dendrites. To perform this test, calcium ions in the extracellular media were substituted with cobalt ions to block synaptic transmission. Before that substitution, the response to WM stimulation was nearly synchronous in the caudal direction (caudal is to the right in Fig. 8, control). Five minutes after the media was switched to block synaptic transmission (Fig. 8, 5 min CoCl2), only a granule cell layer response remained. That response may possibly be due to activation of stained membrane by the local spread of the stimulus current. Forty minutes after washout, the synaptic response returned like that of the control. These findings suggest that synaptic transmission is required for this nearly synchronous, caudal response, making it unlikely that antidromic activation of PCs is the underlying mechanism. Moreover, responses to WM stimulation were localized to the GCL and adjacent PCL, suggesting that synapses from mossy fibers onto granule cells, and possibly climbing fibers onto Purkinje cell bodies may be involved.
Figure 8.
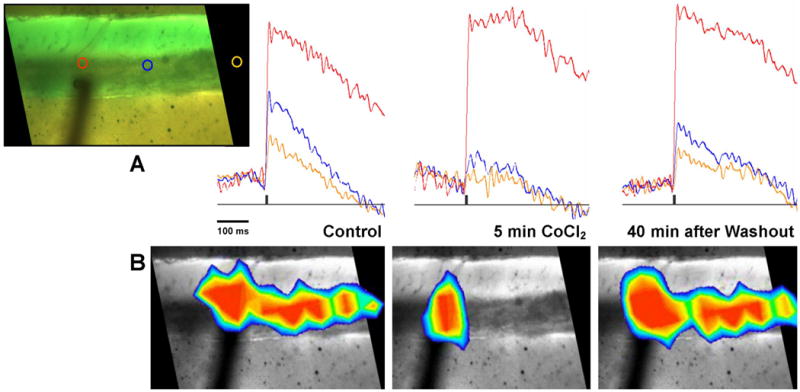
Effect of Co++-substituted media on responses to white matter stimulation of a sagittal slice. A) Top row shows a photograph of the Cb slice sandwiched between two Sylgard slabs, with the caudal side to the right. Three diode locations in the granule cell layer are circled in red, blue and yellow, corresponding to the red, blue and yellow superimposed traces before, during, and after Co++-substitution. In the control, responses at all three diodes were strong. During low Ca++ / high Co++, the red diode at the stimulation site remained strong but the amplitudes of the two caudal diodes were decreased. Forty minutes after washout, the responses of those two caudal diodes were nearly recovered. B) Bottom row shows pseudocolor images that correspond to the peak responses of stimulation before, during, and after Co++-substitution. Note that the response field during low Ca++ / high Co++ was restricted to a patch near the stimulation site.
3. Discussion
3.1 Localizing Responses to Layers of the Cerebellar Cortex
Using in vitro optical recordings of thick slices of turtle cerebellar cortex, distinct orthogonal responses to microstimulation were observed in the radial, transverse and sagittal planes. Experiments indicate that these responses are absorbance changes of the voltage-sensitive dyes that reflect postsynaptic activity either within the molecular layer or the deeper layers of the cerebellar cortex. The response timing suggests that local cerebellar conduction along the radial and sagittal paths are very rapid. Thus, different conduction path lengths do not distort the latencies of sensory signals in the sagittal plane within the cerebellar circuits. This feature supports the synchrony of responses observed in the intact cerebellum to synchronized afferent input. Furthermore, differences in timing of natural sensory signals in Cb may accurately represent differences in timing of actual sensory events to provide precise sensory feedback to coordinate sequences of motor control commands.
To interpret the source of voltage-sensitive dye signals, the density of staining should be measured for the different neuronal processes in each layer. Cohen and Yarom examined the staining by a similar lipophilic dye following pressure injection into the in vitro yet intact guinea pig Cb and reported that the dye spread homogeneously from the pia to the white matter (Cohen and Yarom, 1999). The staining in the image in their figure 1C shows layered staining similar to that which we observe in turtle Cb. They also reported that optical responses were similar for either pressure injected or bath applied dyes. One conclusion from those optical recordings in intact guinea pig Cb in vitro is that the primary source of responses to ML stimulation is synaptic activation of Purkinje cell dendrites (Cohen and Yarom, 1999) and that white matter stimulation evoked synaptic responses in Purkinje cells via granule cells (Cohen and Yarom, 1998).
In vitro immersion of the intact turtle Cb in a similar lipophilic dye resulted in similar staining as that found in the guinea pig. Surprisingly, the two layers in turtle Cb slices that have high concentrations of lipid-dense myelin, WM and PCL, were not stained selectively. The stain appeared darker in the ML (Fig. 2D), but the darkest part of the Cb slice in the recording chamber was the granule cell layer (Fig. 2E). Further observations of those slices indicate that transmission of light through the thick slice is related to the direction of illumination, suggesting that increased light scatter by granule cells is a factor. During indirect lighting (Fig. 2D), the GCL and PCL appears to be stained blue by the RH482 dye, but less so than the ML. This staining may still enable measurement of voltage sensitive optical signals within those layers.
Several aspects of our experiments confirm that optical responses were evoked from membrane throughout the Cb depth. First, Neuroplex software scales the response amplitudes by a normalization procedure based on the intensity of transilluminated light. Thus, the relative contributions of ML versus GCL/PCL are directly computed. It is clear that these optical signals reflect changes in absorbance of the voltage sensitive dye within the cellular membrane, rather than rapid changes in an inherent signal attributed to light scatter, because of the different response polarity during exposure to 540, 710 and 850 nm light. Finally, although an image of a Cb slice has poor response localization with a 464-diode array and a 2× microscope objective, the spatial resolution is adequate to resolve the layers using the 5× objective.
3.2 What cellular components are encoded in these voltage-sensitive dye signals?
The data clearly show dramatic response differences within different layers that depend on the plane of the Cb slices. Namely, though GCL involvement was observed within the patch-like responses of both transverse and sagittal slices, WM stimulation evoked synchronous GCL responses caudally in sagittal slices while ML stimulation elicited slow, bidirectional, parallel fiber beams. These differences presumable result from the different orientations of the cellular components of each layer. It has been reported that the optical signals from an intact turtle Cb stained by immersion in voltage-sensitive dye were similar in shape as an intracellular recordings from a turtle PC soma (Lu et al., 2003 Senseman), suggesting that PC membrane dominates the optical signal. However, the stimulus in that study was a large current pulse to a peduncle wedged into a suction pipette. Here, stimulation was localized to specific layers during recording of thick Cb slices, and signals were also measured in the GCL, suggesting that granule cells may contribute to optical signals as well. Moreover, our studies cannot exclude a possible contribution by glial cell membrane polarization to the optical signals. In fact, we suggest that radial glial membrane may contribute to the optical signals that reveal radial tissue polarization (see Experimental Procedure).
Although the dyes and photodiodes used in these optical recordings can respond to very brief events, the duration of the recorded optical signals were dozens if not hundreds of milliseconds. This suggests that action potentials did not contribute much to these waveforms relative to synaptic potentials. The optical signals were also blocked by superfusion of media in which Ca2+ was substituted with Co2+, which is known to block synaptic responses. Thus, these signals show neither orthodromic spikes in parallel fibers nor antidromic spikes of PCs because responses are absent during Co2+ to WM stimulation (Fig. 8) and ML stimulation (data not shown). Though not spikes, the actual cellular source of optical signals following WM stimulation is not known. Signals within the GCL could be from the membrane of granule cells, postsynaptic to mossy fibers, as well as the very large glomeruli described in turtle (Mugnaini et al., 1974; Walsh et al., 1974). The presence of signal in the PCL may indicate that Purkinje cell bodies are activated by climbing fibers that, in the turtle, primarily activate PC somata and their proximal dendrites (Bantli, 1974; Kunzle, 1985; Midtgaard et al., 1993; Tolbert et al., 2004).
3.3 Optical Signals from Intact Cb reflect Multiple Sources of Cb Layers and Cells
Even using very low levels of microstimulation, neuronal activation cannot be limited to specific cellular components. We previously reported that GCL stimulation evoked patches of radial optical responses that appeared contaminated simultaneously by small signals in both the transverse and sagittal planes (Brown and Ariel, 2009). However, using Cb slices, we find that Cb signals are present in all Cb layers, depending on the stimulation site. These signals and their mechanisms for temporal processing can be further studied separate from one another in this slice preparation depending on the slice orientation.
ML responses
In the transverse plane, there is a clear correspondence of bidirectional beams of activation described in the intact Cb (Brown and Ariel, 2009; Cohen and Yarom, 1999; Diez-Garcia et al., 2007; Dunbar et al., 2004; Elias et al., 1993; Kim et al., 1989) to the direct demonstration of ML beams in the transverse slices (Fig. 4). Quantitatively, ML stimulation also evoked beams of very similar conduction velocity (0.235 m/s in slice and 0.244 m/s, Brown and Ariel).
Patch responses
GC axons ascend to the molecular layer, synapsing with PCs during their ascent (Huang et al., 2006; Tolbert et al., 2004). These results support the view that individual mossy fiber input can affect its radial patch of cerebellar cortical tissue (Llinas, 1982). Stimulating mossy fibers activates a local patch of PCs (Bower and Devor, 2003; Cohen and Yarom, 1998; Cohen and Yarom, 1999), due to the strong positive correlation of the activity of granule cells and their overlying PCs (Bower and Woolston, 1983; Lu et al., 2005) that has been attributed to synapses from ascending granule cell axons (Gundappa-Sulur et al., 1999; Jaeger and Bower, 1994). In intact rats, similar patches of Cb activation were observed during tactile stimulation (Bower and Woolston, 1983). These ascending axon synapses increase with the maturity of the cerebellum (Huang et al., 2006) but may not be stronger than parallel fiber synapses (Walter et al., 2009).
Also in the radial direction and sagittal plane, there is much anatomical evidence of Cb modules organized in a system-specific spatial distribution that is restricted to parasagittal bands or patches (Chen et al., 1996; Gravel and Hawkes, 1990; Hanson et al., 2000; Ji and Hawkes, 1994; Ozol et al., 1999; Sillitoe and Joyner, 2007). Mossy fiber terminals, ascending granule cell axons and Purkinje cells are organized functionally in radially oriented, patch-shaped modular compartments. Irregularly-shaped terminal patches have been described for somatosensory afferents terminating within parasagittal oriented stripes (Alisky and Tolbert, 1997; Berretta et al., 1991; Tolbert et al., 1993; Tolbert and Gutting, 1997). This anatomically defined patch pattern correlates with a patch organization of cutaneous receptive fields in the granule cell layer and, more important, in the radially overlying molecular layer (Bower et al., 1981; Bower and Woolston, 1983; Joseph et al., 1978; Shambes et al., 1978a; Shambes et al., 1978b).
WM responses
In the sagittal slices, a caudal region of Cb was activated almost simultaneously following microstimulation. In the intact Cb, similar WM stimulation evoked synchronized parasagittal bands (Brown and Ariel, 2009). In that case, the response was attributed to climbing fiber activation of PCs because the response topography was similar to that of microstimulation of the inferior olive. This conclusion needs to be reevaluated in light of the sagittal slice data, which localized the response to the PCL and GCL. Climbing fiber activation of PCs should be located to the PCL or just dorsal to it because climbing fiber synapses may be limited with the lower quarter of the ML (Tolbert et al., 2004). Climbing fiber input is also known in other species to for a sagittal band of activation (Chen et al., 1996; Gao et al., 2006; Rokni et al., 2007; Sasaki et al., 1989) that responds synchronously (Lang and Rosenbluth, 2003; Sasaki et al., 1989; Schultz et al., 2009).
Responses to WM stimulation in the GCL suggests that mossy fibers also contribute to the sagittal activation of the Cb. Sagittal mossy fiber structure has been described in mammals (Alisky and Tolbert, 1997). Here, optical recordings suggest that this mossy fiber path in turtles may provide synchronous activation of sagittal bands in the Cb. The mechanism of such synchronization, in the face of different axonal lengths of spike conduction along the flat WM of the turtle Cb remains to be investigated. Like the climbing fibers (Lang and Rosenbluth, 2003), myelination may not only be a way to improve conduction, but may also be the mechanism to control the timing of messages among various axons of different length (Kimura and Itami, 2009).
4. Experimental Procedure
4.1 Animals
These experiments used 47 common red-ear pond turtles, Trachemys scripta elegans, whose carapace lengths were approximately 15 cm). Animals of this size have Cb whose mean depth is approximately 800 μm, measured from the midline ventricular surface to its pia (Ariel and Fan, 1993; Brown and Ariel, 2009; Rosenberg and Ariel, 1990). The animals were housed at room temperature in an aquarium on a 16/8-h light-dark cycle, where they could swim and bask at will. The turtles were handled and housed in accordance with N.I.H. guidelines. The protocols of animal care and surgical procedures were approved by the Saint Louis University Animal Care Committee. Details of the methods of optical recordings of turtle Cb are reported elsewhere (Ariel and Fan, 1993; Brown and Ariel, 2009; Rosenberg and Ariel, 1990). These techniques are now summarized briefly, indicating methods that are specific to recording from cerebellar slices.
4.2 The Turtle Cerebellum Preparation
The brain was removed from the anesthetized animal, and its Cb was placed in physiological media (in mM, 96.5 NaCl, 2.6 KCl, 2.0 MgCl2, 31.5 NaHCO3, 4.0 CaCl2, 20 D-glucose; bubbled with 95% O2-5% CO2; pH∼7.6, ∼274 mOsmol). The intact Cb was stained for 30-60 min in the voltage-sensitive oxonol dye RH482 (supplied as NK3630 from Nippon Kankoh, Japan; 1mg/2.5mL in physiological media), followed by a 15 min rinse to remove excess dye that was not bound to membrane. The tissue is then mounted in the optical recording chamber that was stabilized on a vibration-isolation table. During the recording epoch, vibration was further minimized by closing the chamber's media inflow and outflow. In some experiments, Co++ was substituted for the Ca++ of the oxygenated physiological media to block synaptic transmission throughout the tissue.
Thick (0.5 - 1 mm) Cb slices were cut on a tissue chopper (Stoelting, Chicago IL), either in the transverse or sagittal planes. Cb sections were maintained in oxygenated physiological media until they were secured into the recording chamber (fig. 1A). The chamber was above an optical condenser to illuminate the tissue and below a fixed stage microscope (BX-51; Olympus, Tokyo JP). One of two microscope objectives (2× PlanApo N NA 0.08 or 5× UMplanFL NA 0.15, Olympus, Tokyo JP) was used to form an image on the 464-photodiode array. Using a 2× microscope objective, several slices secured with small pins could be studied in the same field of view (fig. 1B). In later experiments, slices were studied individually, each held in place between opaque pieces of Sylgard so that no pins were needed (fig. 1D). A 7-mm wide strip of #1 cover glass was placed directly over the tissue to minimize optical distortion of the moving surface of physiological media, leaving 2 mm of access for a bipolar stimulating electrode to stimulate specific Cb layers using small biphasic current pulses (100 μs long using 5-200 μA).
4.3 Optical Recordings
The absorbance of light through the thick Cb slices was measured by the same technique used was used to measure the intact Cb preparation (Brown and Ariel, 2009). Briefly, narrow band light transilluminated the tissue and was sensed by a 464-photodiode-array (WuTech H-469IV PDA, Gaithersburg MD). The transilluminating light was restricted to 715nm ± 35nm by an interference filter (Chroma Technology, Brattleboro VT) so that an increase in absorbance by the voltage-sensitive dye RH482 is equivalent to a membrane depolarization. Before stimulating the tissue, the resting intensity of (transilluminated) light (RLI) was measured for each diode. Those RLI values did not vary significantly over the course of these experiments. Neuroplex software then divided each diode's response amplitude by its RLI value (ΔA/A; the fractional change in light absorbance of the dye), which relates to the change in membrane voltage (Saltzberg et al., 1977). These normalized values compensated for the inhomogeneities of the illuminator optics and the differential thickness and staining of the Cb. The two microscope objectives (2× or 5×) formed an image on the 464-photodiode array, resulting in slices approximately subtending from pia to ventricle 3 or 8 diodes, respectively. Traces recorded by each diode of the array were overlaid onto the image of the transilluminated tissue captured by the digital camera attached to the trinocular port of the microscope (see Fig. 3).
Two artifactual measurements were evaluated: scattering of light by the tissue and radial tissue polarization. To measure spatial scatter, the spatial spread of light onto the photodiode array was measured by placing a 100-micron pinhole in the image plane during transillumination, which limited the light to an initial single diode. The resulting image was recorded by the digital camera and photodiode array. When the Cb was placed directly over the pinhole to evaluate the effect of that tissue on light scattering, the light spread by the Cb from the initial diode to adjacent diodes was small. Relative to the light intensity recorded at the initial diode, the light falling on the immediately adjacent diodes was only a small fraction, falling within 2-3 diode lengths to less than 5% of the initial diode value. We conclude that the scatter of the transilluminated light by the Cb would not limit the localization of voltage sensitive dye responses to layers of the Cb using a 5× microscope objective and 464-diode array.
At the pia or ventricular edge of slices, there were often large prolonged deflections that were time-locked to the stimulation. These deflections were believed to be artifacts because the tissue does not have excessive amounts of synapses or dendritic membrane at or near those surfaces yet bright light directly scatters around those edges. These artifacts were weaker in later experiments for which slices were sandwiched between opaque pieces of Sylgard that reduced the light near the edges of the tissue. Sometimes, small positive and negative deflections remained, perhaps due to intrinsic changes in tissue transparency or radial tissue polarization produced by radial glia that span the turtle's thin Cb (Bantli, 1974).
4.4 Data Analysis of Optical Signals
Changes in dye absorbance due to Cb microstimulation were recorded and analyzed using the NeuroPlex system (RedShirt Imaging, LLC; Fairfield, CT). Each diode was recorded with the equivalent of a very long time constant (∼20 s) but slow drifts that are characteristic of optical signals were filtered out to improve the signal-to-noise ratio with minimal effects on the response amplitude and timing of each response. To quantify responses, standard recordings of four single responses at 2 Hz were averaged or responses to 90 ms, 70 Hz train of stimuli were measured. If possible, consecutive records of responses evoked under similar stimulus conditions were also averaged.
The NeuroPlex system was also used to convert the individual optical traces into pseudocolor movies or single pseudocolor frames aligned and superimposed on a photograph of the actual tissue. Each pseudocolor image represents the response at one point in time that is above a threshold value that excludes recording system noise. Alternatively, response latencies (based on peak risetime) were individually scored for each diode and plotted as latency-distance plots relative to the distance of recording position from the stimulation point. To view latency topographically, grayscale latency maps were generated such that the diode with the longest response latency was displayed on a hexagonal array as gray boxes whose darkness was scaled as a function of their response latency. Diodes with the longest response latencies were displayed as darkest boxes and those with the shortest latencies were the lightest boxes.
Supplementary Material
Acknowledgments
This study was supported by National Institute of Neurological Disorders and Stroke Grant NS-46499 (MA). We thank Drs. Daniel Tolbert and Yosef Yarom for their helpful comments.
Footnotes
Publisher's Disclaimer: This is a PDF file of an unedited manuscript that has been accepted for publication. As a service to our customers we are providing this early version of the manuscript. The manuscript will undergo copyediting, typesetting, and review of the resulting proof before it is published in its final citable form. Please note that during the production process errors may be discovered which could affect the content, and all legal disclaimers that apply to the journal pertain.
References
- Alisky JM, Tolbert DL. Quantitative analysis of converging spinal and cuneate mossy fibre afferent projections to the rat cerebellar anterior lobe. Neuroscience. 1997;80:373–88. doi: 10.1016/s0306-4522(97)00082-1. [DOI] [PubMed] [Google Scholar]
- Ariel M, Fan TX. Electrophysiological evidence for a bisynaptic retinocerebellar pathway. Journal of Neurophysiology. 1993;69:1323–30. doi: 10.1152/jn.1993.69.4.1323. [DOI] [PubMed] [Google Scholar]
- Bantli H. Analysis of difference between potentials evoked by climbing fibers in cerebellum of cat and turtle. Journal of Neurophysiology. 1974;37:573–93. doi: 10.1152/jn.1974.37.4.573. [DOI] [PubMed] [Google Scholar]
- Berretta S, Perciavalle V, Poppele RE. Origin of spinal projections to the anterior and posterior lobes of the rat cerebellum. Journal of Comparative Neurology. 1991;305:273–81. doi: 10.1002/cne.903050208. [DOI] [PubMed] [Google Scholar]
- Blenkinsop TA, Lang EJ. Block of inferior olive gap junctional coupling decreases purkinje cell complex spike synchrony and rhythmicity. J Neurosci. 2006;26:1739–1748. doi: 10.1523/JNEUROSCI.3677-05.2006. [DOI] [PMC free article] [PubMed] [Google Scholar]
- Bower JM, Beermann DH, Gibson JM, Shambes GM, Welker W. Principles of organization of a cerebro-cerebellar circuit. Micromapping the projections from cerebral (SI) to cerebellar (granule cell layer) tactile areas of rats. Brain, Behavior & Evolution. 1981;18:1–18. doi: 10.1159/000121772. [DOI] [PubMed] [Google Scholar]
- Bower JM, Woolston DC. Congruence of spatial organization of tactile projections to granule cell and Purkinje cell layers of cerebellar hemispheres of the albino rat: vertical organization of cerebellar cortex. J Neurophysiol. 1983;49:745–766. doi: 10.1152/jn.1983.49.3.745. [DOI] [PubMed] [Google Scholar]
- Bower JM, Devor A. Mapping of the hemodynamic response in the cerebellum with intrinsic optical imaging: beams vs. patches. Soc Neurosci Abstr. 2003;27 [Google Scholar]
- Brown ME, Ariel M. Topography and response timing of intact cerebellum stained with absorbance voltage-sensitive dye. J Neurophysiol. 2009;101:474–490. doi: 10.1152/jn.90766.2008. [DOI] [PMC free article] [PubMed] [Google Scholar]
- Chan CY, Hounsgaard J, Nicholson C. Effects of electric fields on transmembrane potential and excitability of turtle cerebellar Purkinje cells in vitro. Journal of Physiology. 1988;402:751–71. doi: 10.1113/jphysiol.1988.sp017232. [DOI] [PMC free article] [PubMed] [Google Scholar]
- Chan CY, Hounsgaard J, Midtgaard J. Excitatory synaptic responses in turtle cerebellar Purkinje cells. Journal of Physiology. 1989;409:143–56. doi: 10.1113/jphysiol.1989.sp017489. [DOI] [PMC free article] [PubMed] [Google Scholar]
- Chen G, Hanson CL, Ebner TJ. Functional parasagittal compartments in the rat cerebellar cortex: an in vivo optical imaging study using neutral red. Journal of Neurophysiology. 1996;76:4169–74. doi: 10.1152/jn.1996.76.6.4169. [DOI] [PubMed] [Google Scholar]
- Cohen D, Yarom Y. Patches of synchronized activity in the cerebellar cortex evoked by mossy-fiber stimulation: questioning the role of parallel fibers. Proceedings of the National Academy of Sciences of the United States of America. 1998;95:15032–6. doi: 10.1073/pnas.95.25.15032. [DOI] [PMC free article] [PubMed] [Google Scholar]
- Cohen D, Yarom Y. Optical measurements of synchronized activity in isolated mammalian cerebellum. Neuroscience. 1999;94:859–66. doi: 10.1016/s0306-4522(99)00348-6. [DOI] [PubMed] [Google Scholar]
- Coutinho V, Mutoh H, Knopfel T. Functional topology of the mossy fibre-granule cell- Purkinje cell system revealed by imaging of intrinsic fluorescence in mouse cerebellum. Eur J Neurosci. 2004;20:740–748. doi: 10.1111/j.1460-9568.2004.03533.x. [DOI] [PubMed] [Google Scholar]
- Diez-Garcia J, Akemann W, Knopfel T. In vivo calcium imaging from genetically specified target cells in mouse cerebellum. NeuroImage. 2007;34:859–869. doi: 10.1016/j.neuroimage.2006.10.021. [DOI] [PubMed] [Google Scholar]
- Dunbar RL, Chen G, Gao W, Reinert KC, Feddersen R, Ebner TJ. Imaging parallel fiber and climbing fiber responses and their short-term interactions in the mouse cerebellar cortex in vivo. Neuroscience. 2004;126:213–27. doi: 10.1016/j.neuroscience.2004.02.020. [DOI] [PubMed] [Google Scholar]
- Ebner TJ, Chen G, Gao W, Reinert K. Optical imaging of cerebellar functional architectures: parallel fiber beams, parasagittal bands and spreading acidification. In: De Zeeuw CI, editor. Creating coordination in the cerebellum. Progress in Brain Research. Elsevier; 2005. pp. 125–138. [DOI] [PubMed] [Google Scholar]
- Eccles JC, Llinas R, Sasaki K. Parallel fibre stimulation and the responses induced thereby in the Purkinje cells of the cerebellum. Experimental Brain Research. 1966;1:17–39. doi: 10.1007/BF00235207. [DOI] [PubMed] [Google Scholar]
- Elias SA, Yae H, Ebner TJ. Optical imaging of parallel fiber activation in the rat cerebellar cortex: spatial effects of excitatory amino acids. Neuroscience. 1993;52:771–786. doi: 10.1016/0306-4522(93)90528-n. [DOI] [PubMed] [Google Scholar]
- Gao W, Chen G, Reinert KC, Ebner TJ. Cerebellar cortical molecular layer inhibition is organized in parasagittal zones. J Neuroscience. 2006;26:8377–8387. doi: 10.1523/JNEUROSCI.2434-06.2006. [DOI] [PMC free article] [PubMed] [Google Scholar]
- Gravel C, Hawkes R. Parasagittal organization of the rat cerebellar cortex: direct comparison of Purkinje cell compartments and the organization of the spinocerebellar projection. Journal of Comparative Neurology. 1990;291:79–102. doi: 10.1002/cne.902910107. [DOI] [PubMed] [Google Scholar]
- Gundappa-Sulur G, De Schutter E, Bower JM. Ascending granule cell axon: an important component of cerebellar cortical circuitry. Journal of Comparative Neurology. 1999;408:580–96. doi: 10.1002/(sici)1096-9861(19990614)408:4<580::aid-cne11>3.0.co;2-o. [DOI] [PubMed] [Google Scholar]
- Hanson CL, Chen G, Ebner TJ. Role of climbing fibers in determining the spatial patterns of activation in the cerebellar cortex to peripheral stimulation: an optical imaging study. Neuroscience. 2000;96:317–31. doi: 10.1016/s0306-4522(99)00470-4. [DOI] [PubMed] [Google Scholar]
- Hillman DE. Neuronal organization of the cerebellar cortex in amphibia and reptilia. In: Llinas R, editor. Neurobiology of Cerebellar Evolution and Development. American Medical Association; Chicago: 1969. pp. 279–325. [Google Scholar]
- Huang CM, Wang L, Huang RH. Cerebellar granule cell: ascending axon and parallel fiber. European Journal of Neuroscience. 2006;23:1731–7. doi: 10.1111/j.1460-9568.2006.04690.x. [DOI] [PubMed] [Google Scholar]
- Jaeger D, Bower JM. Prolonged responses in rat cerebellar Purkinje cells following activation of the granule cell layer: an intracellular in vitro and in vivo investigation. Experimental Brain Research. 1994;100:200–14. doi: 10.1007/BF00227191. [DOI] [PubMed] [Google Scholar]
- Ji Z, Hawkes R. Topography of Purkinje cell compartments and mossy fiber terminal fields in lobules II and III of the rat cerebellar cortex: spinocerebellar and cuneocerebellar projections. Neuroscience. 1994;61:935–54. doi: 10.1016/0306-4522(94)90414-6. [DOI] [PubMed] [Google Scholar]
- Joseph JW, Shambes GM, Gibson JM, Welker W. Tactile projections to granule cells in caudal vermis of the rat's cerebellum. Brain, Behavior & Evolution. 1978;15:141–9. doi: 10.1159/000123776. [DOI] [PubMed] [Google Scholar]
- Kim JH, Dunn MB, Hua Y, Rydberg J, Yae H, Elias SA, Ebner TJ. Imaging of cerebellar surface activation in vivo using voltage sensitive dyes. Neuroscience. 1989;31:613–623. doi: 10.1016/0306-4522(89)90427-2. [DOI] [PubMed] [Google Scholar]
- Kimura F, Itami C. Myelination and isochronicity in neural networks. 2009;3 doi: 10.3389/neuro.05.012.2009. [DOI] [PMC free article] [PubMed] [Google Scholar]
- Knopfel T, Akemann W, Middleton SJ. Optical imaging as a link between cellular neurophysiology and circuit modeling. Frontiers in Cellular Neuroscience. 2009;3 doi: 10.3389/neuro.03.005.2009. [DOI] [PMC free article] [PubMed] [Google Scholar]
- Konnerth A, Obaid AL, Salzberg BM. Optical recording of electrical activity from parallel fibres and other cell types in skate cerebellar slices in vitro. J Physiol. 1987;393:681–702. doi: 10.1113/jphysiol.1987.sp016848. [DOI] [PMC free article] [PubMed] [Google Scholar]
- Kunzle H. Climbing fiber projection to the turtle cerebellum: longitudinally oriented terminal zones within the basal third of the molecular layer. Neuroscience. 1985;14:159–68. doi: 10.1016/0306-4522(85)90171-x. [DOI] [PubMed] [Google Scholar]
- Lang EJ. Organization of olivocerebellar activity in the absence of excitatory glutamatergic input. Journal of Neuroscience. 2001;21:1663–1675. doi: 10.1523/JNEUROSCI.21-05-01663.2001. [DOI] [PMC free article] [PubMed] [Google Scholar]
- Lang EJ, Rosenbluth J. Role of myelination in the development of a uniform olivocerebellar conduction time. Journal of Neurophysiology. 2003;89:2259–70. doi: 10.1152/jn.00922.2002. [DOI] [PubMed] [Google Scholar]
- Llinas R. The Cerebellum: new vistas. Springer; New York: 1982. Radial connectivity in the cerebellar cortex. [Google Scholar]
- Llinas RR. Inferior olive oscillation as the temporal basis for motricity and oscillatory reset as the basis for motor error correction. Neuroscience. 2009 doi: 10.1016/j.neuroscience.2009.04.045. In Press, Corrected Proof. [DOI] [PMC free article] [PubMed] [Google Scholar]
- Lu H, Robbins KA, Bower JM, Senseman DM. Concurrent VSD imaging and intracellular microelectrode recording from turtle cerebellum: contribution of purkinje cells to VSD signal. Soc Neurosci Abstr. 2003;27 [Google Scholar]
- Lu H, Hartmann MJ, Bower JM. Correlations Between Purkinje Cell Single-Unit Activity and Simultaneously Recorded Field Potentials in the Immediately Underlying Granule Cell Layer. J Neurophysiol. 2005;94:1849–1860. doi: 10.1152/jn.01275.2004. [DOI] [PubMed] [Google Scholar]
- Midtgaard J, Lasser-Ross N, Ross WN. Spatial distribution of Ca2+ influx in turtle Purkinje cell dendrites in vitro: role of a transient outward current. Journal of Neurophysiology. 1993;70:2455–69. doi: 10.1152/jn.1993.70.6.2455. [DOI] [PubMed] [Google Scholar]
- Momose-Sato Y, Sato K, Arai Y, Yazawa I, Mochida H, Kamino K. Evaluation of voltage-sensitive dyes for long-term recording of neural activity in the hippocampus. Journal of Membrane Biology. 1999;172:145–57. doi: 10.1007/s002329900592. [DOI] [PubMed] [Google Scholar]
- Mugnaini E, Atluri RL, Houk JC. Fine structure of granular layer in turtle cerebellum with emphasis on large glomeruli. Journal of Neurophysiology. 1974;37:1–29. doi: 10.1152/jn.1974.37.1.1. [DOI] [PubMed] [Google Scholar]
- Ozol K, Hayden JM, Oberdick J, Hawkes R. Transverse zones in the vermis of the mouse cerebellum. Journal of Comparative Neurology. 1999;412:95–111. [PubMed] [Google Scholar]
- Rokni D, Llinas R, Yarom Y. Stars and stripes in the cerebellar cortex: A voltage sensitive dye study. Front Syst Neurosci. 2007;1:1–9. doi: 10.3389/neuro.06.001.2007. [DOI] [PMC free article] [PubMed] [Google Scholar]
- Rosenberg AF, Ariel M. Visual-response properties of neurons in turtle basal optic nucleus in vitro. Journal of Neurophysiology. 1990;63:1033–1045. doi: 10.1152/jn.1990.63.5.1033. [DOI] [PubMed] [Google Scholar]
- Saltzberg BM, Grinvald A, Cohen LB, Davila HV, Ross WN. Optical recording of neuronal activity in an invertebrate central nervous system: Simultaneous monitoring of several neurons. J Neurophysiology. 1977;40 doi: 10.1152/jn.1977.40.6.1281. [DOI] [PubMed] [Google Scholar]
- Sasaki K, Bower JM, Llinas R. Multiple Purkinje cell recording in rodent cerebellar cortex. European Journal of Neuroscience. 1989;1:571–586. doi: 10.1111/j.1460-9568.1989.tb00364.x. [DOI] [PubMed] [Google Scholar]
- Schultz SR, Kitamura K, Post-Uiterweer A, Krupic J, Hausser M. Spatial Pattern Coding of Sensory Information by Climbing Fiber-Evoked Calcium Signals in Networks of Neighboring Cerebellar Purkinje Cells. Journal of Neuroscience. 2009;29:8005–8015. doi: 10.1523/JNEUROSCI.4919-08.2009. [DOI] [PMC free article] [PubMed] [Google Scholar]
- Shambes GM, Beermann DH, Welker W. Multiple tactile areas in cerebellar cortex: another patchy cutaneous projection to granule cell columns in rats. Brain Research. 1978a;157:123–8. doi: 10.1016/0006-8993(78)91000-4. [DOI] [PubMed] [Google Scholar]
- Shambes GM, Gibson JM, Welker W. Fractured somatotopy in granule cell tactile areas of rat cerebellar hemispheres revealed by micromapping. Brain, Behavior & Evolution. 1978b;15:94–140. doi: 10.1159/000123774. [DOI] [PubMed] [Google Scholar]
- Shin SL, De Schutter E, Shin SL, De Schutter E. Dynamic synchronization of Purkinje cell simple spikes. Journal of Neurophysiology. 2006;96:3485–91. doi: 10.1152/jn.00570.2006. [DOI] [PubMed] [Google Scholar]
- Sillitoe RV, Joyner AL. Morphology, molecular codes, and circuitry produce the three-dimensional complexity of the cerebellum. Annual Review of Cell & Developmental Biology. 2007;23:549–77. doi: 10.1146/annurev.cellbio.23.090506.123237. [DOI] [PubMed] [Google Scholar]
- Sugihara I, Lang EJ, Llinas R. Uniform olivocerebellar conduction time underlies Purkinje cell complex spike synchronicity in the rat cerebellum. Journal of Physiology. 1993;470:243–71. doi: 10.1113/jphysiol.1993.sp019857. [DOI] [PMC free article] [PubMed] [Google Scholar]
- Tolbert DL, Alisky JM, Clark BR. Lower thoracic upper lumbar spinocerebellar projections in rats: a complex topography revealed in computer reconstructions of the unfolded anterior lobe. Neuroscience. 1993;55:755–74. doi: 10.1016/0306-4522(93)90440-q. [DOI] [PubMed] [Google Scholar]
- Tolbert DL, Gutting JC. Quantitative analysis of cuneocerebellar projections in rats: differential topography in the anterior and posterior lobes. Neuroscience. 1997;80:359–71. doi: 10.1016/s0306-4522(97)00081-x. [DOI] [PubMed] [Google Scholar]
- Tolbert DL, Conoyer B, Ariel M. Quantitative analysis of granule cell axons and climbing fiber afferents in the turtle cerebellar cortex. Anatomy and Embryology. 2004;209:49–58. doi: 10.1007/s00429-004-0423-0. [DOI] [PMC free article] [PubMed] [Google Scholar]
- Walsh JV, Houk JC, Mugnaini E. Identification of unitary potentials in turtle cerebellum and correlations with structures in granular layer. Journal of Neurophysiology. 1974;37:30–47. doi: 10.1152/jn.1974.37.1.30. [DOI] [PubMed] [Google Scholar]
- Walter JT, Dizon MJ, Khodakhah K. The Functional Equivalence of Ascending and Parallel Fiber Inputs in Cerebellar Computation. Journal of Neuroscience. 2009;29:8462–8473. doi: 10.1523/JNEUROSCI.5718-08.2009. [DOI] [PMC free article] [PubMed] [Google Scholar]
- Yarom Y, Cohen D. The Olivocerebellar System as a Generator of Temporal Patterns. Annals of the New York Academy of Sciences. 2002;978:122–134. doi: 10.1111/j.1749-6632.2002.tb07561.x. [DOI] [PubMed] [Google Scholar]
Associated Data
This section collects any data citations, data availability statements, or supplementary materials included in this article.