

Abstract
Background
Recent studies have found substantial variation in hospital resource utilization by expired Medicare beneficiaries with chronic illnesses. By analyzing only expired patients, these studies cannot identify differences across hospitals in health outcomes like mortality. This study examines the association between mortality and resource utilization at the hospital level, when all Medicare beneficiaries hospitalized for heart failure are examined.
Methods and Results
3,999 individuals hospitalized with a principal diagnosis of heart failure at six California teaching hospitals between January 1, 2001 and June 30, 2005 were analyzed with multivariate risk-adjustment models for total hospital days, total hospital direct costs, and mortality within 180-days after initial admission (“Looking Forward”). A subset of 1,639 individuals who died during the study period were analyzed with multivariate risk-adjustment models for total hospital days and total hospital direct costs within 180-days prior to death (“Looking Back”). “Looking Forward” risk-adjusted hospital means ranged from 17.0% to 26.0% for mortality, 7.8 to 14.9 days for total hospital days, and 0.66 to 1.30 times the mean value for indexed total direct costs. Spearman rank correlation coefficients were −0.68 between mortality and hospital days, and −0.93 between mortality and indexed total direct costs. “Looking Back” risk-adjusted hospital means ranged from 9.1 to 21.7 days for total hospital days and 0.91 to 1.79 times the mean value for indexed total direct costs. Variation in resource utilization site ranks between expired and all individuals were due to insignificant differences.
Conclusions
California teaching hospitals that used more resources caring for patients hospitalized for heart failure had lower mortality rates. Focusing only on expired individuals may overlook mortality variation as well as associations between greater resource utilization and lower mortality. Reporting values without identifying significant differences may result in incorrect assumption of true differences.
Keywords: heart failure, delivery of health care, outcome assessment, healthcare costs, healthcare economics, organizations
Recent national1, 2 and California3 studies have documented substantial variation across hospitals in the resources used to care for expired elderly Medicare beneficiaries with chronic illnesses, including heart failure (HF), during the 6-month period immediately preceding death. The premise of these studies is that examining hospital resource utilization among expired elderly Medicare beneficiaries during a fixed time interval before death, which we term as the “Looking Back” method, minimizes the likelihood that variations in resource utilization are due to differences in severity of illness, since all patients have the same outcome: death. Therefore, the argument goes, hospitals with the lowest resource utilization can be used to establish performance benchmarks, whereas hospitals with the highest resource utilization can be identified as inefficient. Public discussions of these studies suggest that reducing hospital resource utilization to these performance benchmarks would result in substantial savings from current health care spending without adversely affecting health outcomes.4–6
However, the “Looking Back” method suffers from two potentially serious shortcomings. First, by design, the method used in these studies cannot identify differences across hospitals in health outcomes. By analyzing only expired patients, this method forces health outcomes to be identical across hospitals: 100% mortality. The “Looking Back” method ignores the possibility that resource-intensive care may improve survival, and therefore identifies resource-intensive care as inherently inefficient. Second, the “Looking Back” method implicitly assumes that patterns of resource use observed among expired patients accurately reflect patterns of resource use among all patients, including patients who survived. Thus, the “Looking Back” method ignores the possibility that some hospitals may direct resources to patients in a selective manner, based in part on the likelihood that the patient will benefit from receiving those resources.
This study examines these two concerns regarding the “Looking Back” method by comparing it with a “Looking Forward” methodology which allows conclusions to be drawn about survival in addition to resource use. For physicians, patients, and patients’ families, survival is a critical concern in patient care.7 Specifically, our goals were (1) to determine whether health outcomes for chronically ill patients vary across hospitals, as measured by mortality rates over fixed time intervals after hospitalization, and (2) to determine whether the patterns of hospital resource utilization observed among expired patients accurately reflect the patterns among all patients hospitalized during the same time period, including patients who survived. To achieve these goals, we examined two cohorts of elderly Medicare beneficiaries hospitalized for HF at six nonprofit academic hospitals in California between 2001 and 2005: a “Looking Forward” cohort that included all patients hospitalized during the study period, whether they expired or survived, and a “Looking Back” cohort of patients who expired during the study period, drawn from the “Looking Forward” cohort. The six study hospitals include the five University of California Medical Centers (UC Davis, UC Irvine, UC Los Angeles, UC San Diego, and UC San Francisco) and Cedars-Sinai Medical Center in Los Angeles. Cedars-Sinai is the largest teaching hospital in California and is academically affiliated with UC Los Angeles. These hospitals varied widely on hospital resource utilization in the prior studies,1–3 and they include both hospitals identified as examples of performance benchmarks (UC Davis and UC San Francisco) as well as hospitals identified as examples of high resource utilization (Cedars-Sinai and UC Los Angeles).
Data and Methods
“Looking Forward” cohort
We used administrative data from the six study hospitals to identify hospitalizations for 4,990 elderly (age 65 or over at admission) Medicare beneficiaries that occurred between January 1, 2001 and June 30, 2005 with a principal diagnosis of HF as defined by ICD-9-CM codes used by the Dartmouth Atlas of Health Care (398.9, 398.90, 398.91, 398.99, 402.0, 402.01, 402.1, 402.11, 402.9, 402.91, 404.0, 404.01, 404.03, 404.11, 404.13, 404.91, 404.93, 428.0, 428.1, 428.9, but not 428.2, 428.3, or 428.4)1, 8 or with a principal ICD-9-CM code of acute respiratory failure and a secondary diagnosis of HF.9 We defined initial hospitalizations as HF hospitalizations that occurred within the specified time period at the six sites and were not preceded by any other HF hospitalization within the previous six months. To enhance clinical homogeneity, we excluded initial hospitalizations for 107 patients assigned to a surgical Diagnostic Related Group (DRG) classification10 (except for valve replacement and pacemaker/defibrillator placement, which we included); for 120 patients who were transferred from another acute care hospital (because of unknown severity of illness and resource use at the preceding facility);11–14 and for 53 patients who had received a cardiac, renal, or hepatic transplant or were admitted for transplant evaluation based on ICD-9-CM codes (996.8, 996.80, 996.81, 996.82, 996.83, 996.89, E878.0, v42.0 v42.1, v42.7, v42.9, v49.83). We also excluded 711 individuals hospitalized at site F during 2001 and the first half of 2002 who had missing cost data. For the 445 patients who had multiple initial hospitalizations during the period, we randomly selected one of the initial hospitalizations to minimize bias in the assessment of hospital differences in mortality rates. The final ”Looking Forward” cohort consisted of 3,999 patients.
“Looking Back” cohort
The “Looking Back” cohort were drawn from the 1,650 patients in the “Looking Forward” cohort who expired between July 1, 2001 and December 31, 2005. Dates of death were identified using the hospital administrative data and the National Death Index (NDI, http://www.cdc.gov/nchs/ndi.htm). We excluded an additional 11 individuals hospitalized at site F who had missing cost data for hospitalizations prior to the initial hospitalization used in the “Looking Forward” cohort. The final “Looking Back” cohort consisted of 1,639 patients.
Outcomes
We generated two resource utilization outcomes, total hospital days and indexed total direct costs, from each hospital’s administrative data, and we obtained mortality outcomes from the administrative data and the NDI. For the Looking Forward cohort, we determined total hospital days during the 180-day period following each initial HF hospitalization by summing the lengths of stay for the initial hospitalization and any subsequent hospitalization, regardless of principal diagnosis, for which the admission date occurred within 180 days of the initial hospitalization admission date. We determined total direct costs using internal cost accounting system data for each hospitalization included in the calculation of total hospital days. We also assessed total hospital days and total direct costs for the initial hospitalization (not shown in tables). We did not use total (direct plus indirect) costs due to concerns regarding a lack of comparability of indirect cost accounting across sites. Total direct costs were indexed to 2005 using the medical care component of the Consumer Price Index (www.bls.gov/CPI). To avoid revealing proprietary information about hospital-specific costs, we then divided each site’s predicted total direct cost estimate by the mean predicted estimate for the entire study cohort (all six hospitals). We assessed mortality during the initial hospitalization and at 30 and 180 days after the initial hospitalization admission date. We chose to limit mortality assessment to 180-days after the initial hospitalization as one of our outcomes to be consistent with the 180-day resource utilization outcomes, and because previous studies have found that death up to 180 days after an initial hospitalization is associated with processes of care during the initial hospitalization.15
For the Looking Back cohort, we followed the same procedures except that we determined total hospital days and total hospital direct costs during the 180-day period immediately preceding death by summing the lengths of stay and costs from all hospitalizations that overlapped the beginning of a 180-day period counted backwards from the date of death.1–3
Statistical Analysis
We used multivariate regression analysis to assess differences across the study hospitals in the study outcomes, adjusted for differences in patient characteristics that can influence utilization and mortality. The key independent variables in the models were indicator variables for the 6 study hospitals, and the covariates included indicator variables for patient age on admission, gender, race/ethnicity (Hispanic, Black, Other, White), admission year, Medicaid as an additional payor, DRG for valve replacement or pacemaker/defibrillator placement, and each of 21 comorbidities derived from the Agency for Healthcare Research and Quality’s Healthcare Cost & Utilization Project, after taking out heart failure, comorbidities subject to misclassification (coagulopathies, electrolytes and fluid disorders) and comorbidities too rare to include in the analysis (chronic peptic ulcer disease, drug abuse, HIV and AIDS, pulmonary circulation disorders, and valvular disease).16, 17 Covariates for the Looking Forward cohort were derived from the initial hospitalization, while covariates for the Looking Back cohort were derived from the earliest hospitalization within 180 days of death.
For the “Looking Forward” cohort, we used zero-truncated Poisson regression models for total hospital days, zero-truncated negative binomial regression models for total hospital direct costs, and logistic regression models for mortality. We chose zero-truncated models for days and direct costs because these outcomes assume only nonzero positive values.18, 19 We further confirmed the choice of models by assessing goodness of fit for alternative models (negative binomial vs. overdispersed Poisson models, and models without zero truncation). For the “Looking Back” cohort, we used overdispersed Poisson regression models for total hospital days and ordinary least square regression models for total hospital direct costs, which were the methods used by prior studies.1–3 Cost analyses with negative binomial models found similar results. In all models, we used the Huber-White sandwich estimator to obtain robust standard errors for the regression coefficients that accounted for the non-independence (i.e., clustering) of observations within hospitals. All analyses were performed using Stata 10 (College Station, TX).
We report results as unadjusted and risk-adjusted means and proportions, where the latter are estimated using the method of recycled predictions.20–25 This method is the most appropriate method for estimating the risk-adjusted mean value of an outcome variable from nonlinear regression models, because it enables us to estimate what each study outcome would have been at each study hospital in 2005 if the hospital’s patients had the same distribution of characteristics as the entire study population. We used the delta method to obtain standard errors for each hospital’s risk-adjusted means and proportions and to conduct statistical tests of pair-wise differences between hospitals in these outcomes.19, 26, 27 To ensure that these standard errors and tests also accounted for clustering, we applied the delta method to the robust variance-covariance matrix estimates obtained using the Huber-White estimator. A p-value of 0.05 or less was used as the criterion for statistical significance in all analyses, without adjustment for multiple comparisons due to differing views about the appropriate null hypothesis.28 The institutional review boards at all six study hospitals approved this study. The authors had full access to the data and take responsibility for its integrity. All authors have read and agree to the manuscript as written.
Results
Table 1 describes the demographic characteristics of the Looking Back and Looking Forward cohorts. The Looking Back cohort was older (82.0 years vs. 80.3 years), had a slightly lower proportion with Medicaid coinsurance (31.3% vs. 33.9%), and a higher proportion of Caucasians (74.6% vs. 71.9%) than the Looking Forward cohort. The demographic characteristics of the Looking Back cohort were derived from each patient’s first hospitalization, which may or may not have been for HF. As a result, the Looking Back cohort had a higher prevalence of surgical DRGs than the Looking Forward cohort (9.3% to 3.5%).
Table 1.
Patient Characteristics
| Characteristics | Looking Forward Cohort | Looking Back Cohort |
|---|---|---|
| Total (n) | 3,999 | 1,639 |
| Mean age | 80.3 (SD=8.2; 77.4 – 81.8) | 82.0 (SD=8.2; 78.3 – 83.9) |
| Male gender | 48.1% (43.7% – 50.8%) | 50.8% (36.3% – 55.6%) |
| Caucasian ethnicity | 71.9% (38.7% – 86.3%) | 74.6% (40.3% – 89.0%) |
| Hispanic ethnicity | 4.8% (0.0% – 10.6%) | 3.7% (0.0% – 6.1%) |
| Black ethnicity | 11.4% (3.3% –15.8%) | 10.4% (4.4% – 15.8%) |
| Other ethnicity | 11.9% (2.1% – 37.6%) | 11.3% (2.1% – 37.8%) |
| Medicaid coinsurance | 33.9% (7.4% – 55.8%) | 31.3% (7.3% –53.6%) |
| Surgical DRG | 3.5% (1.1% – 4.9%) | 9.3% (6.1% – 11.5%) |
| Site A | 11.4% | 12.0% |
| Site B | 4.6% | 5.6% |
| Site C | 19.1% | 19.6% |
| Site D | 13.2% | 13.1% |
| Site E | 13.4% | 14.3% |
| Site F | 38.3% | 35.6% |
Ranges are provided in parentheses across the six medical centers
We report the risk-adjusted mean values by site for mortality rates, total hospital days and indexed total direct hospital costs at 180-days (Table 2). We only analyzed adjusted mortality for the Looking Forward cohort (Figure 1). Across sites, the difference between the highest and lowest adjusted mortality increased with longer follow-up periods. The adjusted mortality estimates ranged from 2.2% to 4.7% for inpatient mortality, from 5.1% to 8.8% for 30-day mortality, and from 17.0% to 26.0% for 180-day mortality. There were no significant differences between sites for inpatient or 30-day mortality. However, the site with the lowest 180-day mortality (site F) was significantly lower than sites A, D, and E; site C also was significantly lower than site A.
Table 2.
180-Day Mortality: “Looking Forward” Cohorts
| “Looking Forward” |
|||
|---|---|---|---|
| Mortality |
|||
| 180-Day Mortality (adjusted) | |||
| Site | 180-Day Mortality (unadjusted) | Estimate | 95% CI |
| A | 21.7% | 26.0% a,g | (21.7% – 30.4%) |
| B | 21.9% | 22.7% | (16.5% – 28.9%) |
| C | 18.4% | 19.1% | (16.2% – 22.0%) |
| D | 21.6% | 22.9% b | (19.3% – 26.5%) |
| E | 20.5% | 21.6% c | (17.9% – 25.3%) |
| F | 19.1% | 17.0% | (15.1% – 18.8%) |
significantly different from site F at p<0.001
significantly different from site F at p<0.01
significantly different from site F at p<0.05
significantly different from site E at p<0.01
significantly different from site E at p<0.05
significantly different from site C at p<0.001
significantly different from site C at p<0.05
Figure 1.

Looking Forward Cohort Inpatient, 30-Day, and 180-Day Mortality Rates
Across sites, the adjusted mean number of hospital days at 180-days ranged from 9.1 days to 21.7 days for the Looking Back cohort, and from 7.8 days to 14.9 days for the Looking Forward cohort (Table 3 and Figure 2). This difference in ranges was 44% less in the Looking Forward cohort than in the Looking Back cohort (7.0 days versus 12.6 days, respectively). The rank order for total hospital days between the Looking Back and Looking Forward cohorts differed for 4 of the 6 sites; only the sites with the highest and lowest ranks stayed the same across cohorts (Table 4). The 4 sites that changed ranks did not significantly differ from each other on mean total hospital days in either cohort. Site F was significantly higher than all other sites in both cohorts, while site D also was significantly lower than sites C and E in the Looking Back cohort.
Table 3.
180-Day Total Hospital Days and Indexed Total Direct Costs: “Looking Forward” and “Looking Back” Cohorts
| “Looking Forward” | “Looking Back” | |||||
|---|---|---|---|---|---|---|
| Utilization | Utilization | |||||
| 180-Day Total Hospital Days (adjusted) | 180-Day Total Hospital Days (adjusted) | |||||
| Site | 180-Day Total Hospital Days (unadjusted) | Estimate | 95% CI | 180-Day Total Hospital Days (unadjusted) | Estimate | 95% CI |
| A | 8.25 | 8.24 a | (7.25 – 9.23) | 11.18 | 11.08 a | (8.93 – 13.23) |
| B | 8.53 | 9.54 a | (7.22 – 11.85) | 9.96 | 10.27 a | (6.36 – 14.19) |
| C | 8.98 | 8.79 a | (7.96 – 9.62) | 11.71 | 12.58 a | (10.38 – 14.78) |
| D | 7.55 | 7.84 a | (6.92 – 8.76) | 8.62 | 9.14 a,d,g | (7.23 – 11.06) |
| E | 8.34 | 8.82 a | (7.92 – 9.71) | 12.27 | 13.39 a | (11.16 – 15.63) |
| F | 15.38 | 14.86 | (13.96 – 15.77) | 23.78 | 21.73 | (19.66 – 23.79) |
| 180-Day Indexed Total Direct Costs (adjusted) | 180-Day Indexed Total Direct Costs (adjusted) | |||||
| Site | 180-Day Indexed Total Direct Costs (unadjusted) | Estimate | 95% CI | 180-Day Indexed Total Direct Costs (unadjusted) | Estimate | 95% CI |
| A | 0.77 | 0.75 a,g | (0.64 – 0.85) | 1.07 | 0.97 a,e | (0.72 – 1.23) |
| B | 0.85 | 0.83 a | (0.63 – 1.04) | 0.99 | 0.95 b | (0.42 – 1.48) |
| C | 0.92 | 0.90 a | (0.81 – 0.99) | 1.15 | 1.26 b | (0.96 – 1.55) |
| D | 0.65 | 0.66 a,d,f | (0.57 – 0.76) | 0.83 | 0.91 a,d | (0.69 – 1.14) |
| E | 0.85 | 0.87 a | (0.77 – 0.97) | 1.31 | 1.39 c | (1.13 – 1.65) |
| F | 1.30 | 1.30 | (1.21 – 1.39) | 1.89 | 1.79 | (1.61 – 1.97) |
significantly different from site F at p<0.001
significantly different from site F at p<0.01
significantly different from site F at p<0.05
significantly different from site E at p<0.01
significantly different from site E at p<0.05
significantly different from site C at p<0.001
significantly different from site C at p<0.05
Figure 2.

180-Day Total Hospital Days for the Looking Back and Looking Forward Cohorts
Table 4.
Ranks for 180-Day Mortality, Total Hospital Days, and Indexed Total Direct Costs: “Looking Forward” and “Looking Back” Cohorts
| Cohort | Outcome | Rank Measure | Site A | Site B | Site C | Site D | Site E | Site F |
|---|---|---|---|---|---|---|---|---|
| “Looking Forward” | 180-Day Total Hospital Days | Point Estimate of Rank | 2 | 5 | 3 | 1 | 4 | 6 |
| Mean Rank | 2.25 | 4.15 | 3.47 | 1.53 | 3.60 | 6.00 | ||
| Standard Deviation | 1.05 | 1.28 | 0.98 | 0.82 | 1.00 | 0.00 | ||
| 180-Day Indexed Total Direct Costs | Point Estimate of Rank | 2 | 3 | 5 | 1 | 4 | 6 | |
| Mean Rank | 2.20 | 3.27 | 4.33 | 1.19 | 4.02 | 6.00 | ||
| Standard Deviation | 0.67 | 1.19 | 0.74 | 0.43 | 0.77 | 0.03 | ||
| 180-Day Mortality | Point Estimate of Rank | 6 | 4 | 2 | 5 | 3 | 1 | |
| Mean Rank | 5.58 | 4.10 | 2.27 | 4.25 | 3.63 | 1.17 | ||
| Standard Deviation | 0.71 | 1.41 | 0.78 | 0.97 | 1.03 | 0.41 | ||
| “Looking Back” | 180-Day Total Hospital Days | Point Estimate of Rank | 3 | 2 | 4 | 1 | 5 | 6 |
| Mean Rank | 2.77 | 2.39 | 3.92 | 1.38 | 4.54 | 6.00 | ||
| Standard Deviation | 0.87 | 1.23 | 0.84 | 0.58 | 0.67 | 0.00 | ||
| 180-Day Indexed Total Direct Costs | Point Estimate of Rank | 3 | 2 | 4 | 1 | 5 | 6 | |
| Mean Rank | 2.29 | 2.33 | 3.92 | 1.80 | 4.69 | 5.98 | ||
| Standard Deviation | 0.88 | 1.34 | 0.78 | 0.75 | 0.58 | 0.16 |
Mean rank and standard deviations are calculated over 1000 iterations
Across sites, the adjusted mean indexed value of total direct hospital costs at 180-days ranged from 0.91 to 1.79 for the Looking Back cohort, and from 0.66 to 1.30 for the Looking Forward cohort (Table 3 and Figure 3). This difference in ranges for non-indexed values was 27% less in the Looking Forward cohort than in the Looking Back cohort. The rank order for total direct costs between the Looking Back and Looking Forward cohorts differed for 4 of the 6 sites; only the sites with the highest and lowest ranks stayed the same across cohorts (Table 4). Of the 4 sites that changed ranks, two pairs switched rank orders. These pairs did not significantly differ from each other on mean total direct costs in either cohort. Site F was significantly higher than all sites, and site D was significantly lower from site E, in both cohorts. In addition, site E was significantly higher than site A in the Looking Back cohort, and site C was significantly higher from sites A and D in the Looking Forward cohort.
Figure 3.
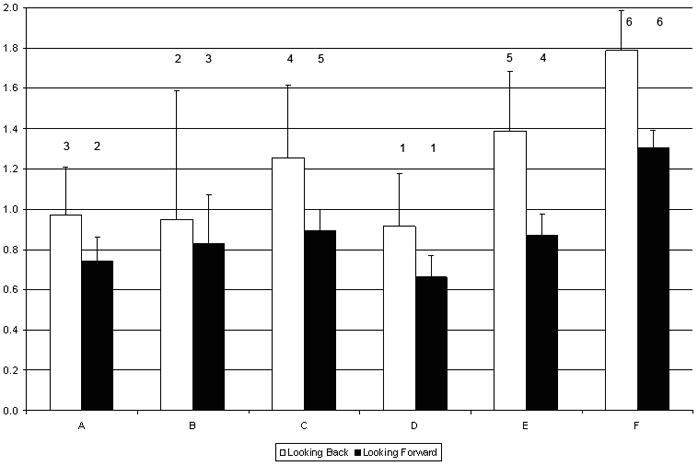
180-Day Indexed Total Direct Costs for the Looking Back and Looking Forward
For the Looking Forward cohort, the Spearman rank correlation coefficient between adjusted mortality and adjusted total hospital days at 180-days was −0.68 (p = 0.12), and between adjusted mortality and adjusted indexed total direct costs at 180-days was −0.93 (p < 0.01). Site F had the highest hospital utilization by both measures, but it also had the lowest mortality. Dropping site F from the analysis changed the correlation estimates for the 180-day outcomes to −0.45 (p = 0.43) and −0.88 (p = 0.04), respectively. Similarly, the Spearman rank correlation coefficient between adjusted 180-day mortality and adjusted initial hospitalization total hospital days was −0.45 (p = 0.36), and between adjusted 180-day mortality and adjusted initial hospitalization indexed total direct costs was −0.87 (p = 0.02). The Spearman rank correlation coefficients between the Looking Forward and Looking Back cohorts were 0.62 (p = 0.17) for adjusted total hospital days (Figure 4) and 0.87 (p = 0.02) for adjusted indexed total direct costs at 180-days (Figure 5).
Figure 4.
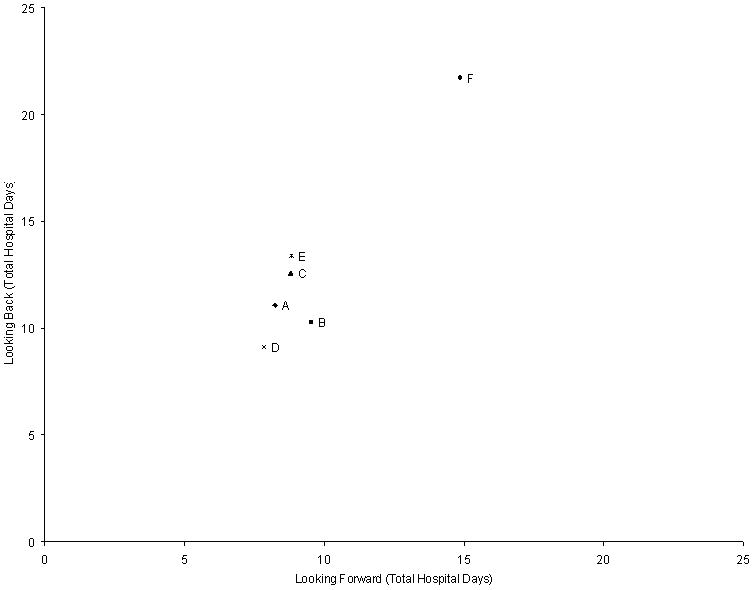
180-Day Total Hospital Days for the Looking Back and Looking Forward Cohorts
Figure 5.
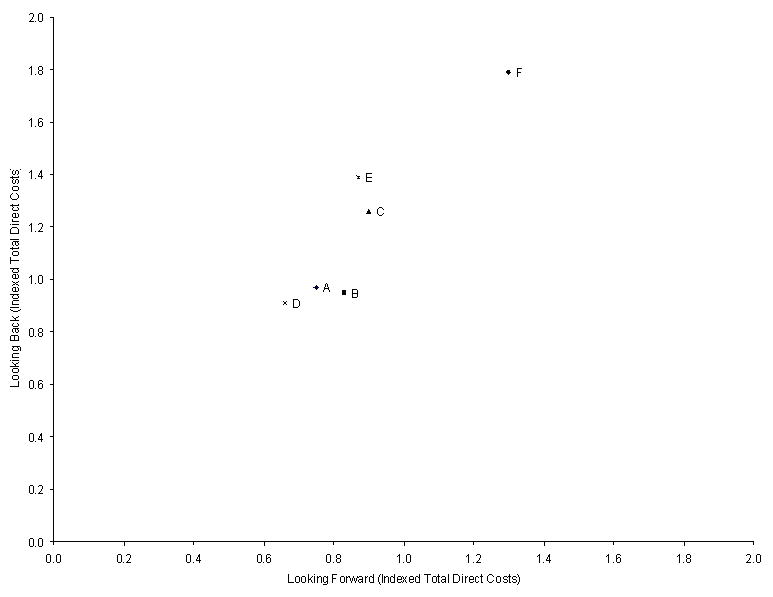
180-Day Indexed Total Direct Costs for the Looking Back and Looking Forward Cohorts
Sensitivity analyses
We conducted the following sensitivity analyses to assess the robustness of our findings: (1) analyses of the Looking Forward and Looking Back cohorts that included individuals with missing cost data (Appendix 2), (2) analyses that used total costs instead of direct costs (Appendix 3), (3) analyses that included initial hospitalizations for patients transferred from other hospitals, transplant patients, and patients in surgical DRGs besides valve replacement or pacemaker placement (Appendix 4), (4) analyses of the Looking Forward cohort using all initial HF hospitalizations, including multiple initial hospitalizations for the same patient (Appendix 5), and (5) analyses of subsamples from the Looking Forward and Looking Back cohorts that included clinical laboratory values at admission (blood urea nitrogen, serum creatinine) as covariates in the multivariate regression models (Appendix 6). We did not use laboratory values in the main analyses as they were available only for an unevenly distributed subset of patients. We found that the results of the sensitivity analyses exhibited the same patterns as the findings of the main analyses (data not shown). In addition, associations between adjusted outcome variables at the hospital level were very similar, in both magnitude and statistical significance, when we estimated weighted Pearson correlations instead of Spearman rank correlations (e.g., r = −0.79 [p = 0.046] between adjusted mortality and adjusted total hospital days; r = −0.86 [p = 0.017] between adjusted mortality and adjusted indexed total direct costs at 180-days).
Discussion
Prior studies of variation in hospital resource utilization that focus only on expired patients have been interpreted to mean that hospitals with low resource utilization should be regarded as performance benchmarks. Our findings agree with previous investigators that such benchmarking based only on expired individuals should be viewed with caution,29 particularly when benchmarking is extrapolated beyond expired individuals.4–6 First, and most importantly, this study identified substantial variation among the 6 study hospitals on adjusted mortality rates in the Looking Forward cohort, particularly when observed for 180-days after the initial admission. This health outcome variation also was inversely correlated with resource utilization variation, meaning that hospitals with higher adjusted resource utilization within 180 days after an initial hospitalization also had lower adjusted mortality.
Second, the patterns of resource utilization across hospitals were not the same between the Looking Forward and Looking Back cohorts; the only consistent pattern was that site 6 had the highest level and site 4 had the lowest level of resource utilization in both cohorts, when measured by either utilization measure. However, changes in rank order occurred among sites that did not significantly differ from each other; simple reporting of means without accounting for significant differences, while simpler for general audiences, may result in incorrect assumptions that sites truly differ from each other on utilization measures. Further, the study hospitals varied considerably in the size of the difference between risk-adjusted utilization measures derived from all patients and measures derived only from expired patients.
The 1.5-fold difference across the six study hospitals in risk-adjusted 180-day mortality among elderly Medicare patients hospitalized for HF challenges the notion that studies of expired patients provide valid and useful information on hospital efficiency, which should be measured by both resource utilization and health outcomes. Although prior studies have demonstrated mortality variation across hospitals for HF patients,7 we also found negative correlations between measures of resource utilization and 180-day mortality across the study hospitals. While we do not intend to suggest that this correlation implies a causal relationship between more resources and better outcomes, it does suggest a need for further work to explore how care processes and resource utilization during an initial hospitalization and subsequent visits influence health outcomes. Although hospitals with excellent adherence to evidence-based process measures30 have slightly lower risk-adjusted mortality than hospitals with poorer adherence,7, 31 these widely accepted process measures are unlikely to drive the substantial differences in resource utilization that we observed across teaching hospitals in a single state.
The authors of prior studies of variations in hospital resource utilization have acknowledged that utilization must be weighed with outcomes to assess efficiency, the common practice of restricting analyses to expired individuals (which is represented with our “Looking Back” approach) ignores outcome differences and overlooks the real possibility that resource utilization influences outcomes. The relationship between hospital efficiency and quality of care is complex,32–36 and focusing on expired individuals is likely to be overly simplistic. Appropriate estimation of the value of health care spending requires assessment of potential outcome differences, and cannot be done with a “Looking Back” approach. We believe that future studies should use the “Looking Forward” approach to ensure that important outcomes are not missed. Furthermore, clinicians have very limited ability to identify patients who are destined to die within six months and selectively withhold health care resources from those patients.37–39 Although studying only expired patients is expedient due to human subject protection issues that apply only to living individuals,40 a better solution is to study databases that include all individuals and to not ignore health outcomes.
The methods we employed differed in several ways from the methods used in prior studies of variations in hospital resource utilization, but in most cases the changes in methods strengthened the study. Notably, we examined patients with a principal diagnosis of HF, whereas prior studies included patients with a principal or secondary diagnosis of HF. We chose to be more restrictive in order to enhance the clinical homogeneity of the study cohort, since resource utilization patterns are likely to be driven by the principal diagnosis. For instance, use of resources to care for a patient who is hospitalized for hip fracture will differ from the use of resources to care for a patient who is hospitalized for HF, even if the hip fracture patient receives some treatment for HF. Similarly, we excluded patients whose clinical characteristics were likely to skew utilization patterns. Transfer11–14 and transplant patients41–43 often have unmeasured severity of illness beyond what can be captured by diagnosis codes or comorbid conditions.44 Hospitalizations associated with surgery incur additional resource utilization and convalescence that occurs with surgical procedures. Future studies should exclude these types of patients, since these types of patients can vary substantially across hospitals. Of note, although the proportion of patients in the excluded categories varied substantially across hospitals, sensitivity analyses that included these patients also found substantial health outcome variation between sites that were inversely correlated with resource utilization variation.
We also expanded on the risk-adjustment methodology used by prior studies of variations in hospital resource utilization,1–3 which only adjusted for age, gender, ethnicity, and the presence of 12 chronic conditions. Our regression models adjusted for age; gender; ethnicity; 21 comorbid conditions; dual Medicaid eligibility (to partially account for socioeconomic status); and admission year (to account for secular trends in clinical practice). In addition, we performed sensitivity analyses that adjusted for selected clinical laboratory values as well. Risk-adjustment methods using administrative data are subject to potential biases from unmeasured risk factors and other differences in care.45 Although the risk-adjustment methods we used cannot capture all differences across HF patients at different hospitals, we use a comprehensive list of covariates that are similar to other validated risk adjustment models for heart failure, 45 and we also find similar results with our sensitivity analyses using clinical laboratory values that may capture some of these unmeasured risk factors.
Our study has additional limitations. First, excluding individuals with missing cost data could affect internal validity of this study if there was a systematic pattern of missingness, such as related to severity of illness. However, the underlying cause of missing cost data was due to a known variable (in this case, time), and inclusion of these individuals actually strengthens our findings of mortality differences between sites (Appendix 2).
Second, because we used administrative data from the six study hospitals, we were unable to identify hospitalizations at other hospitals or include them in our calculations of resource utilization. However, prior studies suggest very high “hospital loyalty” among patients hospitalized for chronic illnesses;46 specifically, these studies found that chronically ill patients who were hospitalized in any of our six study hospitals had 80–90% of their total hospital days in the same hospital.47
Third, due to lack of data, our study could not account for outpatient utilization. It is possible that the rank ordering of hospitals on resource utilization and the relationship between resource utilization and mortality would have changed if we had been able to include outpatient care.
Fourth, by counting hospital days and costs for all hospitalizations during the 180-day period of analysis for each patient, we included resource utilization that may not be directly attributable to the study condition, HF. However, we adopted this approach for comparability with prior studies, and analyses of days and costs for initial hospitalizations alone found similar variation across hospitals as our main analyses.
Fifth, even the direct cost values from one site may incorporate other costs (e.g., teaching costs) that would have been attributed differently at another site. However, the similar associations observed between 180-day mortality and both resource utilization measures, total direct costs and total hospital days, suggest that total direct costs are a reasonable representation of resource utilization.
Finally, our results may not generalize to smaller hospitals and nonteaching hospitals, which did not participate in our study. Nonetheless, our findings suggest that focusing only on expired patients may lead to different ranking of hospitals with regard to resource utilization. More importantly, these studies ignore potentially large differences in health outcomes among chronically ill patients. Further studies should be conducted that include these and other hospitals to determine whether similar findings occur.
Assessing hospital efficiency requires that we consider outputs as well as inputs, that is, health outcomes as well as resource utilization. Contrary to public discussion of variation,4–6 it is likely that not all variation is inefficient or wasteful. However, much more work is needed to truly distinguish inefficient from beneficial resource utilization. The six hospitals involved in our study are currently investigating the underlying processes and practices that contribute to the variation in resource utilization and outcomes for HF that we identified. Their goal is to improve the outcomes of patients with HF and to provide care to those patients as efficiently as possible.
What is known
Substantial variation has been documented among hospitals in the resources used to care for elderly Medicare beneficiaries with chronic illnesses during the last 6 months of life.
By only including individuals who have died in the analyses, researchers cannot identify differences on health outcomes such as survival.
What this article adds
This study found variation among California teaching hospitals in survival for patients hospitalized with heart failure. This variation would have been overlooked by a study that only examined heart failure patients who died.
When analyzing all patients hospitalized for heart failure, California teaching hospitals that used more resources had lower mortality rates.
When analyzing all patients hospitalized for heart failure, the variation in resource use among California teaching hospitals was 27% to 44% less than the variation observed when analyzing only heart failure patients who died.
Supplementary Material
Acknowledgments
We gratefully acknowledge our funding from the California Health Care Foundation (06-1311), and the in-kind support from the 6 medical centers included in the study. Dr Mangione received support from the Resource Centers for Minority Aging Research/Center for Health Improvement of Minority Elderly (RCMAR/CHIME) funded by National Institutes of Health/National Institute on Aging (P30 AG021684) and from the UCLA Older Americans Independence Center funded by the National Institutes of Health/National Institute on Aging (5 P30 AG028748).
Funding Sources
We gratefully acknowledge our funding from the California Health Care Foundation (06-1311), and the in-kind support from the six medical centers included in the study. Dr. Mangione’s work on this project was partially supported by the University of California Los Angeles Resource Center for Minority Aging Research (National Institute of Aging P30AG021684).
Footnotes
Disclosures
The authors report no conflicts.
References
- 1.Dartmouth Atlas of Health Care. The Care of Patients with Severe Chronic Illness. Hanover, NH: Center for the Evaluative Clinical Sciences, Dartmouth Medical School; 2006. [Google Scholar]
- 2.Dartmouth Atlas of Health Care. Tracking the Care of Patients with Severe Chronic Illness. Lebanon, NH: The Dartmouth Institute for Health Policy and Clinical Practice; 2008. [PubMed] [Google Scholar]
- 3.Wennberg JE, Fisher ES, Baker L, Sharp SM, Bronner KK. Evaluating The Efficiency Of California Providers In Caring For Patients With Chronic Illnesses. Health Affairs (Millwood) 2005;(Supplemental Web Exclusives):526–43. doi: 10.1377/hlthaff.w5.526. [DOI] [PubMed] [Google Scholar]
- 4.Brownlee S. Overtreated. New York: Bloomsbury USA; 2007. [Google Scholar]
- 5.New York Times Editorial. Quality Care at Bargain Prices. New York Times; 2008. [Google Scholar]
- 6.Pear R. Researchers Find Huge Variations in End-of-Life Treatment New York Times. 2008 [Google Scholar]
- 7.Krumholz HM, Normand S-LT, Spertus JA, Shahian DM, Bradley EH. Measuring Performance For Treating Heart Attacks And Heart Failure: The Case For Outcomes Measurement. Health Affairs (Millwood) 2007;26:75–85. doi: 10.1377/hlthaff.26.1.75. [DOI] [PubMed] [Google Scholar]
- 8.Iezzoni LI, Heeren T, Foley SM, Daley J, Hughes J, Coffman GA. Chronic conditions and risk of in-hospital death. Health Services Research. 1994;29:435–460. [PMC free article] [PubMed] [Google Scholar]
- 9.Goff DC, Jr, Pandey DK, Chan FA, Ortiz C, Nichaman MZ. Congestive heart failure in the United States: is there more than meets the I(CD code)? The Corpus Christi Heart Project. Archives of Internal Medicine. 2000;160:197–202. doi: 10.1001/archinte.160.2.197. [DOI] [PubMed] [Google Scholar]
- 10.Manitoba Centre for Health Policy. Surgical/Medical/Obstetrical Inpatient Identification. http://www.umanitoba.ca/centres/mchp/concept/dict/surgmed_inpt.html.
- 11.Bernard AM, Hayward RA, Rosevear J, Chun H, McMahon LF. Comparing the hospitalizations of transfer and non-transfer patients in an academic medical center. Academic Medicine. 1996;71:262–266. doi: 10.1097/00001888-199603000-00019. [DOI] [PubMed] [Google Scholar]
- 12.Escarce JJ, Kelley MA. Admission source to the medical intensive care unit predicts hospital death independent of APACHE II score. JAMA. 1990;264:2389–2394. [PubMed] [Google Scholar]
- 13.Gordon HS, Rosenthal GE. Impact of interhospital transfers on outcomes in an academic medical center. Implications for profiling hospital quality. Medical Care. 1996;34:295–309. doi: 10.1097/00005650-199604000-00002. [DOI] [PubMed] [Google Scholar]
- 14.Rosenberg AL, Hofer TP, Strachan C, Watts CM, Hayward RA. Accepting Critically Ill Transfer Patients: Adverse Effect on a Referral Center’s Outcome and Benchmark Measures. Annals of Internal Medicine. 2003;138:882–890. doi: 10.7326/0003-4819-138-11-200306030-00009. [DOI] [PubMed] [Google Scholar]
- 15.Kahn KL, Keeler EB, Sherwood MJ, Rogers WH, Draper D, Bentow SS, Reinisch EJ, Rubenstein LV, Kosecoff J, Brook RH. Comparing outcomes of care before and after implementation of the DRG-based prospective payment system. JAMA. 1990;264:1984–1988. [PubMed] [Google Scholar]
- 16.Agency for Healthcare Research and Quality. HCUP Comorbidity Software, Version 3.2. http://www.hcup-us.ahrq.gov/toolssoftware/comorbidity/comorbidity.jsp.
- 17.Baldwin LM, Klabunde CN, Green P, Barlow W, Wright G. In search of the perfect comorbidity measure for use with administrative claims data: does it exist? Medical Care. 2006;44:745–753. doi: 10.1097/01.mlr.0000223475.70440.07. [DOI] [PMC free article] [PubMed] [Google Scholar]
- 18.Grogger JT, Carson RT. Models for truncated counts. Journal of Applied Econometrics. 1991;6:225–238. [Google Scholar]
- 19.StataCorp. Stata Statistical Software: Release 10. College Station, TX: StataCorp LP; 2007. [Google Scholar]
- 20.Graubard BI, Korn EL. Predictive margins with survey data. Biometrics. 1999;55:652–659. doi: 10.1111/j.0006-341x.1999.00652.x. [DOI] [PubMed] [Google Scholar]
- 21.Basu A, Meltzer D. Implications of spillover effects within the family for medical cost-effectiveness analysis. Journal of Health Economics. 2005;24:751–773. doi: 10.1016/j.jhealeco.2004.12.002. [DOI] [PubMed] [Google Scholar]
- 22.Davern M, Rodin H, Blewett LA, Call KT. Are the Current Population Survey uninsurance estimates too high? An examination of the imputation process. Health Services Research. 2007;42:2038–2055. doi: 10.1111/j.1475-6773.2007.00703.x. [DOI] [PMC free article] [PubMed] [Google Scholar]
- 23.Heslin KC, Andersen RM, Ettner SL, Cunningham WE. Racial and ethnic disparities in access to physicians with HIV-related expertise. Journal of General Internal Medicine. 2005;20:283–289. doi: 10.1111/j.1525-1497.2005.40109.x. [DOI] [PMC free article] [PubMed] [Google Scholar]
- 24.Liao TF. Interpreting Probability Models: Logit, Probit, and Other Generalized Linear Models. Newbury Park, CA: Sage Publications; 1994. [Google Scholar]
- 25.Manning WG, Newhouse JP, Duan N, Keeler EB, Leibowitz A. Health Insurance and the Demand for Medical Care: Evidence from a Randomized Experiment. The American Economic Review. 1987;77:251–277. [PubMed] [Google Scholar]
- 26.Greene WH. Econometric Analysis. 6. Upper Saddle River, NJ: Pearson Prentice Hall; 2008. [Google Scholar]
- 27.Bishop YMM, Fienberg SE, Holland PW. Discrete multivariate analysis: theory and practice. Cambridge, MA: MIT Press; 1975. (with the collaboration of Light RJ & Mosteller F) [Google Scholar]
- 28.Rothman KJ. No adjustments are needed for multiple comparisons. Epidemiology. 1990;1:43–46. [PubMed] [Google Scholar]
- 29.Bach PB, Schrag D, Begg CB. Resurrecting treatment histories of dead patients: a study design that should be laid to rest. JAMA. 2004;292:2765–2770. doi: 10.1001/jama.292.22.2765. [DOI] [PubMed] [Google Scholar]
- 30.Centers for Medicare and Medicaid Services. [Accessed July 4, 2008];Hospital Compare. http://www.hospitalcompare.hhs.gov.
- 31.Werner RM, Bradlow ET. Relationship Between Medicare’s Hospital Compare Performance Measures and Mortality Rates. JAMA. 2006;296:2694–2702. doi: 10.1001/jama.296.22.2694. [DOI] [PubMed] [Google Scholar]
- 32.Ayanian JZ, Weissman JS. Teaching hospitals and quality of care: a review of the literature. Milbank Quarterly. 2002;80:569–593. doi: 10.1111/1468-0009.00023. [DOI] [PMC free article] [PubMed] [Google Scholar]
- 33.Fleming ST. The relationship between the cost and quality of hospital care: a review of the literature. Medical Care Review. 1990;47:487–502. doi: 10.1177/107755879004700405. [DOI] [PubMed] [Google Scholar]
- 34.Morey RC, Fine DJ, Loree SW, Retzlaff-Roberts DL, Tsubakitani S. The trade-off between hospital cost and quality of care. An exploratory empirical analysis. Medical Care. 1992;30:677–698. doi: 10.1097/00005650-199208000-00002. [DOI] [PubMed] [Google Scholar]
- 35.Siegrist RB, Jr, Kane NM. Exploring the relationship between inpatient hospital costs and quality of care. American Journal of Managed Care. 2003;9:SP43–49. [PubMed] [Google Scholar]
- 36.Thomas JW, Guire KE, Horvat GG. Is patient length of stay related to quality of care? Hospital & Health Services Administration. 1997;42:489–507. [PubMed] [Google Scholar]
- 37.Poses RM, Smith WR, McClish DK, Huber EC, Clemo FL, Schmitt BP, Alexander-Forti D, Racht EM, Colenda CC, 3rd, Centor RM. Physicians’ survival predictions for patients with acute congestive heart failure. Archives of Internal Medicine. 1997;157:1001–1007. [PubMed] [Google Scholar]
- 38.Sinuff T, Adhikari NK, Cook DJ, Schunemann HJ, Griffith LE, Rocker G, Walter SD. Mortality predictions in the intensive care unit: comparing physicians with scoring systems. Critical Care Medicine. 2006;34:878–885. doi: 10.1097/01.CCM.0000201881.58644.41. [DOI] [PubMed] [Google Scholar]
- 39.Detsky AS, Stricker SC, Mulley AG, Thibault GE. Prognosis, survival, and the expenditure of hospital resources for patients in an intensive-care unit. New England Journal of Medicine. 1981;305:667–672. doi: 10.1056/NEJM198109173051204. [DOI] [PubMed] [Google Scholar]
- 40.Code of Federal Regulations. Protection of Human Subjects. Department of Health and Human Services; 2005. p. 45. [Google Scholar]
- 41.Angus DC, Clermont G, Kramer DJ, Linde-Zwirble WT, Pinsky MR. Short-term and long-term outcome prediction with the Acute Physiology and Chronic Health Evaluation II system after orthotopic liver transplantation. Critical Care Medicine. 2000;28:150–156. doi: 10.1097/00003246-200001000-00025. [DOI] [PubMed] [Google Scholar]
- 42.Sadaghdar H, Chelluri L, Bowles SA, Shapiro R. Outcome of renal transplant recipients in the ICU. Chest. 1995;107:1402–1405. doi: 10.1378/chest.107.5.1402. [DOI] [PubMed] [Google Scholar]
- 43.Sawyer RG, Durbin CG, Rosenlof LK, Pruett TL. Comparison of APACHE II scoring in liver and kidney transplant recipients versus trauma and general surgical patients in a single intensive-care unit. Clinical Transplantation. 1995;9:401–405. [PubMed] [Google Scholar]
- 44.Iezzoni LI. The risks of risk adjustment. JAMA. 1997;278:1600–1607. doi: 10.1001/jama.278.19.1600. [DOI] [PubMed] [Google Scholar]
- 45.Krumholz HM, Wang Y, Mattera JA, Wang Y, Han LF, Ingber MJ, Roman S, Normand SL. An administrative claims model suitable for profiling hospital performance based on 30-day mortality rates among patients with heart failure. Circulation. 2006;113:1693–1701. doi: 10.1161/CIRCULATIONAHA.105.611194. [DOI] [PubMed] [Google Scholar]
- 46.Wennberg JE, Fisher ES, Stukel TA, Skinner JS, Sharp SM, Bronner KK. Use of hospitals, physician visits, and hospice care during last six months of life among cohorts loyal to highly respected hospitals in the United States. BMJ. 2004;328:607–611. doi: 10.1136/bmj.328.7440.607. [DOI] [PMC free article] [PubMed] [Google Scholar]
- 47. [Accessed March 11, 2008];Hospital performance reports by state: California. 2006 http://www.dartmouthatlas.org/data/download/perf_reports/CA_HOSP_perfrpt.pdf.
Associated Data
This section collects any data citations, data availability statements, or supplementary materials included in this article.