

Abstract
Objectives. We systematically reviewed the effects of alcohol taxes and prices on alcohol-related morbidity and mortality to assess their public health impact.
Methods. We searched 12 databases, along with articles’ reference lists, for studies providing estimates of the relationship between alcohol taxes and prices and measures of risky behavior or morbidity and mortality, then coded for effect sizes and numerous population and study characteristics. We combined independent estimates in random-effects models to obtain aggregate effect estimates.
Results. We identified 50 articles, containing 340 estimates. Meta-estimates were r = −0.347 for alcohol-related disease and injury outcomes, −0.022 for violence, −0.048 for suicide, −0.112 for traffic crash outcomes, −0.055 for sexually transmitted diseases, −0.022 for other drug use, and −0.014 for crime and other misbehavior measures. All except suicide were statistically significant.
Conclusions. Public policies affecting the price of alcoholic beverages have significant effects on alcohol-related disease and injury rates. Our results suggest that doubling the alcohol tax would reduce alcohol-related mortality by an average of 35%, traffic crash deaths by 11%, sexually transmitted disease by 6%, violence by 2%, and crime by 1.4%.
Alcohol prices and taxes are rising issues on the agenda of state and local health officials and policymakers because of historically low real alcohol tax rates, political opposition to increased income and property taxes, increasing budget shortfalls, and positive experience with tobacco tax increases. Moreover, the knowledge base on alcohol tax effects is much larger than most health officials and policymakers realize. Over the past several decades, 162 papers have been published that evaluate the effects of alcohol tax and price levels on alcohol sales, drinking, and a range of alcohol-related morbidity and mortality outcomes. We recently presented the cumulative evidence from 112 papers containing 1003 estimates of effects of alcohol taxes and prices on alcohol sales and drinking behaviors; we found statistically significant inverse relationships for all 3 major beverages (beer, wine, and spirits).1 The major conclusion emerging from those 112 studies was that a 10% increase in alcohol prices resulted in an approximately 5% reduction in drinking.
A large epidemiological literature covering many decades shows drinking to be a risk factor for a wide range of injuries, diseases, and social disruption,2–4 and considerable consensus has emerged on approximate alcohol-attributable fractions for several leading causes of morbidity and mortality.5,6 Because the link between alcohol tax and price levels and drinking (including heavy drinking) is so well established, along with the association of individual and population drinking levels with several indicators of morbidity and mortality, we hypothesized an effect of alcohol tax and price levels on morbidity and mortality. Therefore, we systematically reviewed the literature and calculated overall estimates of effect between alcohol tax or price changes and the range of alcohol-related morbidity and mortality outcomes reported in the literature.
METHODS
A doctoral student with expertise in econometric methods conducted a comprehensive search of the published literature in 12 databases: AgEcon Search (1960–2009); Blackwell-Synergy (1879–2009); EBSCO Host, which includes EconLit (1969–2009); Academic Search Premier (1922–2009); Business Source Premier (1922–2009); PsychInfo (1967–2009); JSTOR (1838–2009); MEDLINE (1950–2009); Springer (1992–2009); ScienceDirect (1823–2009); Thomson Reuters ISI Web of Knowledge (1900–2009); and Wiley (1961–2009).
Our search terms for each database were as follows, where * was the truncation indicator to include all forms of the root word: [(tax OR taxes OR taxation OR cost OR cost* OR price OR prices) AND (alcohol* OR drinking OR liquor OR drunk* OR beer OR wine OR spirits OR malt beverage*)]. Any record with any search term in the title, keywords, subject heading, descriptors, or abstract fields was identified. In addition, we located additional relevant studies in the reference lists of the selected articles.
We obtained each article and reviewed it for relevance and content. Studies were excluded from analysis if they were (1) duplicate publications of a single study or data set (most recent was retained); (2) empirical studies that did not provide sufficient data for calculating some form of numeric estimate of effect and estimate of its standard error; (3) commentaries, legal reviews, or literature reviews, or articles that for another reason reported no new data; or (4) not written in English.
Data Classification and Coding
Studies eligible for inclusion in the analyses assessed effects of alcohol prices or taxes on a range of morbidity and mortality outcomes. Much of the literature treats various tax or price indices as alternative measures of the same underlying phenomenon, especially because spatial variability and sudden changes in price over time are largely attributable to differing alcohol excise taxes.
Individual studies identified in our search had considerable variation in quality, specific measures, research designs, and statistical models. However, all studies were conceptually similar and provided results from some sort of regression equation showing estimated coefficients and standard errors or other statistics that indicate the standard error, such as a t ratio or confidence interval. We coded the measure of effect, its standard error, the analysis sample size, and the effect's significance level for each separate estimate.
For studies that reported significance cutoff values (e.g., .05) but not exact values, we (conservatively) assigned the value .05, even though the (unknown) exact value was less than .05. We coded all relevant estimates from each article, including results from multiple subgroups, multiple follow-ups, and multiple statistical models for each subgroup.
Statistical Analyses
We used Comprehensive Meta-analysis 2.0 software7 to estimate a standardized effect size r for each separate estimate of the underlying relationship of interest, calculated from the statistics reported in each study and preprogrammed conversion formulas from the meta-analysis statistical literature. The r estimates are interpretable as the standardized slope of the relationship between the independent variable and the outcome variable. We examined heterogeneity of effects and conducted sensitivity and robustness analyses to evaluate the consistency of estimates across study characteristics and risks to the meta-estimates attributable to publication bias and potential nonrepresentativeness of the sample studies.
We combined individual effect sizes in 4 steps to produce a single meta-estimate of effect for each outcome. First, we identified sets of statistically independent estimates (e.g., separate youth and adult samples, separate states) and nonindependent estimates (e.g., multiple estimation models derived from the same population or sample). Intrastudy estimates that were not independent were averaged such that only 1 value contributed to the meta-analysis. We then applied inverse variance–weighting methods to each resulting independent effect size.8
Second, we examined effect size distributions for outliers, to determine the need for trimming (i.e., deletion of outliers) or winsorizing (i.e., transformations to reduce effects of outliers). Next, we calculated the weighted mean effect sizes for each subgroup as 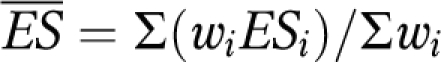 , where ESi were the values of the effect size statistic used (here r), wi was the inverse variance weight for each effect size i, and i was equal to 1 – k, with k being the number of effect estimates. Last, we conducted homogeneity tests within and across subgroups with the Q statistic,9 where a statistically significant Q indicated a heterogeneous effect size distribution.10
As anticipated, we observed statistically significant study-level heterogeneity and therefore adopted a random-effects model to determine the average meta-estimates of effect and their precision.8 We constructed confidence intervals (CIs) and tested the significance of each mean effect size, where a 95% CI was 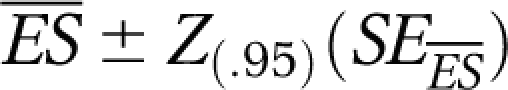 and the significance of the mean effect size was obtained with a Z test as
  .
.
The calculated standardized effect size r was not uniformly derived from reported simple bivariate estimates of the underlying relationship of interest (alcohol price/tax→outcome), because such bivariate correlations were rarely reported. We also did not calculate effects via a multiple regression model with identical model forms and covariates across studies. This procedure is inherent to any literature where a single straightforward uniform research design is not typical (by contrast with meta-analyses of a large set of similarly designed randomized clinical trials). As a result, the statistical theory and accompanying assumptions that underlie the calculation and accumulation of standardized effect sizes were not fully met. Therefore, we also reported alternative, simpler summary statistics, such as the proportion of individual estimates in the hypothesized direction and the proportion that was significant, to provide additional information about the underlying estimates.
We grouped the diverse set of outcome measures reported in the literature into 8 conceptually distinct categories: specific measures of alcohol-related disease or injury, other morbidity and mortality indicators, violence, suicide, traffic crashes and alcohol-related driving measures, sexually transmitted diseases (STDs) and risky sexual behavior, other drug use, and crime and misbehavior indicators. However, any grouping of the estimates and outcomes combined somewhat disparate outcomes and contexts. Therefore, we also calculated the effect size and specific outcome from each study separately. Obviously, differences in estimated effect size from study to study may have been attributable to the specific outcome measures used or local differences in samples and contexts of a given study.
RESULTS
We identified 50 papers containing 340 estimates of the effects of alcohol taxes or prices (Table 1).11–60 Studies were diverse in the units analyzed (state–country aggregate vs individual-level data), outcome measures, settings, time, statistical models, independent variable measure (alcohol prices or taxes), and population (adults or youths or both). The meta-estimate of effect for all of the studies across all outcomes combined was r = −0.071 and was statistically significant (Z = −12.491; P < .001; Table 2). The inverse variance–weighted partial r for the aggregate-level studies was −0.119 (Z = −8.769; P < .001); for the individual-level studies, −0.029 (Z = −6.244; P < .001); for studies with alcohol price as the independent variable measure, −0.065 (Z = −4.866; P < .001); for studies with alcohol tax as a surrogate measure for price, −0.073 (Z = −11.228; P < .001); for studies of adults, −0.079 (Z = −9.151; P < .001); and for studies of youths, −0.069 (Z = −7.659; P < .001).
TABLE 1.
Studies in Meta-Analysis of Effects of Alcohol Taxes and Prices on Health and Social Indicators
| Outcome Category | Population | Country | Cross-Sectional Unit | No. Repeated Observations | Data Collection Period | |
| Adrian et al. 200111 | Traffic | Adults | Canada | State/province | 19 | 1972–1990 |
| Birckmayer and Hemenway 199912 | Suicide | Adults and youths | United States | State/province | 21 | 1970–1990 |
| Chaloupka and Laixuthai 199713 | Traffic | Youths | United States | Individual | 2 | 1982–1989 |
| Traffic | Youths | United States | Individual | 1 | 1989–1989 | |
| Chaloupka et al. 199314 | Traffic | Adults and youths | United States | State/province | 7 | 1982–1988 |
| Chesson et al. 200015 | STDs/risky sex | Adults and youths | United States | State/province | 15 | 1981–1995 |
| Cook et al. 200516 | Mortality/morbidity | Adults | United States | State/province | 32 | 1970–2001 |
| Cook and Tauchen 198217 | Alcohol-related mortality | Adults | United States | State/province | 16 | 1962–1977 |
| Cuellar et al. 200418 | Crime | Youths | United States | Individual | 1 | 1994–1997 |
| Dee 199919 | Traffic | Youths | United States | State/province | 16 | 1977–1992 |
| Evans et al. 199120 | Traffic | Adults | United States | State/province | 12 | 1975–1986 |
| Grossman and Markowitz 199921 | Crime/misbehavior | Youths | United States | Individual | 3 | 1989–1991 |
| Violence | Youths | United States | Individual | 3 | 1989–1991 | |
| Grossman and Markowitz 200522 | STDs/risky sex | Youths | United States | Individual | 1 | 1991–1999 |
| Heien and Pompelli 198723 | Alcohol-related mortality | Adults | United States | State/province | 9 | 1968–1977 |
| Herttua et al. 200824 | Alcohol-related mortality | Adults | Finland | Country | 2 | 2001–2005 |
| Herttua et al. 200825 | Crime/misbehavior | Adults | Finland | City | 2 | 2002–2005 |
| Crime/misbehavior | Adults | Finland | City | 4 | 2002–2005 | |
| Violence | Adults | Finland | City | 2 | 2002–2005 | |
| Violence | Adults | Finland | City | 4 | 2002–2005 | |
| Jimenez and Labeaga 199426 | Drug use | Adults | Spain | Country | 1 | 1980–1981 |
| Koski et al. 200727 | Alcohol-related mortality | Adults | Finland | Country | 783 | 1990–2004 |
| Markowitz 200028 | Violence | Adults | United States | Individual | 1 | 1985–1987 |
| Violence | Adults | United States | Individual | 2 | 1985–1987 | |
| Markowitz 200029 | Crime/misbehavior | Adults | Multiple | Individual | 1 | 1989–1992 |
| Violence | Adults | Multiple | Individual | 1 | 1989–1992 | |
| Markowitz 200030 | Violence | Youths | United States | Individual | 1 | 1991–1995 |
| Markowitz 200531 | Crime/misbehavior | Adults | United States | Individual | 3 | 1992–1994 |
| Violence | Adults | United States | Individual | 3 | 1992–1994 | |
| Markowitz et al. 200332 | Suicide | Adults and youths | United States | State | 24 | 1976–1999 |
| Markowitz and Grossman 199833 | Violence | Adults | United States | Individual | 1 | 1976–1976 |
| Markowitz and Grossman 200034 | Violence | Adults | United States | Individual | 1 | 1976–1985 |
| Violence | Adults | United States | Individual | 2 | 1976–1985 | |
| Markowitz et al. 200535 | STDs/risky sex | Adults and youths | United States | State | 21 | 1981–2001 |
| STDs/risky sex | Adults and youths | United States | MSA | 20 | 1982–2001 | |
| Mast et al. 199936 | Traffic | Adults | United States | State | 9 | 1984–1992 |
| Matthews et al. 200637 | Violence | Adults | Great Britain | State/province | 10 | 1995–2000 |
| Mullahy and Sindelar 199438 | Traffic | Adults | United States | Individual | 1 | 1988–1988 |
| Nelson and Young 200139 | Alcohol-related mortality | Adults | Multiple | Country | 19 | 1977–1995 |
| Traffic | Adults | Multiple | Country | 19 | 1977–1995 | |
| Ohsfeldt and Morrisey 199740 | Other morbidity | Adults | United States | State | 10 | 1975–1985 |
| Pacula 199841 | Other drug use | Youths | United States | Individual | 2 | 1979–1984 |
| Ponicki et al. 200742 | Traffic | Youths | United States | State | 27 | 1975–2001 |
| Ruhm 199543 | Traffic | Adults | United States | State | 14 | 1975–1988 |
| Ruhm 199644 | Traffic | Adults and youths | United States | State | 7 | 1982–1988 |
| Rush et al. 198645 | Alcohol-related mortality | Adults | United States, Canada | State/province | 28 | 1955–1982 |
| Saffer 199746 | Traffic | Adults and youths | United States | City | 16 | 1986–1989 |
| Saffer and Chaloupka 198947 | Traffic | Adults and youths | United States | State | 6 | 1980–1985 |
| Saffer and Grossman 198748 | Traffic | Adults and youths | United States | State | 7 | 1975–1981 |
| Saffer and Grossman 198749 | Traffic | Adults and youths | United States | State | 7 | 1975–1981 |
| Schweitzer et al. 198350 | Alcohol-related mortality | Adults | United States | State | 1 | 1975–1975 |
| Sen 200351 | STDs/risky sex | Youths | United States | Individual | 4 | 1985–1996 |
| Skog and Melberg 200652 | Alcohol-related mortality | Adults | Denmark | Country | 21 | 1911–1931 |
| Sloan et al. 199453 | Alcohol-related mortality | Adults | United States | State | 7 | 1982–1988 |
| Traffic | Adults | United States | State | 7 | 1982–1988 | |
| Suicide | Adults | United States | State | 7 | 1982–1988 | |
| Smart and Mann 199854 | Alcohol-related mortality | Adults | Canada | Province | 19 | 1975–1993 |
| Traffic | Adults | Canada | Province | 19 | 1975–1993 | |
| Wagenaar et al. 200955 | Alcohol-related mortality | Adults and youths | United States | State | 116 | 1976–2004 |
| Whetten-Goldstein et al. 200056 | Traffic | Youths | United States | State | 12 | 1984–1995 |
| Wilkinson 198757 | Traffic | Adults | United States | State | 5 | 1976–1980 |
| Yamasaki et al. 200558 | Suicide | Adults | Switzerland | Country | 30 | 1965–1994 |
| Young and Bielinska-Kwapisz 200659 | Traffic | Adults and youths | United States | State | 19 | 1982–2000 |
| Young and Likens 200060 | Traffic | Adults and youths | United States | State | 9 | 1982–1990 |
Note. MSA=metropolitan statistical area; STD = sexually transmitted disease.
TABLE 2.
Studies in Effects of Alcohol Taxes and Prices on Health and Social Indicators
| Outcome Measure | r (95% CI) | Z | P | |
| Alcohol-related morbidity and mortality | ||||
| Cook and Tauchen 198217 | Cirrhosis death rate | −0.080 (−0.169, 0.009) | −1.761 | .078 |
| Heien and Pompelli 198723 | Cirrhosis death rate | −0.003 (−0.101, 0.094) | −0.070 | .944 |
| Herttua et al. 200824 | Alcohol-related acute and chronic deaths | −0.068 (−0.107, −0.028) | −3.357 | .001 |
| Koski et al. 200727 | No. of alcohol-related injury deaths | −0.086 (−0.155, −0.016) | −2.405 | .016 |
| Nelson and Young 200139 | Cirrhosis death rate | −0.183 (−0.287, −0.075) | −3.313 | .001 |
| Rush et al. 198645 | Cirrhosis death rate (Michigan) | −0.610 (−0.801, −0.307) | −3.545 | <.001 |
| Rush et al. 198645 | Cirrhosis death rate (Ontario) | −0.950 (−0.977, −0.894) | −9.159 | <.001 |
| Schweitzer et al. 198350 | Alcoholism morbidity and mortality | −0.133 (−0.446, 0.210) | −0.754 | .451 |
| Skog and Melberg 200652 | Delirium tremens death rate | −0.931 (−0.972, −0.835) | −7.072 | <.001 |
| Sloan et al. 199453 | Primary cause death rate | −0.539 (−0.742, −0.246) | −3.358 | .001 |
| Smart and Mann 199854 | Cirrhosis death rate | −0.467 (−0.760, −0.016) | −2.025 | .043 |
| Wagenaar et al. 200955 | Alcohol-related mortality (1983 tax change) | −0.240 (−0.404, −0.060) | −2.598 | .009 |
| Wagenaar et al. 200955 | Alcohol-related mortality (2002 tax change) | −0.208 (−0.376, −0.027) | −2.243 | .025 |
| Total | −0.347 (−0.457, −0.228) | −5.430 | <.001 | |
| Other morbidity and mortality | ||||
| Cook et al. 200516 | All-cause mortality | −0.047 (−0.095, 0.002) | −1.889 | .059 |
| Ohsfeldt and Morrisey199740 | Industrial injury | −0.128 (−0.223, −0.031) | −2.578 | .01 |
| Total | −0.076 (−0.152, 0.001) | −1.942 | .052 | |
| Violence | ||||
| Grossman and Markowitz 199921 | Sexual assault | −0.013 (−0.019, −0.006) | −3.730 | <.001 |
| Herttua et al. 200825 | Assault, rape, domestic arrests | −0.083 (−0.189, 0.024) | −1.520 | .128 |
| Markowitz and Grossman 199833 | Child abuse | −0.086 (−0.158, −0.012) | −2.294 | .022 |
| Markowitz and Grossman 200034 | Child abuse (adult female) | −0.067 (−0.122, −0.011) | −2.348 | .019 |
| Markowitz and Grossman 200034 | Child abuse (adult male) | −0.047 (−0.122, 0.028) | −1.227 | .22 |
| Markowitz 200028 | Spouse abuse | −0.026 (−0.059, 0.007) | −1.540 | .123 |
| Markowitz 200029 | Probability of victimization | −0.023 (−0.033, −0.012) | −4.234 | <.001 |
| Markowitz 200030 | Fights | −0.012 (−0.023, −0.002) | −2.270 | .023 |
| Markowitz 200531 | Alcohol-related assault | −0.002 (−0.005, 0.001) | −1.027 | .304 |
| Matthews et al. 200637 | Violence injury rate | −0.175 (−0.252, −0.097) | −4.329 | <.001 |
| Total | −0.022 (−0.034, −0.010) | −3.579 | <.001 | |
| Suicide | ||||
| Birckmayer and Hemenway 199912 | Suicide (aged 15–17 y) | 0.032 (−0.030, 0.093) | 0.999 | .318 |
| Birckmayer and Hemenway 199912 | Suicide (aged 18–20 y) | 0.000 (−0.062, 0.062) | 0.007 | .994 |
| Birckmayer and Hemenway 199912 | Suicide (aged 21–23 y) | 0.010 (−0.051, 0.072) | 0.333 | .739 |
| Markowitz et al. 200332 | Suicide (females aged 10–14 y) | −0.007 (−0.063, 0.049) | −0.260 | .795 |
| Markowitz et al. 200332 | Suicide (males aged 10–14 y) | −0.097 (−0.152, −0.041) | −3.393 | .001 |
| Markowitz et al. 200332 | Suicide (females aged 15–19 y) | −0.035 (−0.091, 0.021) | −1.219 | .223 |
| Markowitz et al. 200332 | Suicide (males aged 15–19 y) | −0.168 (−0.222, −0.113) | −5.929 | <.001 |
| Markowitz et al. 200332 | Suicide (females aged 20–24 y) | −0.049 (−0.104, 0.007) | −1.699 | .089 |
| Markowitz et al. 200332 | Suicide (males aged 20–24 y) | −0.170 (−0.224, −0.115) | −6.008 | <.001 |
| Sloan et al. 199453 | Suicide | −0.339 (−0.607, −0.001) | −1.964 | .05 |
| Yamasaki et al. 200558 | Suicide | 0.570 (0.264, 0.772) | 3.367 | .001 |
| Total | −0.048 (−0.102, 0.007) | −1.726 | .084 | |
| Traffic | ||||
| Adrian et al. 200111 | Alcohol-related driver motor vehicle accident; fatality rate | −0.650 (−0.853, −0.278) | −3.102 | .002 |
| Chaloupka et al. 199314 | Crash fatality rate (adults) | −0.195 (−0.296, −0.090) | −3.602 | <.001 |
| Chaloupka et al. 199314 | Crash fatality rate (youths) | −0.322 (−0.415, −0.223) | −6.093 | <.001 |
| Chaloupka and Laixuthai 199713 | Driver motor vehicle accident; fatality rate; probability of motor vehicle accident |
0.125 (−0.181, −0.069) | −4.326 | <.001 |
| Dee 199919 | Driver and total motor vehicle fatality rate | −0.102 (−0.172, −0.032) | −2.836 | .005 |
| Evans et al. 199120 | Alcohol-related and total motor vehicle fatality rate | −0.127 (−0.205, −0.048) | −3.122 | .002 |
| Mast et al. 199936 | Driver; total motor vehicle fatality rate | −0.009 (−0.104, 0.085) | −0.194 | .846 |
| Mullahy and Sindelar 199438 | Probability of drunk driving (adult non-White females) | −0.026 (−0.048, −0.004) | −2.287 | .022 |
| Mullahy and Sindelar 199438 | Probability of drunk driving (adult non-White males) | −0.027 (−0.051, −0.004) | −2.258 | .024 |
| Mullahy and Sindelar 199438 | Probability of drunk driving (adult White females) | −0.008 (−0.030, 0.014) | −0.731 | .465 |
| Mullahy and Sindelar 199438 | Probability of drunk driving (adult White males) | −0.013 (−0.037, 0.011) | −1.084 | .278 |
| Nelson and Young 200139 | Total motor vehicle fatality rate | −0.066 (−0.174, 0.043) | −1.182 | .237 |
| Ponicki et al. 200742 | Total motor vehicle fatality rate | −0.065 (−0.119, −0.011) | −2.351 | .019 |
| Ruhm 199543 | Total motor vehicle fatality rate | −0.205 (−0.278, −0.131) | −5.307 | <.001 |
| Ruhm 199644 | Total miles motor vehicle fatality rate | −0.132 (−0.235, −0.025) | −2.415 | .016 |
| Ruhm 199644 | Total motor vehicle fatality rate | −0.161 (−0.263, −0.054) | −2.955 | .003 |
| Saffer and Grossman 198748 | Total motor vehicle fatality rate (aged 21–24 y) | −0.236 (−0.335, −0.133) | −4.399 | <.001 |
| Saffer and Grossman 198748 | Total motor vehicle fatality rate (aged 15–17 y) | −0.146 (−0.249, −0.039) | −2.677 | .007 |
| Saffer and Grossman 198748 | Total motor vehicle fatality rate (aged 18–20 y) | −0.250 (−0.347, −0.146) | −4.651 | <.001 |
| Saffer and Grossman 198749 | Total motor vehicle fatality rate (aged 21–24 y) | −0.169 (−0.271, −0.063) | −3.110 | .002 |
| Saffer and Grossman 198749 | Total motor vehicle fatality rate (aged 15–17 y) | −0.183 (−0.284, −0.077) | −3.376 | .001 |
| Saffer and Grossman 198749 | Total motor vehicle fatality rate (aged 18–20 y) | −0.299 (−0.393, −0.198) | −5.626 | <.001 |
| Saffer and Chaloupka 198947 | Night driver motor vehicle fatality rate (adults) | −0.195 (−0.304, −0.082) | −3.342 | .001 |
| Saffer and Chaloupka 198947 | Total motor vehicle fatality rate (adults) | −0.215 (−0.322, −0.101) | −3.678 | <.001 |
| Saffer 199746 | Night driver motor vehicle fatality rate (aged 15–24 y) | −0.050 (−0.107, 0.006) | −1.748 | .080 |
| Saffer 199746 | Total motor vehicle fatality rate (aged 15–24 y) | −0.016 (−0.073, 0.040) | −0.560 | .575 |
| Sloan et al. 199453 | Total motor vehicle fatality rate | −0.436 (−0.675, −0.114) | −2.600 | .009 |
| Smart and Mann 199854 | Alcohol-related driver; motor vehicle fatality rate | −0.373 (−0.707, 0.098) | −1.568 | .117 |
| Whetten-Goldstein et al. 200056 | Alcohol-related driver; total; total night motor vehicle fatality rate | −0.011 (−0.091, 0.069) | −0.267 | .790 |
| Wilkinson 198757 | Total motor vehicle fatality rate | −0.082 (−0.212, 0.050) | −1.216 | .224 |
| Young and Likens 200060 | Alcohol-related driver; total motor vehicle fatality rate (aged ≥ 20 y) |
−0.023 (−0.121, 0.075) | −0.462 | .644 |
| Young and Likens 200060 | Alcohol-related driver; total motor vehicle fatality rate (aged 18–20 y) |
−0.014 (−0.112, 0.085) | −0.268 | .788 |
| Young and Bielinska-Kwapisz 200659 | Total motor vehicle fatality rate (adults) | −0.097 (−0.162, −0.031) | −2.860 | .004 |
| Young and Bielinska-Kwapisz 200659 | Total motor vehicle fatality rate (youths) | −0.065 (−0.131, 0.001) | −1.930 | .054 |
| Total | −0.112 (−0.139, −0.085) | −8.069 | <.001 | |
| STDs and risky sexual behavior | ||||
| Chesson et al. 200015 | STD rate (females aged ≥ 24 y) | −0.102 (−0.180, −0.022) | −2.492 | .013 |
| Chesson et al. 200015 | STD rate (females aged 20–24 y) | −0.061 (−0.131, 0.010) | −1.686 | .092 |
| Chesson et al. 200015 | STD rate (males aged ≥ 24 y) | −0.123 (−0.201, −0.043) | −3.024 | .002 |
| Chesson et al. 200015 | STD rate (males age 20–24 y) | −0.101 (−0.171, −0.030) | −2.798 | .005 |
| Chesson et al. 200015 | STD rate (females age 15–19 y) | −0.032 (−0.103, 0.039) | −0.882 | .378 |
| Chesson et al. 200015 | STD rate (males aged 15–19 y) | −0.133 (−0.202, −0.062) | −3.687 | <.001 |
| Grossman and Markowitz 200522 | Birth control and condom use (females aged 14–18 y) | −0.014 (−0.032, 0.005) | −1.450 | .147 |
| Grossman and Markowitz 200522 | Birth control and condom use (males aged 14–18y) | −0.022 (−0.041, −0.003) | −2.306 | .021 |
| Markowitz et al. 200535 | Gonorrhea rate (males aged 15–19 y) | −0.061 (−0.121, 0.000) | −1.960 | .05 |
| Markowitz et al. 200535 | Gonorrhea rate (males aged 20–24 y) | −0.061 (−0.121, 0.000) | −1.960 | .05 |
| Markowitz et al. 200535 | AIDS rate | −0.023 (−0.046, 0.000) | −1.960 | .05 |
| Sen 200351 | Abortion rate | −0.176 (−0.306,−0.039) | −2.513 | .012 |
| Total | −0.055 (−0.078, −0.033) | −4.845 | <.001 | |
| Other drug use | ||||
| Jimenez and Labeaga 199426 | Tobacco consumption | −0.022 (−0.048, 0.004) | −1.628 | .104 |
| Pacula 199841 | Marijuana use | −0.023 (−0.061, 0.015) | −1.168 | .243 |
| Total | −0.022 (−0.043, 0.000) | −2.003 | .045 | |
| Crime/misbehavior | ||||
| Cuellar et al. 200418 | Probability of detention | −0.033 (−0.058, −0.008) | −2.576 | .01 |
| Grossman and Markowitz 199921 | Alcohol-related property damage; arguments; police trouble | −0.015 (−0.021, −0.009) | −5.100 | <.001 |
| Herttua et al. 200825 | Police detainments; multiple crimes/misbehavior | −0.090 (−0.196, 0.017) | −1.650 | .099 |
| Markowitz 200029 | Probability of being robbery victim | −0.015 (−0.023, −0.006) | −3.320 | .001 |
| Markowitz 200531 | Robberies | −0.004 (−0.007, −0.001) | −2.683 | .007 |
| Total | −0.014 (−0.023,− 0.005) | −2.943 | .003 | |
| Total effects (all outcomes combined) | −0.071 (−0.082, −0.060) | −12.491 | <.001 | |
Note. CI = confidence interval; STD = sexually transmitted disease. Duplicate citations reflect results from multiple independent samples reported in the same article.
The first section of Table 2 presents the results from studies that specifically examined effects of alcohol prices or taxes on alcohol-related disease or injury. Eleven articles (reporting 13 statistically independent studies) provided 29 estimates of effect, among which 22 (76%) showed a statistically significant inverse association. At the study level, all 13 studies were in the hypothesized direction and only 2 were not significant.23,50 The inverse variance–weighted overall r for the 13 studies was −0.347 and significant (Z = −5.430; P < .001).
Two articles examined effects on morbidity and mortality outcomes not specifically alcohol-related, such as all-cause mortality16 and industrial injury,40 providing 5 estimates of effect. All 5 estimates showed an inverse association, and 4 were statistically significant. At the study level, both were in the hypothesized direction. The inverse variance–weighted r for these 2 studies combined was −0.076 (Z = −1.942; P = .052).
Nine articles examined effects of alcohol taxes or prices on various measures of violence. The 9 articles reported 10 statistically independent studies. These studies provided 70 individual estimates of effect, of which 29 (41%) showed a statistically significant inverse association. At the study level, 6 reported a significant inverse association between alcohol taxes or prices and violence. The inverse variance–weighted effect across the 10 studies was significant, however (r = −0.022; Z = −3.579; P < .001).
Four articles examined effects of alcohol prices or taxes on suicide, providing 12 individual estimates of effect. Among these estimates, 5 (42%) showed a statistically significant inverse association. The inverse variance–weighted effect across the 11 independent estimates was marginally significant (r = −0.048; Z = −1.726; P = .084). Removing 1 outlier58 increased the statistical significance of the meta-estimate (r = −0.060; Z = −2.356; P = .018).
The fifth section of Table 2 presents results from 21 articles examining effects of alcohol prices or taxes on traffic safety outcomes, with 150 individual estimates of effect. Among all estimates, 86 (57%) showed a statistically significant inverse association. All 34 independent estimates showed an inverse association between alcohol prices or taxes and a traffic outcome, with 23 estimates (68%) statistically significant. The inverse variance–weighted overall partial r for the 34 independent estimates was −0.112, which was significant (Z = −8.069; P < .001). There was 1 outlier,11 whose removal did not affect the results (r = −0.110; Z = −8.010; P < .001).
Four articles examined the effects of alcohol taxes or prices on rates of STDs and risky sexual behavior. Thirty-seven individual estimates of effect were obtained from these 4 articles, all showing an inverse association, with 28 (76%) statistically significant. All of the 12 independent estimates showed an inverse association with rates of STDs or risky sexual behavior, and 10 (83%) were statistically significant. The inverse variance–weighted effect across the 12 independent estimates was −0.055 (Z = −4.845; P < .001).
Two articles, containing 10 estimates, examined effects of alcohol taxes or prices on other drug use (i.e., tobacco and marijuana).26,41 All of the individual estimates showed an inverse association, and 6 (60%) were statistically significant. At the study level, both estimates were in the hypothesized direction; however, neither was statistically significant when considered alone. However, the inverse variance–weighted r for these 2 studies combined was −0.022 and was significant (Z = −2.003; P = .045).
The last section of Table 2 presents results from 5 articles on the effect of alcohol prices or taxes on various indicators of crime and misbehavior, providing 27 estimates of effect. Of the 27 estimates, 21 showed an inverse association and 18 were statistically significant. At the study level, 4 showed a significant inverse association, and 1 was in the hypothesized direction but not statistically significant.25 The inverse variance–weighted overall partial r for the 5 studies was −0.014, which was significant (Z = −2.943; P = .003).
DISCUSSION
The aggregated results from this fairly large set of studies showed clearly that beverage alcohol prices and taxes were significantly and inversely related to all outcome categories examined: alcohol-related morbidity and mortality, violence, traffic crash fatalities and drunk driving, rates of STDs and risky sexual behavior, other drug use, and crime, with the sole exception that the estimated inverse relation with suicide was not statistically significant.
Meta-analyses inherently present average effect sizes, which may not reflect the exact effect in each specific setting; some locations experience larger effects, and others, smaller effects. The magnitude of effects in our analysis varied considerably across outcomes, with the largest effect size for alcohol-related morbidity and mortality. This variation was not surprising, because the measures of alcohol-related morbidity and mortality largely represented deaths where essentially all cases were known to be specifically attributable to ethanol ingestion (e.g., alcoholic cirrhosis, delirium tremens).
By contrast, outcomes examined in studies reported in other categories all had substantial proportions related to alcohol but also included many individual cases with no alcohol involvement (e.g., overall suicide, STDs, and violence). Substantial measurement error (specifically the lack of good measures of alcohol involvement) is inherent in most of the outcome indicators in this literature; therefore, the consistency of the findings of an inverse relationship between alcohol prices or taxes and the wide range of outcomes reported is noteworthy. The natural consequence of high measurement error is underestimating the magnitude of the relationship (attenuation).61 Results for violence, suicide, STDs, and crime outcomes were particularly likely to represent substantial underestimates attributable to measurement error, because only 2 of the 38 results included indicators of alcohol involvement, and the epidemiological literature suggests that only about a quarter of those outcomes are caused by alcohol.5
More generally, the pattern of results across outcomes (Table 2) showed an expected monotonic relationship between the proportion of the outcome attributable to ethanol ingestion and the magnitude of the relationship between alcohol prices or taxes and the outcome (−0.347 for cirrhosis and similar outcomes, −0.112 for traffic crashes, −0.055 for STDs, −0.022 for violence, −0.048 for suicide, and −0.014 for general crime).
Our findings are consistent with a recent meta-analysis of the literature that found substantial effects of alcohol taxes and prices on alcohol sales and drinking behavior.1 Together with that systematic review, our results indicate that hundreds of studies over the past 4 decades reveal the basic mechanism of effect: sales and excise taxes are a major determinant of variation in retail prices of alcohol across jurisdictions and across time, price of alcoholic beverages affects sales and drinking patterns, and tax policy–induced changes in drinking are in turn reflected in rates of a range of disease, injury, and other harm indicators.
Limitations
Statistical theory for systematic reviews and meta-analyses relies on assumptions regarding comparability of research designs and analytic approaches in the underlying studies. Although such assumptions are rarely met fully in any meta-analysis, in our case the pool of studies was particularly characterized by methodological diversity, including differences in the structure of the equations used to estimate effects of alcohol taxes or prices on the outcomes of interest. Consistent with this diversity, we found considerable residual study-level variance. We therefore used random-effects models to account for the residual variance in study-level effects associated with these differences.
Although we did not exclude available unpublished studies, we did not systematically search for unpublished literature. It is well known that larger studies that detect statistically significant effects are more likely to be published,8,62–64 published in English,8,65 and cited by other authors64,66—all of which may contribute to biased meta-estimates.
We assessed these potential biases by 2 methods: failsafe N67 and Duval and Tweedie's trim and fill.68 The failsafe N is an estimate of the number of studies with null results that would need to be added to an analysis for the estimated effect to no longer be statistically significant. For our analysis, an additional 178 (purportedly unfound or unpublished) studies with null effects would be required to negate the statistical significance of the overall estimated effect we found. For each outcome category, the number of additional studies needed to negate the significance of effects ranged from 57 (for crime) to 1991 (for traffic outcomes).
Trim and fill uses a funnel plot in a nonparametric, iterative technique for estimating the number of missing studies that might exist in a meta-analysis and the potential effect these missing studies might have on conclusions.68 This procedure suggested that 28 studies might have been missed in our analysis because of publication and other small-study biases; adjusting our overall random-effects partial r meta-estimate for these purported missing studies reduced the estimate from −0.071 to −0.038, which nevertheless remained statistically significant (95% CI = −0.050, −0.027). After we adjusted for publication and small-study bias, our meta-estimates remained statistically significant for alcohol-related morbidity and mortality (r = −0.347; 95% CI = −0.457, −0.228), violence (r = −0.014; 95% CI = −0.027, −0.001), traffic outcomes (r = −0.067; 95% CI = −0.094, −0.039), STDs (r = −0.027; 95% CI = −0.050, −0.003), and crime (r = −0.011; 95% CI = −0.020, −0.002). The bias-adjusted estimate for suicide was r = −0.048 (95% CI = −0.102, 0.007).
Because we had only 2 studies each in the other morbidity and mortality and other drug use categories, we could not calculate failsafe N and trim-and-fill estimates for those 2 categories. Although small-study and publication biases likely were present, such effects would not negate the overall conclusion of a significant inverse relationship between alcohol taxes and prices and population health outcomes, with the sole exception of suicide, for which the evidence remains insufficient.
Despite methodological limitations, the overwhelming consistency of the evidence in this literature is clear. Excluding suicide, every independent estimate except 113 showed an inverse relationship between alcohol taxes and prices and harmful outcomes. Of 11 suicide estimates, 7 were negative and 4 were positive, perhaps suggesting that suicide operates differently as an independent estimate.
Public Health Significance
Our results establish beyond any reasonable doubt that alcohol taxes and prices are inversely associated with population health outcomes. But how significant is this apparent effect to public health? Two approaches can be taken to evaluate the substantive significance of these findings.
Effect sizes for individual-level preventive interventions are frequently reported as Cohen's d (standard mean difference), which is comparable to 2r, and Cohen's rule of thumb is that d = 0.20 is a small effect and d = 0.80 is a large effect.69 In the data we analyzed, the effect on alcohol morbidity and mortality indicators was r = −0.347, analogous to d = −0.70, a large effect, and the effect on traffic crash outcomes was r = −0.112, analogous to d = −0.22, a medium effect. Effects on crime, violence, and STDs, although still statistically significant, were smaller. In the context of individual-level interventions, some of these effects might be deemed as medium-sized effects, but in our analysis they were population-level effects. Modest effects on individuals are substantively larger and more significant when the effects apply across the entire population of drinkers in a region or country.
A second way to assess the public health significance of our findings is to estimate the percentage reduction in these important population health outcomes associated with a given change in alcohol tax. In this calculation, r represents the standardized slope, and a 1-SD change in the independent variable is associated with an r times SD reduction in the dependent variable. We assessed several data sets on alcohol taxes and alcohol-related mortality indicators for the United States and found that SDs (estimated longitudinally over many years or cross-sectionally across the 50 states) are approximately equal to the mean. Therefore, an alternative interpretation of r is that it is the proportionate reduction in morbidity or mortality associated with doubling the alcohol tax. According to the data we analyzed, doubling alcohol taxes would be associated with an average reduction of 35% in alcohol-related mortality, an 11% reduction in traffic crash deaths, a 6% reduction in STDs, a 2% reduction in violence, and a 1.2% reduction in crime.
Conclusions
In most developed countries, alcohol is second only to tobacco as a consumer product that causes death (approximately 85 000 alcohol-related deaths per year in the United States alone70); the public health significance of our findings is therefore obvious. Moreover, by contrast to many prevention efforts, the mechanisms for taxing alcoholic beverages are already in place, and the large public health benefits not only accrue without requiring additional fiscal resources, but actually generate additional revenues that can be used for other pressing public health infrastructure and prevention needs.
Acknowledgments
This study was funded in part by the Robert Wood Johnson Foundation.
Special thanks to Matthew J. Salois for assisting with identification and coding of studies.
Note. The funding organization had no role in the design and conduct of the study; collection, management, analysis, and interpretation of the data; or preparation, review, or approval of the article.
Human Participant Protection
No protocol approval was required because no human participants were involved.
References
- 1.Wagenaar AC, Salois MJ, Komro KA. Effects of beverage alcohol price and tax levels on drinking: a meta-analysis of 1003 estimates from 112 studies. Addiction. 2009;104(2):179–190 [DOI] [PubMed] [Google Scholar]
- 2.Keller M, Alcohol and Health: New Knowledge. Washington, DC: National Institute on Alcohol Abuse and Alcoholism; 1974 [Google Scholar]
- 3.National Institute on Alcohol Abuse and Alcoholism Special Report to the U.S. Congress on Alcohol and Health. US Department of Health and Human Services; 2000 [Google Scholar]
- 4.Smith GS, Branas CC, Miller TR. Fatal nontraffic injuries involving alcohol: a meta-analysis. Ann Emerg Med. 1999;33(6):659–668 [PubMed] [Google Scholar]
- 5.Rehm J, Patra J, Popova S. Alcohol-attributable mortality and potential years of life lost in Canada 2001: implications for prevention and policy. Addiction. 2006;101(3):373–384 [DOI] [PubMed] [Google Scholar]
- 6.Department of Mental Health and Substance Abuse Global Status Report on Alcohol 2004. Geneva, Switzerland: World Health Organization; 2004 [Google Scholar]
- 7.Borenstein M, Hedges LV, Higgins J, Rothstein H. Comprehensive Meta-analysis 2.0. Englewood, NJ: Biostat, Inc; 2007 [Google Scholar]
- 8.Lipsey MW, Wilson DB. Practical Meta-analysis. Thousand Oaks, CA: Sage Publications; 2001 [Google Scholar]
- 9.Hedges LV, Olkin I. Statistical Methods for Meta-analysis. Orlando, FL: Academic Press; 1985 [Google Scholar]
- 10.Higgins JP, Thompson SG, Deeks JJ, Altman DG. Measuring inconsistency in meta-analyses. BMJ. 2003;327(7414):557–560 [DOI] [PMC free article] [PubMed] [Google Scholar]
- 11.Adrian M, Ferguson BS, Her M. Can alcohol price policies be used to reduce drunk driving? Evidence from Canada. Subst Use Misuse. 2001;36(13):1923–1957 [DOI] [PubMed] [Google Scholar]
- 12.Birckmayer J, Hemenway D. Minimum-age drinking laws and youth suicide, 1970–1990. Am J Public Health. 1999;89(9):1365–1368 [DOI] [PMC free article] [PubMed] [Google Scholar]
- 13.Chaloupka FJ, Laixuthai A. Do youths substitute alcohol and marijuana? Some econometric evidence. East Econ J. 1997;23(3):253–276 [Google Scholar]
- 14.Chaloupka FJ, Saffer H, Grossman M. Alcohol-control policies and motor-vehicle fatalities. J Legal Stud. 1993;22(1):161–186 [Google Scholar]
- 15.Chesson H, Harrison P, Kassler WJ. Sex under the influence: the effect of alcohol policy on sexually transmitted disease rates in the United States. J Law Econ. 2000;43(1):215–238 [DOI] [PubMed] [Google Scholar]
- 16.Cook PJ, Ostermann J, Sloan FA. Are Alcohol Excise Taxes Good for Us? Short and Long-Term Effects on Mortality Rates. Cambridge, MA: National Bureau of Economic Research; 2005. NBER working paper W11138 [Google Scholar]
- 17.Cook PJ, Tauchen G. The effect of liquor taxes on heavy drinking. Bell J Econ. 1982;13(2):379–390 [Google Scholar]
- 18.Cuellar AE, Markowitz S, Libby AM. Mental health and substance abuse treatment and juvenile crime. J Ment Health Policy Econ. 2004;7(2):59–68 [PubMed] [Google Scholar]
- 19.Dee TS. State alcohol policies, teen drinking and traffic fatalities. J Public Econ. 1999;72(2):289–315 [Google Scholar]
- 20.Evans WN, Neville D, Graham JD. General deterrence of drunk driving: evaluation of recent American policies. Risk Anal. 1991;11(2):279–289 [DOI] [PubMed] [Google Scholar]
- 21.Grossman M, Markowitz S. Alcohol Regulation and Violence on College Campuses. Cambridge, MA: National Bureau of Economic Research; 1999. NBER working papter W7129 [Google Scholar]
- 22.Grossman M, Markowitz S. I did what last night?! Adolescent risky sexual behaviors and substance use. East Econ J. 2005;31:383–405 [Google Scholar]
- 23.Heien D, Pompelli G. Stress, ethnic and distribution factors in a dichotomous response model of alcohol abuse. J Stud Alcohol. 1987;48(5):450–455 [DOI] [PubMed] [Google Scholar]
- 24.Herttua K, Mäkelä P, Martikainen P. Changes in alcohol-related mortality and its socioeconomic differences after a large reduction in alcohol prices: a natural experiment based on regular data. Am J Epidemiol. 2008;168(10):1110–1118 [DOI] [PMC free article] [PubMed] [Google Scholar]
- 25.Herttua K, Mäkelä P, Martikainen P, Sirén R. The impact of a large reduction in the price of alcohol on area differences in interpersonal violence: a natural experiment based on aggregate data. J Epidemiol Community Health. 2008;62(11):995–1001 [DOI] [PubMed] [Google Scholar]
- 26.Jimenez S, Labeaga JM. Is it possible to reduce tobacco consumption via alcohol taxation? J Health Econ. 1994;3(4):231–241 [DOI] [PubMed] [Google Scholar]
- 27.Koski A, Sirén R, Vuori E, Poikolainen K. Alcohol tax cuts and increase in alcohol-positive sudden deaths: a time-series intervention analysis. Addiction. 2007;102(3):362–368 [DOI] [PubMed] [Google Scholar]
- 28.Markowitz S. The price of alcohol, wife abuse, and husband abuse. South Econ J. 2000;67(2):279–303 [Google Scholar]
- 29.Markowitz S. The role of alcohol and drug consumption in determining physical fights and weapon carrying by teenagers. Cambridge, MA: National Bureau of Economic Research; 2000. NBER working paper W7500 [Google Scholar]
- 30.Markowitz S. Criminal violence and alcohol beverage control: evidence from an international study. Cambridge, MA: National Bureau of Economic Research; 2000. NBER working paper W7481 [Google Scholar]
- 31.Markowitz S. Alcohol, drugs and violent crime. Int Rev Law Econ. 2005;25(1):20–44 [Google Scholar]
- 32.Markowitz S, Chatterji P, Kaestner R. Estimating the impact of alcohol policies on youth suicides. J Ment Health Policy Econ. 2003;6(1):37–46 [PubMed] [Google Scholar]
- 33.Markowitz S, Grossman M. Alcohol regulation and domestic violence towards children. Contemp Econ Policy. 1998;16(3):309–320 [Google Scholar]
- 34.Markowitz S, Grossman M. The effects of beer taxes on physical child abuse. J Health Econ. 2000;19(2):271–282 [DOI] [PubMed] [Google Scholar]
- 35.Markowitz S, Kaestner R, Grossman M. An investigation of the effects of alcohol consumption and alcohol policies on youth risky sexual behaviors. Am Econ Rev. 2005;95(2):263–266 [DOI] [PubMed] [Google Scholar]
- 36.Mast BD, Benson BL, Rasmussen DW. Beer taxation and alcohol-related traffic fatalities. South Econ J. 1999;66(2):214–249 [Google Scholar]
- 37.Matthews K, Shepherd J, Sivarajasingham V. Violence-related injury and the price of beer in England and Wales. Appl Econ. 2006;38(6):661–670 [DOI] [PubMed] [Google Scholar]
- 38.Mullahy J, Sindelar JL. Do drinkers know when to say when? An empirical analysis of drunk driving. Econ Inq. 1994;32(3):383–394 [Google Scholar]
- 39.Nelson JP, Young DJ. Do advertising bans work? An international comparison. Int J Adver. 2001;20:273–296 [Google Scholar]
- 40.Ohsfeldt RL, Morrisey MA. Beer taxes, workers' compensation, and industrial injury. Rev Econ Stat. 1997;79(1):155–160 [Google Scholar]
- 41.Pacula RL. Does increasing the beer tax reduce marijuana consumption? J Health Econ. 1998;17(5):557–585 [DOI] [PubMed] [Google Scholar]
- 42.Ponicki WR, Gruenewald PJ, LaScala EA. Joint impacts of minimum legal drinking age and beer taxes on US youth traffic fatalities, 1975 to 2001. Alcohol Clin Exp Res. 2007;31(5):804–813 [DOI] [PubMed] [Google Scholar]
- 43.Ruhm CJ. Economic conditions and alcohol problems. J Health Econ. 1995;14(5):583–603 [DOI] [PubMed] [Google Scholar]
- 44.Ruhm CJ. Alcohol policies and highway vehicle fatalities. J Health Econ. 1996;15(4):435–454 [DOI] [PubMed] [Google Scholar]
- 45.Rush B, Steinberg M, Brook R. Relationships among alcohol availability, alcohol consumption and alcohol-related damage in the province of Ontario and the State of Michigan. Adv Alcohol Subst Abuse. 1986;5(4):33–45 [DOI] [PubMed] [Google Scholar]
- 46.Saffer H. Alcohol advertising and motor vehicle fatalities. Rev Econ Stat. 1997;79(3):431–442 [Google Scholar]
- 47.Saffer H, Chaloupka F. Breath testing and highway fatality rates. Appl Econ. 1989;21(7):901–912 [Google Scholar]
- 48.Saffer H, Grossman M. Beer taxes, the legal drinking age, and youth motor vehicle fatalities. J Legal Stud. 1987;16(2):351–374 [Google Scholar]
- 49.Saffer H, Grossman M. Drinking age laws and highway mortality rates: cause and effect. Econ Inq. 1987;25(3):403–417 [Google Scholar]
- 50.Schweitzer SO, Intriligator MD, Salehi H. Alcoholism: an econometric model of its causes, its effects, and its control. : Grant M, Williams A, Plant M, Economics and Alcohol. London, UK: Croom Helm; 1983:107–127 [Google Scholar]
- 51.Sen B. Can beer taxes affect teen pregnancy? Evidence based on teen abortion rates and birth rates. South Econ J. 2003;70(2):328–343 [Google Scholar]
- 52.Skog OJ, Melberg HO. Becker's rational addiction theory: an empirical test with price elasticities for distilled spirits in Denmark 1911–31. Addiction. 2006;101(10):1444–1450 [DOI] [PubMed] [Google Scholar]
- 53.Sloan FA, Reilly BA, Schenzler C. Effects of prices, civil and criminal sanctions, and law-enforcement on alcohol-related mortality. J Stud Alcohol. 1994;55(4):454–465 [DOI] [PubMed] [Google Scholar]
- 54.Smart RG, Mann RE. Treatment, Alcoholics Anonymous and alcohol controls during the decrease in alcohol problems in Alberta: 1975–1993. Alcohol Alcohol. 1998;33(3):265–272 [DOI] [PubMed] [Google Scholar]
- 55.Wagenaar AC, Maldonado-Molina M, Wagenaar BH. Effects of alcohol tax increases on alocohol-related disease mortality in Alaska: time-series analyses from 1976 to 2004. Am J Public Health. 2009;99(8):1464–1470 [DOI] [PMC free article] [PubMed] [Google Scholar]
- 56.Whetten-Goldstein K, Sloan FA, Stout E, Liang L. Civil liability, criminal law, and other policies and alcohol-related motor vehicle fatalities in the United States: 1984–1995. Accid Anal Prev. 2000;32(6):723–733 [DOI] [PubMed] [Google Scholar]
- 57.Wilkinson JT. Reducing drunken driving: which policies are most effective? South Econ J. 1987;54(2):322–334 [Google Scholar]
- 58.Yamasaki A, Chinami M, Suzuki M, Kaneko Y, Fujita D, Shirakawa T. Tobacco and alcohol tax relationships with suicide in Switzerland. Psychol Rep. 2005;97(1):213–216 [DOI] [PubMed] [Google Scholar]
- 59.Young DJ, Bielinska-Kwapisz A. Alcohol prices, consumption, and traffic fatalities. South Econ J. 2006;72(3):690–703 [Google Scholar]
- 60.Young DJ, Likens TW. Alcohol regulation and auto fatalities. Int Rev Law Econ. 2000;20(1):107–126 [Google Scholar]
- 61.Nunnally JC, Bernstein IH. Psychometric Theory. 3rd ed.New York, NY: McGraw-Hill; 1994 [Google Scholar]
- 62.Dickersin K, Min YI, Meinert CL. Factors influencing publication of research results. Follow-up of applications submitted to two institutional review boards. JAMA. 1992;263(3):374–378 [PubMed] [Google Scholar]
- 63.Easterbrook PJ, Berlin JA, Gopalan R, Matthews DR. Publication bias in clinical research. Lancet. 1991;337(8746):867–872 [DOI] [PubMed] [Google Scholar]
- 64.Sterne JAC, Egger M, Smith GD. Investigating and dealing with publication and other biases. : Egger M, Smith GD, Altman DG, Systematic Reviews in Health Care: Meta-analysis in Context. London, UK: BMJ Books; 2001 [DOI] [PMC free article] [PubMed] [Google Scholar]
- 65.Egger M, Zellweger-Zähner T, Schneider M, Junker C, Lengeler C, Antes G. Language bias in randomised controlled trials published in English and German. Lancet. 1997;350(9074):326–329 [DOI] [PubMed] [Google Scholar]
- 66.Getzsche PC. Reference bias in reports of drug trials. BMJ (Clin Res Ed). 1987;295(6599):654–656 [PMC free article] [PubMed] [Google Scholar]
- 67.Becker BJ. Failsafe N or file-drawer number. : Rothstein HR, Sutton AJ, Borenstein M, Publication Bias in Meta-analysis. Hoboken, NJ: John Wiley & Sons; 2006. [Google Scholar]
- 68.Duval SJ, Tweedie RL. Trim and fill: a simple funnel-plot-based method of testing and adjusting for publication bias in meta-analysis. Biometrics. 2000;56(2):455–463 [DOI] [PubMed] [Google Scholar]
- 69.Cohen J. Statistical Power Analysis for the Behavioral Sciences. 2nd ed.Hillsdale, NJ: Erlbaum; 1988 [Google Scholar]
- 70.Mokdad AH, Marks JS, Stroup DF, Gerberding JL. Actual causes of death in the United States, 2000. JAMA. 2004;291(10):1238–1245 [DOI] [PubMed] [Google Scholar]