

Abstract
Background
Interferon-γ (IFN-γ) assays are new tests for tuberculosis (TB) infection, and T-cell responses may be correlated with antigen burden. However, it is unclear if IFN-γ assays can be used to monitor response to TB treatment.
Materials and Methods
We measured T-cell responses to TB specific antigens in 60 Indian patients with microbiologically confirmed active pulmonary tuberculosis, before, during, and after TB treatment. Most patients were hospitalized and had moderate to advanced disease. IFN-γ responses were measured using the commercial whole-blood QuantiFERON-TB Gold In Tube (QFT-G) assay at three time-points: at diagnosis (N = 60), after 2 months of intensive treatment (N = 47), and at 6 months (treatment completion) (N = 39).
Results
At baseline, 44 of 60 (73%) patients were positive by QFT-G. At the second time-point, 38 of 47 (81%) patients were positive. At treatment completion, 31 of 39 (79%) patients were positive. Changes in IFN-γ responses over time were highly inconsistent - some individuals showed increases, while others showed decreases or no changes. Although the average IFN-γ levels decreased slightly during treatment (not significant), the QFT-G sensitivity remained mostly unchanged during therapy.
Conclusions
Our data suggest that the QFT-G assay has modest sensitivity in patients with moderate to advanced pulmonary disease, but our results do not show a clear correlation between antigen burden and T-cell responses. Further research is needed to understand the kinetics of T-cell responses during TB treatment.
Introduction
A recent breakthrough in the diagnosis of tuberculosis (TB) infection has been the development of T-cell-based interferon-γ (IFN-γ) release assays (IGRAs) that use antigens (early secreted antigenic target-6 [ESAT-6] and culture filtrate protein 10 [CFP-10]) more specific than purified protein derivative (PPD) in the tuberculin skin test (TST). Two commercial IGRAs are now available, the QuantiFERON®-TB-Gold®; (QFT-G) (Cellestis Ltd, Australia), and the T-SPOT-TB®; (Oxford Immunotec, UK) test. Research evidence, reviewed elsewhere [1–3], suggests that IGRAs are more specific, better correlated with markers of TB exposure in low incidence settings, and less affected by BCG vaccination than the TST. In the absence of a gold standard for latent TB infection (LTBI), the sensitivity and specificity of IGRAs for LTBI are not well defined. In the US, the QFT-G can be used in place of the TST for all indications [4].
Although IGRAs are promising tests, unresolved issues remain [1–3, 5, 6]. One controversy is whether IGRAs are less sensitive than TST, especially in high-risk populations [1, 4, 7]. Secondly, it is unclear if IGRAs can be used for monitoring treatment responses. T-cell assay results appear to correlate with antigen (bacterial) load in a way that has not been previously demonstrated for TST [8–11]. It has been hypothesized, although not proven, that short incubation IGRAs (e.g. both commercial assays) detect responses of activated, effector T-cells (predominantly CD4 helper type 1 [Th1] cells) that have recently encountered antigens in vivo, and can therefore rapidly release IFN-γ when stimulated in vitro [8, 9, 12]. In contrast, long-lived central memory T-cells that may persist even after clearance of the organism (e.g. previously treated TB) may be less likely to release IFN-γ with short incubation. Effector response may be driven by the antigen (bacterial) load [13], and there is some evidence, although not consistent, that reduction of the antigen load by treatment decreases T-cell responses [8–11, 14, 15].
Although studies have examined the effect of active TB treatment on IFN-γ responses, the results have been inconsistent. As reviewed elsewhere [2, 3], some studies have shown declining responses after treatment [9–11], whereas others have shown unchanging, fluctuating, or increasing responses over treatment [16–19]. There are a number of possibilities that may explain the above-mentioned inconsistencies including varying laboratory protocols (e.g. ELISA vs ELISPOT), environmental factors and heterogeneity in T-cell subsets. Some studies have used short but not long incubation times (the latter is more likely to turn on IFN-γ producing central memory cells over several days whilst overnight assays are negative), different antigen type (peptide vs protein that may activate different innate pathways) or recombinant antigens that may be contaminated. Also, preliminary research studies have shown that IFN-γ responses can vary over time within the same individuals, and conversions and reversions can occur, as in the case of the tuberculin skin test [20]. Thus, further work is necessary to determine the longitudinal reproducibility of IGRAs, and to ascertain if IGRAs can be used for monitoring response to TB treatment. If shown to be useful, then IGRAs may be helpful as surrogate markers for long-term outcomes in the evaluation of new drugs and therapies.
We conducted a cohort study in rural India, to evaluate the sensitivity of the QuantiFERON-TB Gold® In Tube (QFT-G) assay in patients with newly diagnosed smear or culture-confirmed TB, and to determine longitudinal changes in IFN-γ responses in individuals before and after standard anti-TB treatment. This study builds on our previous evaluations of the QFT-G assay in rural India [19–22].
Materials and Methods
Between October 2004 and May 2005, we recruited a cohort of 60 patients with smear or culture confirmed pulmonary TB at a rural medical school hospital in India. Most (~80%) patients were recruited from the internal medicine wards. All patients were initiated on the standard short-course therapy for 6 months (isoniazid, rifampin, pyrazinamide and ethambutol for 2 months, self-administered daily, followed by isoniazid and rifampin for 4 months, self-administered daily) [23].
IFN-γ responses were measured using the commercial whole-blood QuantiFERON-TB Gold In Tube (QFT-G) assay at three time-points: at diagnosis (0 day), after 2 months of intensive treatment (60 days), and at 6 months (treatment completion, 180 days). IFN-γ responses to overlapping peptides representing ESAT-6, CFP-10, and a portion of TB7.7 (Rv2654) were measured by enzyme-linked immunosorbent assay (ELISA) after 24 h incubation, and IFN-γ ≥ 0.35 IU/ml (after correcting for nil control responses) was considered positive, as recommended by the manufacturer, and consistent with our previous studies in India [19–22]. Identical protocols were used for all QFT-G tests, and follow-up assays were performed blinded to the previous test results. To avoid inducing antigen specific T-cell responses by PPD, we did not perform the tuberculin skin test on any of the patients.
In addition to QFT-G, all participants underwent sputum smear examinations (direct Ziehl-Neelsen method) at 2 months and at treatment completion. Chest X-rays were used to detect cavitary lesions, and also grade radiological severity of disease as minimal, moderately advanced and far advanced, using a method described elsewhere [24, 25]. In minimal disease, the total extent of disease did not involve more than an area of lung equivalent to that above the second chondrosternal junction and the spine of the fourth thoracic vertebra. In moderately advanced disease, dense and confluent lesions did not exceed an area of one-third of the volume of one lung; non-confluent lesions of slight or moderate density did not exceed the area of one lung. Far advanced disease was any pattern more extensive than moderately advanced disease. Rapid HIV testing was also done in all patients after counseling. All participants gave informed consent, and the research was approved by ethics committees in India and USA.
Data were analyzed using Stata 9 (Stata Corporation, Texas). The main outcome was sensitivity of QFT-G among patients with microbiologically confirmed TB, and effect of treatment on QFT-G results, expressed as dichotomous (positive/negative) and continuous measures (IFN-γ expressed as international units per milliliter [IU/ml]). Because the QFT-G ELISA cannot accurately measure IFN-γ values > 10 IU/ml, values > 10 IU/ml were treated as 10 IU/ml.
Results
A total of 60 smear or culture positive TB patients (mean age 36.4 [range 18–76 years], 75% men, 16% cavitary disease, 5% HIV-positive) were recruited between October 2004 and May 2005. Of the 60 patients, 58 (97%) had positive culture confirmation, and 33 (55%) had moderately or far advanced disease on radiology. Of the 60 patients, 14 died during follow-up (23%), and 7 (12%) were lost to follow-up (Figure 1). Thus, follow-up was complete for 47 (78%) at the second time-point, and 39 (65%) patients at the third time point. However, the mean baseline IFN-γ level in the entire cohort of 60 patients (mean IFN-γ 4.0 IU/ml) was comparable to the mean level in the 39 patients who completed therapy (mean IFN-γ 4.3 IU/ml). Patients who died or were lost to follow-up were on an average 19 years older than those who successfully completed treatment. Analyses of longitudinal changes in IFN-γ responses was limited to those individuals who completed 6 months of TB treatment, and had valid IFN-γ levels measured at all three time points (0, 60, 180 days).
Figure 1.

Study profile.
At baseline, valid QFT-G results were available in all 60 patients; no assays were deemed indeterminate due to low response to mitogen. Of the 60 patients, 44 (73%) were positive by QFT-G at baseline. At the second time-point, 38 of 47 (81%) patients were QFT-positive. Sputum smear conversion was documented in 41 of 47 (87%) patients; of those who converted, 73 and 78% were QFT-positive at day 0 and 60 respectively. Among those who did not convert to smear negativity (N = 6), all were QFT-positive both at day 0 and 60. At treatment completion, 31 of 39 (79%) patients were QFT-positive. All 39 patients were smear-negative at treatment completion.
The pattern of changes in IFN-γ responses with treatment (among the 39 patients who successfully completed treatment and underwent all three QFT-G assays) was highly inconsistent; some individuals showed increases, while others showed decreases or no changes (Figure 2). Table 1 shows the results of the QFT-G assay, expressed as both proportion QFT-positive at each time-point, and mean IFN-γ levels at each time-point. In the 39 patients who completed TB treatment (and underwent all three QFT-G assays), the sensitivity of the assay at each time-point was 77, 82, and 79%, respectively (differences not statistically significant). Although the average IFN-γ levels declined slightly during treatment, the overall positivity rates were largely unaffected by treatment. Table 1 also shows the trend for changes in IFN-γ levels by subgroups; no significant differences were found for changes over time.
Figure 2.
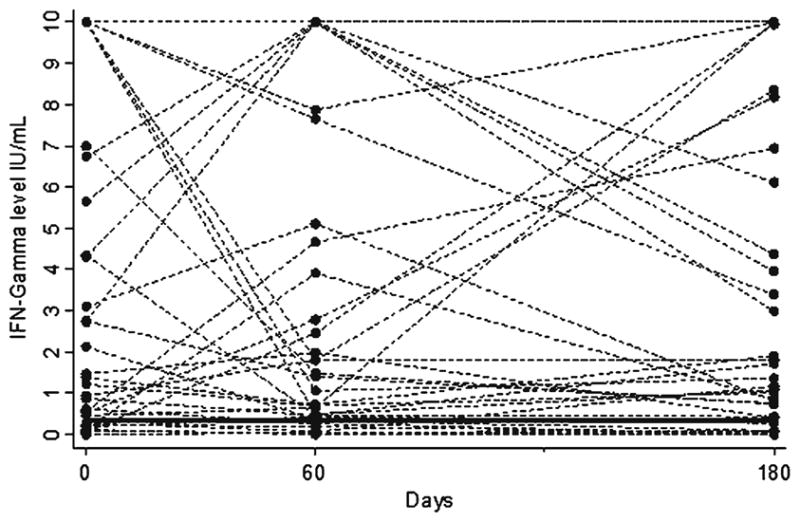
Individual variability in IFN-γ responses during TB treatment in patients who completed treatment and underwent all QFT-G assays (N = 39). QuantiFERON-TB Gold In Tube (QFT-G) assays were performed at three time-points: at baseline, after 2 months (after intensive phase of treatment), and at 6 months (treatment completion). IFN-γ values > 10 IU/ml are shown as 10 IU/ml. Horizontal solid line indicates the QFT-G cut-point (IFN-γ ≥ 0.35 IU/ml).
Table 1.
Trends in IFN-γ responses and QFT-G positivity in patients who completed TB treatment and underwent all QFT-G assays (N = 39).
| Participant characteristic | IFN-γ responses (corrected for nil control responses) in IU/ml |
QFT-G positivitya |
||||
|---|---|---|---|---|---|---|
| Day 0 | Day 60 | Day 180 | Day 0 | Day 60 | Day 180 | |
| Mean (SD) | Mean (SD) | Mean (SD) | Frequency (%) | Frequency (%) | Frequency (%) | |
| Age | ||||||
| 18–25 years (N = 19) | 4.7 (4.2) | 4.2 (4.5) | 2.9 (3.5) | 15 (79) | 15 (79) | 14 (74) |
| 26–50 years (N = 16) | 4.0 (4.4) | 3.6 (4.0) | 4.1 (4.3) | 11 (69) | 13 (81) | 13 (81) |
| 50 + years (N = 4) | 3.4 (4.5) | 5.3 (4.3) | 9.5 (0.9) | 4 (100) | 4 (100) | 4 (100) |
| Sex | ||||||
| Males (N = 28) | 4.1 (4.1) | 4.0 (4.1) | 4.5 (4.2) | 21 (75) | 24 (86) | 23 (82) |
| Females (N = 11) | 4.7 (4.6) | 4.1 (4.7) | 2.9 (3.7) | 9 (81) | 8 (73) | 8 (73) |
| Sputum smear grade | ||||||
| Negative/grade 1 (n = 32) | 4.0 (4.3) | 4.1 (4.2) | 4.2 (4.2) | 23 (72) | 26 (81) | 25 (78) |
| 2 or 3 + (n = 7) | 5.4 (3.7) | 4.0 (4.4) | 3.5 (4.4) | 7 (100) | 6 (86) | 6 (86) |
| Radiological severity | ||||||
| Normal (n = 2) | 0.01 (0.01) | 0.04 (0.01) | 0.07 (0.007) | 0 (0) | 0 (0) | 0 (0) |
| Minimal (n = 5) | 6.7 (4.5) | 3.9 (4.7) | 4.6 (5.0) | 5 (100) | 5 (100) | 4 (80) |
| Moderately advanced (n = 14) | 4.1 (4.3) | 4.9 (3.9) | 4.5 (4.1) | 11 (79) | 12 (85) | 12 (85) |
| Far advanced (n = 18) | 4.2(4.1) | 3.9 (4.5) | 4.0 (4.1) | 14 (78) | 15 (83) | 15 (83) |
| Cavity on chest x-ray | ||||||
| Present (n = 8) | 1.5 (1.2) | 2.6 (3.4) | 3.8 (4.7) | 7 (87) | 6 (75) | 6 (75) |
| Absent (n = 31) | 5.0 (4.4) | 4.4 (4.4) | 4.1 (4.0) | 23 (74) | 26 (84) | 25 (81) |
| BCG scar | ||||||
| Present (n = 16) | 3.9 (4.4) | 4.2 (4.5) | 4.3 (4.3) | 11 (69) | 12 (75) | 11 (69) |
| Absent (n = 23) | 4.6 (4.2) | 4.0 (4.1) | 3.9 (4.1) | 19 (83) | 20 (87) | 20 (87) |
| HIV | ||||||
| Positive (n = 2) | 10 (0) | 5.2 (6.7) | 5.5 (6.3) | 2 (100) | 2 (100) | 2 (100) |
| Negative (n = 37) | 4.0 (4.1) | 4.0 (4.1) | 4.0 (4.1) | 28 (76) | 30 (81) | 29 (78) |
| All patients (N = 39) | 4.3 (4.2) | 4.1 (4.2) | 4.1 (4.1) | 30 (77) | 32 (82) | 31 (79) |
QuantiFERON-TB Gold In Tube (QFT-G) was considered positive if IFN-γ level was ≥ 0.35 IU/mL
Discussion
Until recently, the only test for detection of LTBI was the TST. Although the TST has proven to be useful in clinical practice, it has several known limitations in accuracy and reliability [1, 2, 26, 27]. The emergence of IGRAs as alternatives to the TST is an important recent advance [1, 2]. Unlike the TST, IGRAs use highly specific TB antigens, and measure T-cell responses using ELISA or enzyme-linked immunospot (ELISPOT) methods. In contrast to the TST, there is some evidence that IGRA results correlate with antigen burden, and this has resulted in studies that have evaluated the effect of TB treatment on T-cell responses [1–3].
While some studies [9–11, 14], mostly ELISPOT based, have shown a consistent association between treatment and reduction of T-cell responses, other studies have shown amplified or robust responses, during or after anti-TB treatment [16, 18, 28, 29]. There is also some evidence that cured TB patients can retain strong ESAT-6 responses for several years after treatment [17]. In our previous study among highly exposed healthcare workers in India, even complete preventive therapy with isoniazid did not significantly reduce their high baseline IFN-γ levels [19]. In an environment with ongoing, intensive nosocomial exposure, healthcare workers had strong IFN-γ responses at baseline, and continued to have persistently elevated responses, despite LTBI treatment. It is plausible that persistence of infection and/or repeated exposures was responsible for this phenomenon [19].
Variations in disease severity, test reproducibility, incubation periods, antigens used (proteins vs peptides), possible endotoxin contamination, non-tuberculous my-cobacterial (NTM) exposure, and assay formats (ELISA vs ELISPOT) might explain some of the discrepancies reported by various studies [1]. Overall, at this time, it is not clear if IGRAs will have any useful role in monitoring bacterial burden and response to treatment. Also, for IGRAs to be useful in treatment monitoring, it is imperative to demonstrate that early trends (e.g. 4–12 weeks after treatment initiation) in IFN-γ responses will be predictive of treatment failure or relapse, and that IGRAs will be more effective that the current approach of using sputum smears for monitoring treatment. Such data do not currently exist.
Our study was done in a rural hospital in India, the country with the largest number of TB cases. To our knowledge, this is the first report of longitudinal changes in QFT-G results after treatment among TB patients in a developing country, measured using the latest In Tube version of the assay. Our data suggests that the QFT-G assay had a sensitivity of about 73–81% in patients with mostly moderate to advanced disease, with no major decline in sensitivity during TB treatment. Although there was a slight decrease in average IFN-γ responses over time, most of the changes occurred at levels far in excess of the QFT-G cut-point of 0.35 IU/ml. Also, there was considerable individual variability in the degree of changes in T-cell responses during treatment. Overall, our data suggest that the QFT-G assay has a modest sensitivity even in hospitalized patients with moderate to advanced disease, but our results do not show a clear correlation between antigen burden and T-cell responses.
As reviewed previously [1, 2, 7], most studies on IGRA have reported sensitivity estimates of around 70–95%, with slightly higher sensitivity for ELISPOT than whole-blood assays. In these studies, sensitivity was determined in patients with active TB, and active disease was used as surrogate for LTBI. Our sensitivity estimate is at the lower end of the reported range, probably because our cohort mostly included hospitalized patients with fairly severe disease. There is some evidence that IFN-γ responses may be depressed in individuals with advanced TB, presumably due to immunosuppression induced by extensive disease [24, 29]. Because very few of our patients were HIV-infected, it is unlikely that HIV associated anergy led to decreased sensitivity. Previous studies have shown an association between immunosuppression and indeterminate QFT-G results [5, 30, 31]. Interestingly, there were no indeterminate QFT-G results in our study, indicating that T-cell responses to mitogen were robust, despite the disease severity.
In view of the inconsistent prior literature, and lack of a strong evidence base on this topic, we put forth several tentative hypotheses that might explain our finding on lack of correlation with bacterial burden. First, in high incidence settings, individuals with TB may have very strong IFN-γ responses at diagnosis; the mean IFN-γ levels at baseline was 4.09 IU/ml (SD 4.14) in our cohort, much higher than the QFT-G cut-point of 0.35 IU/ml. Unless the IFN-γ levels drop sharply over a relatively short period, it is unlikely QFT-G will revert to negativity, even after successful treatment. Second, in high burden countries, ongoing exposure and/or exogenous re-infection might keep the effector T-cells partially activated, and therefore T-cell responses remain strong even after antigen load declines with therapy [19]. Interestingly, some individuals had a transient decline in T cell responses shortly after treatment, but much higher responses towards the end of therapy. It is plausible that these individuals were re-exposed during TB treatment, either to M. tuberculosis or non-tuberculous mycobacteria (NTM) that can potentially cross-react with IGRAs. In India, exposure to both M. tuberculosis [32] and NTM [33] are common and widespread.
Third, the duration of follow-up in our study may have been inadequate. It might take longer for IFN-γ levels to decline to negativity after treatment. In a recent study in The Gambia, T-cell responses were significantly lower 1 year after initiation of TB treatment [10]. Fourth, it is possible, although not proven, that the ELISPOT assay is more correlated with bacterial burden than the whole-blood QFT-G assay. Thus far, ELISPOT studies have shown the strongest trends in reduction of T-cell responses after treatment [9–11, 14, 15]. Although large-scale confirmatory studies are awaited, available studies suggest that the ELISPOT technology is probably a more sensitive method for detecting T-cell IFN-γ responses than the whole-blood platform [34, 35].
Fifth, although our study was not designed to evaluate reproducibility, some of the observed variability in IFN-γ responses could merely reflect reproducibility of the QFT-G assay. There are limited data on the amount of random, biological within-subject variability of IFN-γ responses over time, although preliminary work suggests that conversions and reversions can occur with serial IGRA testing, as they do with the TST [20]. Studies are needed to evaluate IGRA reproducibility during serial testing, and separate its contribution to the overall variability from that of the variability induced by treatment.
Lastly, most patients in our study were hospitalized, and had moderate to advanced disease. It is plausible that in patients with severe disease, standard 6-month short course treatment is inadequate to eliminate all bacteria (even if sputum smears become negative). Persistent bacteria, even in low numbers, might keep T-cells activated, and cause detectable IFN-γ responses. Longer treatment and follow-up may be necessary to completely clear the antigen burden and demonstrate declining T-cell responses.
Our study had several limitations, in addition to the small sample size. First, all patients could not be successfully followed up because of deaths and losses to follow-up; this resulted in a selected group of individuals with favorable prognosis. Second, because most patients were hospitalized and had severe disease, our results may not be applicable in patients with milder forms of TB. Last, longer follow-up might be needed to better appreciate the effect of treatment on T-cell responses, and to determine if individuals with strong T-cell responses after treatment are more likely to develop recurrent TB.
Despite the limitations, our data offer some interesting preliminary insights into T-cell kinetics among TB patients on treatment in a rural, developing country setting. Our data suggests that TB patients with predominantly moderate to advanced TB disease have persistently elevated T-cell responses, despite TB treatment. This is highly consistent with what we previously found among Indian health-care workers who were treated for latent tuberculosis [19]. Further research is needed to better understand why T-cell responses stay persistently elevated in high burden settings such as India. Research is also needed to study reproducibility of IGRAs during serial testing, T-cell decay kinetics during TB treatment, and determine the effect of TB treatment on host immune responses.
Acknowledgments
This work was supported in part by a training grant from the Fogarty AIDS International Training Program (grant 1-D43-TW00003-17), University of California, Berkeley, and by the Canadian Institutes of Health Research (CIHR), operating grant MOP-81362. We thank the TB patients at MGIMS hospital, Seva-gram, for their participation; and P. Dhone, S. Chavhan, P. Raut, and S. Taksande, for their contributions to this project.
Contributor Information
M. Pai, Dept. of Epidemiology, Biostatistics and Occupational Health, McGill University, 1020 Pine Avenue West, Montreal, QC, Canada H3A 1A2; Phone: (+1/514) 398-5422, Fax: -4503, Dept. of Medicine and Microbiology, Mahatma Gandhi Institute of Medical Sciences, Sevagram, India
R. Joshi, Dept. of Medicine and Microbiology, Mahatma Gandhi Institute of Medical Sciences, Sevagram, India, Division of Epidemiology, School of Public Health, University of California, Berkeley, CA, USA
M. Bandyopadhyay, Dept. of Medicine and Microbiology, Mahatma Gandhi Institute of Medical Sciences, Sevagram, India
P. Narang, Dept. of Medicine and Microbiology, Mahatma Gandhi Institute of Medical Sciences, Sevagram, India
S. Dogra, Dept. of Medicine and Microbiology, Mahatma Gandhi Institute of Medical Sciences, Sevagram, India
B. Taksande, Dept. of Medicine and Microbiology, Mahatma Gandhi Institute of Medical Sciences, Sevagram, India
S. Kalantri, Dept. of Medicine and Microbiology, Mahatma Gandhi Institute of Medical Sciences, Sevagram, India
References
- 1.Pai M, Kalantri S, Dheda K. New tools and emerging technologies for the diagnosis of tuberculosis: Part 1. Latent tuberculosis. Expert Rev Mol Diag. 2006;6:413–422. doi: 10.1586/14737159.6.3.413. [DOI] [PubMed] [Google Scholar]
- 2.Pai M, Riley LW, Colford JM., Jr Interferon-gamma assays in the immunodiagnosis of tuberculosis: a systematic review. Lancet Infect Dis. 2004;4:761–776. doi: 10.1016/S1473-3099(04)01206-X. [DOI] [PubMed] [Google Scholar]
- 3.Dheda K, Udwadia ZF, Huggett JF, Johnson MA, Rook GA. Utility of the antigen-specific interferon-gamma assay for the management of tuberculosis. Curr Opin Pulm Med. 2005;11:195–202. doi: 10.1097/01.mcp.0000158726.13159.5e. [DOI] [PubMed] [Google Scholar]
- 4.Mazurek GH, Jereb J, Lobue P, Iademarco MF, Metchock B, Vernon A. Guidelines for using the QuantiFERON-TB Gold test for detecting Mycobacterium tuberculosis infection, United States. MMWR Recomm Rep. 2005;54:49–55. [PubMed] [Google Scholar]
- 5.Pai M, Lewinsohn DM. Interferon-{gamma} assays for tuberculosis: is anergy the achilles’ heel? Am J Respir Crit Care Med. 2005;172:519–521. doi: 10.1164/rccm.2506003. [DOI] [PubMed] [Google Scholar]
- 6.Pai M, Kalantri S, Menzies D. Discordance between tuberculin skin test and interferon-gamma assays. Int J Tuberc Lung Dis. 2006;10:942–943. [PubMed] [Google Scholar]
- 7.Pai M, Menzies D. Interferon-gamma release assays: what is their role in the diagnosis of active tuberculosis? Clin Infect Dis. 2007;44:74–77. doi: 10.1086/509927. [DOI] [PubMed] [Google Scholar]
- 8.Lalvani A. Counting antigen-specific T-cells: a new approach for monitoring response to tuberculosis treatment? Clin Infect Dis. 2004;38:757–759. doi: 10.1086/381763. [DOI] [PubMed] [Google Scholar]
- 9.Carrara S, Vincenti D, Petrosillo N, Amicosante M, Girardi E, Goletti D. Use of a T-cell-based assay for monitoring efficacy of anti-tuberculosis therapy. Clin Infect Dis. 2004;38:754–756. doi: 10.1086/381754. [DOI] [PubMed] [Google Scholar]
- 10.Aiken AM, Hill PC, Fox A, et al. Reversion of the ELISPOT test after treatment in Gambian tuberculosis cases. BMC Infect Dis. 2006;6:66. doi: 10.1186/1471-2334-6-66. [DOI] [PMC free article] [PubMed] [Google Scholar]
- 11.Pathan AA, Wilkinson KA, Klenerman P, et al. Direct ex vivo analysis of antigen-specific IFN-gamma-secreting CD4 T-cells in Mycobacterium tuberculosis-infected individuals: associations with clinical disease state and effect of treatment. J Immunol. 2001;167:5217–5225. doi: 10.4049/jimmunol.167.9.5217. [DOI] [PubMed] [Google Scholar]
- 12.Leyten EM, Mulder B, Prins C, et al. Use of enzyme-linked immunospot assay with mycobacterium tuberculosis-specific peptides for diagnosis of recent infection with M. tuberculosis after accidental laboratory exposure. J Clin Microbiol. 2006;44:1197–1201. doi: 10.1128/JCM.44.3.1197-1201.2006. [DOI] [PMC free article] [PubMed] [Google Scholar]
- 13.Godkin AJ, Thomas HC, Openshaw PJ. Evolution of epitope-specific memory CD4(+) T-cells after clearance of hepatitis C virus. J Immunol. 2002;169:2210–2214. doi: 10.4049/jimmunol.169.4.2210. [DOI] [PubMed] [Google Scholar]
- 14.Lalvani A, Nagvenkar P, Udwadia Z, et al. Enumeration of T-cells specific for RD1-encoded antigens suggests a high prevalence of latent Mycobacterium tuberculosis infection in healthy urban Indians. J Infect Dis. 2001;183:469–477. doi: 10.1086/318081. [DOI] [PubMed] [Google Scholar]
- 15.Ewer K, Millington KA, Deeks JJ, Alvarez L, Bryant G, Lalvani A. Dynamic antigen-specific T-cell responses after point-source exposure to Mycobacterium tuberculosis. Am J Respir Crit Care Med. 2006;174:831–839. doi: 10.1164/rccm.200511-1783OC. [DOI] [PubMed] [Google Scholar]
- 16.Al-Attiyah R, Mustafa AS, Abal AT, Madi NM, Andersen P. Restoration of mycobacterial antigen-induced proliferation and interferon-gamma responses in peripheral blood mononuclear cells of tuberculosis patients upon effective chemotherapy. FEMS Immunol Med Microbiol. 2003;38:249–256. doi: 10.1016/S0928-8244(03)00166-4. [DOI] [PubMed] [Google Scholar]
- 17.Wu-Hsieh BA, Chen CK, Chang JH, et al. Long-lived immune response to early secretory antigenic target-6 in individuals who had recovered from tuberculosis. Clin Infect Dis. 2001;33:1336–1340. doi: 10.1086/323044. [DOI] [PubMed] [Google Scholar]
- 18.Ulrichs T, Anding R, Kaufmann SH, Munk ME. Numbers of IFN-gamma-producing cells against ESAT-6 increase in tuberculosis patients during chemotherapy. Int J Tuberc Lung Dis. 2000;4:1181–1183. [PubMed] [Google Scholar]
- 19.Pai M, Joshi R, Dogra S, et al. Persistently elevated T-cell interferon-gamma responses after treatment for latent tuberculosis infection among health care workers in India: a preliminary report. J Occup Med Toxicol. 2006;1:7. doi: 10.1186/1745-6673-1-7. [DOI] [PMC free article] [PubMed] [Google Scholar]
- 20.Pai M, Joshi R, Dogra S, et al. Serial testing of health care workers for tuberculosis using interferon-gamma assay. Am J Respir Crit Care Med. 2006;174:349–355. doi: 10.1164/rccm.200604-472OC. [DOI] [PMC free article] [PubMed] [Google Scholar]
- 21.Pai M, Gokhale K, Joshi R, et al. Mycobacterium tuberculosis infection in health care workers in rural India: comparison of a whole-blood, interferon-g assay with tuberculin skin testing. JAMA. 2005;293:2746–2755. doi: 10.1001/jama.293.22.2746. [DOI] [PubMed] [Google Scholar]
- 22.Dogra S, Narang P, Mendiratta DK, et al. Comparison of a whole blood interferon-gamma assay with tuberculin skin testing for the detection of tuberculosis infection in hospitalized children in rural India. J Infect. 2007;54:267–276. doi: 10.1016/j.jinf.2006.04.007. [DOI] [PubMed] [Google Scholar]
- 23.Hopewell PC, Pai M, Maher D, Uplekar M, Raviglione MC. International standards for tuberculosis care. Lancet infect Dis. 2006;6:710–725. doi: 10.1016/S1473-3099(06)70628-4. [DOI] [PubMed] [Google Scholar]
- 24.Sodhi A, Gong J, Silva C, Qian D, Barnes PF. Clinical correlates of interferon gamma production in patients with tuberculosis. Clin Infect Dis. 1997;25:617–620. doi: 10.1086/513769. [DOI] [PubMed] [Google Scholar]
- 25.Kardjito T, Grange JM. Immunological and clinical features of smear-positive pulmonary tuberculosis in East Java. Tubercle. 1980;61:231–238. doi: 10.1016/0041-3879(80)90043-4. [DOI] [PubMed] [Google Scholar]
- 26.Menzies RI. Tuberculin skin testing. In: Reichman LB, Hershfield ES, editors. Tuberculosis: a comprehensive international approach. Marcel Dekker; New York: 2000. pp. 279–322. [Google Scholar]
- 27.Farhat M, Greenaway C, Pai M, Menzies D. False-positive tuberculin skin tests: what is the absolute effect of BCG and non-tuberculous mycobacteria? Int J Tuberc Lung Dis. 2006;10:1192–1204. [PubMed] [Google Scholar]
- 28.Ferrand RA, Bothamley GH, Whelan A, Dockrell HM. Interferon-gamma responses to ESAT-6 in tuberculosis patients early into and after anti-tuberculosis treatment. Int J Tuberc Lung Dis. 2005;9:1034–1039. [PubMed] [Google Scholar]
- 29.Vekemans J, Lienhardt C, Sillah JS, et al. Tuberculosis contacts but not patients have higher gamma interferon responses to ESAT-6 than do community controls in The Gambia. Infect Immun. 2001;69:6554–6557. doi: 10.1128/IAI.69.10.6554-6557.2001. [DOI] [PMC free article] [PubMed] [Google Scholar]
- 30.Ferrara G, Losi M, Meacci M, et al. Routine hospital use of a new commercial whole blood interferon-gamma assay for the diagnosis of tuberculosis infection. Am J Respir Crit Care Med. 2005;172:631–635. doi: 10.1164/rccm.200502-196OC. [DOI] [PubMed] [Google Scholar]
- 31.Brock I, Ruhwald M, Lundgren B, Westh H, Mathiesen LR, Ravn P. Latent tuberculosis in HIV positive, diagnosed by the M. Tuberculosis specific interferon gamma test. Respir Res. 2006;7:56. doi: 10.1186/1465-9921-7-56. [DOI] [PMC free article] [PubMed] [Google Scholar]
- 32.Chadha VK, Kumar P, Jagannatha PS, Vaidyanathan PS, Unnikrishnan KP. Average annual risk of tuberculous infection in India. Int J Tuberc Lung Dis. 2005;9:116–118. [PubMed] [Google Scholar]
- 33.Chakraborty AK, Ganapathy KT, Nair SS, Bhushan K. Prevalence of non-specific sensitivity of tuberculin in a South Indian rural population. Indian J Med Res. 1976;64:639–651. [PubMed] [Google Scholar]
- 34.Ferrara G, Losi M, D’Amico R, et al. Use in routine clinical practice of two commercial blood tests for diagnosis of infection with Mycobacterium tuberculosis: a prospective study. Lancet. 2006;367:1328–1334. doi: 10.1016/S0140-6736(06)68579-6. [DOI] [PubMed] [Google Scholar]
- 35.Lee JY, Choi HJ, Park IN, et al. Comparison of two commercial interferon gamma assays for diagnosing Mycobacterium tuberculosis infection. Eur Respir J. 2006;28:24–30. doi: 10.1183/09031936.06.00016906. [DOI] [PubMed] [Google Scholar]