

SUMMARY
BACKGROUND
Interferon-gamma assays (IGRAs) are alternatives to the tuberculin skin test (TST), but IGRA conversions and reversions are not well understood. In a pilot study, we determined conversions and reversions using QuantiFERON-TB Gold In-Tube® (QFT) among household contacts of TB cases, and evaluated the effect of using various definitions and criteria for conversions.
DESIGN
In a cohort of 250 contacts in India, 46% were TST-positive at baseline and 54% were QFT-positive. We re-tested this cohort after 12 months. Conversion rates were estimated using several definitions.
RESULTS
Of the 250 contacts, 205 (82%) underwent re peat testing. Among 85 contacts with baseline TST-negative/QFT-negative results, TST conversion rates ranged between 7.5% and 13.8%, and QFT conversion rates ranged between 11.8% and 21.2%, depending on the definitions used. Among 109 contacts who were QFT-positive at baseline, seven (6.4%) had QFT reversions. QFT reversions were most likely when the baseline TST was negative and QFT results were just above the diagnostic cut-off.
CONCLUSIONS
QFT conversions and reversions occurred among contacts of TB cases. Conversion rates seemed to vary, depending on the test and definitions used for conversions. These findings need to be verified in larger studies in various settings.
Keywords: tuberculosis, interferon-gamma assay, tuberculin skin test, QuantiFERON-TB Gold, contacts, serial testing
Serial testing for latent tuberculosis infection (LTBI) is recommended for populations at ongoing risk of TB exposure, including contacts and health care workers. However, the interpretation of serial tuberculin skin testing (TST) is challenging because of non-specific variations, boosting, conversions and reversions.1
Interferon-gamma (IFN-γ) release assays (IGRAs) provide a new tool for LTBI diagnosis and surveillance for new TB infection.2,3 Two commercial IGRAs are now available and approved by the US Food and Drug Administration (FDA): the QuantiFERON-TB Gold In-Tube® (QFT) assay (Cellestis Limited, Carnegie, Victoria, Australia) and the T-SPOT.TB assay (Oxford Immunotec, Oxford, UK). IGRAs have features that are advantageous compared with TST for serial testing: they are highly specific and are therefore unaffected by prior bacille Calmette-Guérin (BCG) vaccination; as they can be repeated without concern with boosting, there is no need for a baseline two-step testing protocol; and the testing protocol requires only one visit.4 IGRAs could therefore potentially provide a more accurate estimate of the annual risk of TB infection (ARTI) in specific populations.5,6
Although IGRAs have been recommended for serial testing,7 data are scarce on the interpretation of repeated IGRA results. Existing studies, although limited, suggest that conversions, reversions and non-specific variations occur with IGRA serial testing, just as they do with TST serial testing.8–15 However, there is no consensus on how to define and interpret IGRA conversions and reversions.4,5 Some guidelines have therefore not recommended IGRAs for serial testing, 16,17 while others have stated that they may be used for serial testing in the place of TST.7,18–20
Household contacts are at risk for acquiring TB infection. Approximately half of all household contacts in low- and middle-income countries are likely to be TST-positive.21 Although IGRAs have shown promise in contact and outbreak studies in low-incidence countries,22–28 published data from high-incidence countries are inconsistent.29–31 We conducted a prospective, serial-testing pilot study among TB contacts in India. Although we did not design a typical contact investigation study, we chose to study household contacts because of the expected high rates of conversions in the Indian setting. Our objectives were to determine the incidence of TST and QFT conversions, and to assess whether different tests and variations in definitions are likely to produce different rates of conversions and estimate rates of QFT reversions.
METHODS
Study population
We established a cohort of household contacts at the Mahatma Gandhi Institute of Medical Sciences (MGIMS), Sevagram, India. Between February and June 2006, 250 contacts of 54 smear-positive index cases were recruited (culture and HIV results were not available for most patients, as these tests were not routinely performed). The study was approved by the ethics committees at the MGIMS Hospital and the University of California, San Francisco. Written informed consent was obtained from adult participants. In the case of children, verbal assent and parental consent were obtained.
Test procedures
TST was performed using the Mantoux method using 2 tuberculin units (TU) of purified protein derivative-RT23, and results were read using a blinded caliper after 48–72 h by a trained, certified reader. In a previous study, this tuberculin reader had demonstrated excellent inter-reader agreement.32 An induration of ≥ 10 mm was considered as positive at baseline, in accordance with Indian guidelines.33 Immediately after the TST, blood was collected into the QFT tubes and transported to the laboratory within 6 h. After over-night incubation, enzyme-linked immunosorbent assay (ELISA) was performed according to the manufacturer’s instructions. The cut-off value for a positive QFT was IFN-γ ≥ 0.35 international units (IU)/ml (after accounting for nil control and mitogen control results). Because the ELISA cannot precisely measure absolute IFN-γ values >10 IU/ml, such values were treated as 10 IU/ml.
Follow-up testing
In 2007, approximately 12 months after the baseline testing, we re-surveyed the cohort. Follow-up TST was offered only to those who had TST <10 mm at baseline. Follow-up QFT was offered to all contacts, regardless of TST results. To minimise variability, identical protocols were used for baseline and follow-up tests. Follow-up TST and QFT was performed by the same personnel, blinded to the previous results.
Definitions of conversions and reversions
Because one of our objectives was to assess whether variations in definitions produce different rates of conversions, we used two definitions for TST conversions and four definitions for QFT conversions. These were decided a priori, based on prior work8,34 and published recommendations.1,7,35 Furthermore, an exploratory post-hoc analysis was made using an ‘uncertainty zone’.
For TST conversions, the definitions were: 1) baseline TST < 10 mm and follow-up TST ≥ 10 mm, with an increment of 6 mm (less stringent); and 2) baseline TST < 10 mm and follow-up TST ≥ 10 mm, with an increment of 10 mm (more stringent). While the more sensitive 6 mm increment has been suggested because random variations will result in differences of <6 mm,1 the 10 mm increment cut-off is more specific and recommended by the American Thoracic Society (ATS) and the US Centers for Disease Control (CDC).35 Participants with TST conversions were evaluated for TB disease and referred for preventive treatment.
We explored four definitions for QFT conversion. From the least stringent to the most stringent, these were: 1) baseline IFN-γ <0.35 IU/ml and follow-up IFN-γ ≥ 0.35 IU/ml (i.e., a negative to positive change, as recommended by the CDC);7 2) baseline IFN-γ < 0.35 IU/ml and follow-up IFN-γ ≥ 0.35 IU/ml, plus a 30% increase in IFN-γ over the baseline value (based on previous data on reproducibility of QFT results when repeated over time;34 3) baseline IFN-γ < 0.35 IU/ml and follow-up IFN-γ ≥ 0.35 IU/ml, plus an absolute increase of 0.35 IU/ml over the baseline value;8 and 4) baseline IFN-γ < 0.35 IU/ml and follow-up IFN-γ ≥ 0.70 IU/ml8 (twice the manufacturer’s diagnostic cutoff point and the most stringent definition).
QFT reversions were defined as baseline IFN-γ ≥ 0.35 and follow-up IFN-γ < 0.35 IU/ml. Because participants who were TST-positive (≥10 mm) at baseline did not undergo repeat testing, TST reversion rates could not be determined.
Uncertainty zone analyses
In a previous report, Harada et al. had suggested the use of a ‘grey zone’ for QFT results (0.10–0.35 IU/ml) and had suggested excluding results in the grey zone from conversion rate calculations.36 We explored an alternative approach of drawing a ‘zone of uncertainty’ on both sides of the existing QFT cut-off of 0.35 IU/ml (Figure 1). Arbitrarily, we chose 0.20–0.50 IU/ml as the uncertainty zone. Any value <0.20 IU/ml was considered ‘definitely negative’, and any value >0.50 IU/ml was considered ‘definitely positive’. Those in the uncertainty zone were considered to have ‘uncertain status’. A person whose IFN-γ result increased from <0.20 and exceeded 0.50 IU/ml on the repeat test was considered to have a ‘true conversion’. Likewise, a person whose IFN-γ result decreased from >0.50 and fell to <0.20 IU/ml was considered to have a ‘true reversion’. Results that fluctuated within the uncertainty zone during repeat testing were considered ‘doubtful conversions’ or ‘doubtful reversions’.
Figure 1.
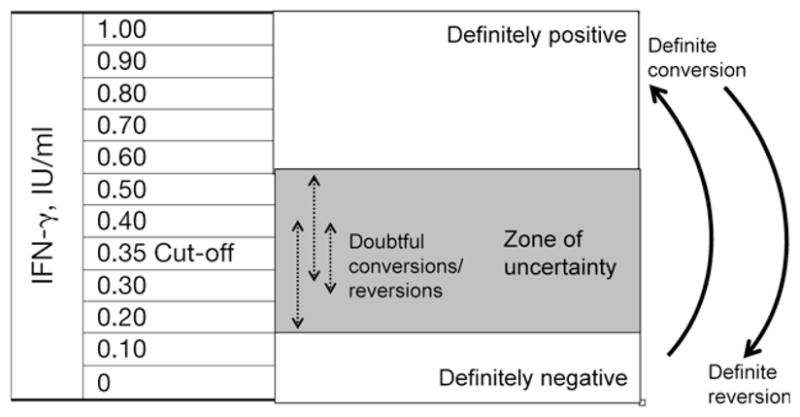
Schematic of the uncertainty zone analysis. IFN-γ results from the QFT assay were obtained and 0.20–0.50 IU/ml was designated as the uncertainty zone. Any value <0.20 IU/ml was considered ‘definitely negative’, and any value >0.50 IU/ml was considered ‘definitely positive’. Those in the uncertainty zone were considered to have ‘uncertain’ status. A person whose IFN-γ result increased from <0.20 and >0.50 IU/ml on the repeat test was considered to have a ‘true conversion’. Likewise, a person whose QFT result decreased from a value >0.50 and fell to <0.20 IU/ml was considered to have a ‘true reversion’. Results that fluctuated within the uncertainty zone during repeat testing were considered ‘doubtful conversions’ or ‘doubtful reversions’. IFN-γ = interferon gamma; QFT = QuantiFERON-TB Gold In-Tube®.
Statistical analyses
Analyses performed using Stata/IC 10.0 (Stata Corp, College Station, TX, USA) involved the estimation of incidence of TST and QFT conversions (after accounting for household clustering) using varying definitions and incidence of QFT reversions. Concordance between dichotomised TST and QFT conversions was evaluated using agreement and kappa (κ) statistics.
RESULTS
Study cohort and baseline results
Figure 2 shows the study profile. The baseline characteristics of the study cohort are shown in Table 1: 57% of the cohort was female and 60% had BCG scars. The median age was 25 years, with 18% aged ≤12 years. Of the children aged ≤12 years, none were <5 years of age. Housewives and students made up nearly 70% of the cohort. The baseline TST and QFT results are shown in Figure 2. All of the 250 contacts had valid (i.e., no indeterminate) baseline TST and QFT results, and 46% were TST-positive at baseline (cut-off ≥10 mm); 54% of the 250 contacts were QFT-positive at baseline (≥0.35 IU/ml cut-off). The baseline concordance between the two tests was 82% (κ = 0.63). At baseline, one participant had active TB and was referred for treatment.
Figure 2.

Study profile. TST positivity was induration ≥10 mm. QFT positivity was IFN-γ ≥ 0.35 IU/ml. TST = tuberculin skin test; QFT = QuantiFERON-TB Gold In-Tube®; IFN-γ = interferon-gamma; IU = international units.
Table 1.
Baseline characteristics of the study cohort (N = 250)
| Characteristics | Participants n (%) |
|---|---|
| Sex | |
| Female | 143 (57) |
| Male | 107 (43) |
| Median age, years (range) | 25 (6–83) |
| Age distribution, years | |
| 0–12 | 45 (18) |
| 13–20 | 51 (20) |
| 21–40 | 98 (39) |
| ≥ 41 | 56 (22) |
| BCG scar present | 149 (60) |
| Education | |
| No schooling | 35 (14) |
| High school or less | 203 (81) |
| Diploma/Bachelor’s or higher | 12 (5) |
| Job category | |
| Labourer/farmer | 49 (20) |
| Self-employed, teacher, small business | 21 (8) |
| Housewife | 75 (30) |
| Student | 96 (38) |
| None | 9 (4) |
| Relationship to the index case | |
| Spouse | 31 (12) |
| Son or daughter | 46 (18) |
| Sibling | 36 (14) |
| Parent or grandparent | 41 (16) |
| Others | 96 (40) |
| Sleeping proximity to the index case | |
| Slept in the same house as index case | 201 (80) |
| Slept in a different house | 49 (20) |
| Average amount of time spent with the index case per day | |
| Spent <3 h with index case | 115 (46) |
| Spent 3–6 h with index case | 103 (41) |
| Spent >6 h with index case | 32 (13) |
BCG = bacille Calmette-Guérin.
Incidence of TST and QFT conversions
Of the 250 contacts, 205 (82%) participated in the repeat survey (Figure 2). All 205 contacts underwent repeat QFT testing, while repeat TST was performed and read in 101 participants. No new cases of active TB disease had occurred among the 205 contacts during the follow-up period.
Conversion rates were determined in two groups: 1) among contacts who had positive TST and negative QFT results at baseline (i.e., TST-positive/QFT-negative), and 2) negative TST and QFT results at baseline (i.e., TST-negative/QFT-negative). In the former group, only QFT conversions could be estimated. In the latter group, both TST and QFT conversions were determined.
Among 11 contacts with baseline TST-positive/QFT-negative results and valid follow-up QFT data, four (36%) had QFT conversions using the simple positive-to-negative change as the definition. Of these four conversions, two were associated with a 0–0.43 IU/ml change in IFN-γ, one was associated with a 0.19–5.94 IU/ml change, and one increased from 0.34 to 1.46 IU/ml.
Among 85 contacts with baseline TST-negative/QFT-negative results, the estimated rates of QFT conversions, using four different definitions, ranged between 11.8% and 21.2% (Table 2 and Figure 3). The highest conversion rate of 21.2% (95% confidence interval [CI] 13–31) was estimated with the least stringent definition of negative to positive, and also with the definition that required a 30% increase over the baseline IFN-γ value. The most stringent definition of an increase from <0.35 IU/ml to ≥0.70 IU/ml produced the lowest conversion rate of 11.8% (95%CI 6–20). Although the CIs overlapped, there was nearly a two-fold difference between the most and least stringent definitions for QFT conversion. With TST, the conversion rate estimates ranged between 7.5% and 13.8%. With the most stringent definition of a 10 mm increment, the TST conversion rate was 7.5% (95%CI 3–16%). Although the CIs overlapped, this TST conversion rate is almost three-fold lower than the QFT conversion rate with the least stringent definition.
Table 2.
Incidence of TST and QFT conversions among household contacts with concordant negative results at baseline
| Criteria for conversion | Number with repeated tests* | Conversions n | Annual incidence of conversions % | 95%CI |
|---|---|---|---|---|
| TST | ||||
| Baseline TST < 10 mm, repeat TST ≥ 10 mm, plus a 6 mm increase over the baseline | 80 | 11 | 13.8 | 7–23 |
| Baseline TST < 10 mm, repeat TST ≥ 10 mm, plus a 10 mm increase over the baseline | 80 | 6 | 7.5 | 3–16 |
| QFT | ||||
| Baseline IFN-γ < 0.35 IU/ml, repeat IFN-γ ≥ 0.35 IU/ml | 85 | 18 | 21.2 | 13–31 |
| Baseline IFN-γ < 0.35 IU/ml, repeat IFN-γ ≥ 0.35 IU/ml, plus a 30% increase over the baseline | 85 | 18 | 21.2 | 13–31 |
| Baseline IFN-γ < 0.35 IU/ml, repeat IFN-γ ≥ 0.35, plus an absolute increase of 0.35 IU/ml over the baseline | 85 | 15 | 17.6 | 10–27 |
| Baseline IFN-γ < 0.35 IU/ml, repeat IFN-γ ≥ 0.70 IU/ml | 85 | 10 | 11.8 | 6–20 |
Only contacts with baseline concordant negative (QFT-negative/TST-negative) results were included in this analysis.
TST = tuberculin skin test; QFT = QuantiFERON-TB Gold In-Tube®; CI = confidence interval; IFN-γ = interferon-gamma.
Figure 3.

Incidence of TST and QFT conversions among household contacts with concordant negative results at baseline. TST = tuberculin skin test; IFN-γ = interferon-gamma; IU = international units; QFT = Quanti FERON-TB Gold In-Tube®.
Uncertainty zone analysis results
Table 3 shows the absolute changes in TST and IFN-γ levels in 18 household contacts who had QFT conversions using the least stringent definition. Among these 18 contacts, the uncertainty zone analysis suggested that ‘true conversions’ occurred in nine of the 18 (50%). In these nine cases, the IFN-γ value changed from defiitely negative to definitely positive status. There were no cases of doubtful conversions. Four of the 18 (22%) individuals moved from a definitely negative status into the uncertainty zone, and 5/18 (28%) moved from the uncertainty zone to definitely positive status.
Table 3.
Changes in absolute TST induration and IFN-γ values in 18 household contacts who had QFT conversions*
| ID | Age/sex | BCG scar | TST induration, mm |
QFT result (IFN-γ, IU/ml) |
||||
|---|---|---|---|---|---|---|---|---|
| Baseline | Repeat | Difference | Baseline | Repeat | Difference | |||
| 1 | 24/female | Yes | 0 | 0 | 0 | 0.01 | 0.67 | 0.66 |
| 2 | 55/female | No | 0 | 0 | 0 | 0.22 | 1.18 | 0.96 |
| 3 | 50/female | No | 4 | 3 | −1 | 0.11 | 0.40 | 0.29 |
| 4 | 16/male | Yes | 5 | 3 | −2 | 0.06 | 0.46 | 0.40 |
| 5 | 8/male | Yes | 0 | 5 | 5 | 0.02 | 0.68 | 0.66 |
| 6 | 35/female | Yes | 4 | 6 | 2 | 0.01 | 0.38 | 0.37 |
| 7 | 18/male | Yes | 4 | 6 | 2 | 0 | 0.49 | 0.49 |
| 8 | 10/male | Yes | 0 | 7 | 7 | 0 | 1.14 | 1.14 |
| 9 | 23/female | Yes | 6 | 9 | 3 | 0.19 | 0.98 | 0.79 |
| 10 | 10/male | Yes | 0 | 11 | 11 | 0.29 | 0.62 | 0.33 |
| 11 | 44/male | Yes | 5 | 11 | 6 | 0.07 | 0.86 | 0.79 |
| 12 | 49/male | Yes | 5 | 14 | 9 | 0.24 | 0.51 | 0.27 |
| 13 | 20/female | Yes | 0 | 15 | 15 | 0.19 | 3.59 | 3.40 |
| 14 | 18/male | Yes | 0 | 15 | 15 | 0.01 | 10.0 | 9.99 |
| 15 | 40/male | Yes | 5 | 15 | 10 | 0.24 | 1.05 | 0.81 |
| 16 | 18/female | Yes | 0 | 19 | 19 | 0.01 | 1.95 | 1.94 |
| 17 | 20/female | No | 0 | NA | NA | 0.21 | 3.24 | 3.03 |
| 18 | 18/female | Yes | 0 | NA | NA | 0 | 10.0 | 10.0 |
QFT conversion defined as baseline IFN-γ < 0.35 IU/ml, repeat IFN-γ ≥ 0.35 IU/ml.
TST = tuberculin skin test; IFN-γ = interferon-gamma; IU = international units; QFT = QuantiFERON-TB Gold In-Tube®; BCG = bacille Calmette-Guérin; NA = not available.
Concordance between TST and QFT conversions
Concordance between TST and QFT conversions is shown in Table 4. The concordance estimates were high, ranging between 83% and 93%. The highest degree of concordance (93%) was with a TST increment of 10 mm, and the most stringent QFT definition of an increase from <0.35 IU/ml to ≥0.70 IU/ml.
Table 4.
Concordance between TST and QFT conversions among household contacts who had concordant negative results at baseline (n = 80)
| QFT conversion | TST conversion |
|||
|---|---|---|---|---|
| Baseline TST < 10 mm, repeat TST ≥ 10 mm, plus a 6 mm increase over the baseline |
Baseline TST < 10 mm, repeat TST ≥ 10 mm, plus a 10 mm increase over the baseline |
|||
| Concordance % | κ (95%CI) | Concordance % | κ (95%CI) | |
| Baseline IFN-γ < 0.35 IU/ml, repeat IFN-γ ≥0.35 IU/ml | 83 | 0.42 (0.17–0.68) | 85 | 0.39 (0.13–0.65) |
| Baseline IFN-γ < 0.35 IU/ml, repeat IFN-γ ≥ 0.35 IU/ml, plus a 30% increase over the baseline | 83 | 0.42 (0.17–0.68) | 85 | 0.39 (0.13–0.65) |
| Baseline IFN-γ < 0.35 IU/ml, repeat IFN-γ ≥ 0.35, plus an absolute increase of 0.35 IU/ml over the baseline | 83 | 0.31 (0.04–0.59) | 86 | 0.35 (0.07–0.64) |
| Baseline IFN-γ < 0.35 IU/ml, repeat IFN-γ ≥ 0.70 IU/ml | 89 | 0.46 (0.17–0.76) | 93 | 0.53 (0.20–0.86) |
TST = tuberculin skin test; QFT = QuantiFERON-TB Gold In-Tube®; CI = confidence interval; IFN-γ = interferon-gamma; IU = international units.
Incidence of QFT reversions
Of 109 contacts who were QFT-positive at baseline, and underwent repeat QFT testing, seven (6.4%) reverted (Table 5). Among these seven contacts with QFT reversions, the uncertainty zone analysis suggested that ‘true reversions’ occurred in 4/7 (57%). In these four cases, the IFN-γ value changed from definitely positive to definitely negative status. The reversion rate was 3.5% among 85 contacts with a baseline concordant positive (QFT-positive/TST-negative) profile compared to 16.7% among 24 contacts with a baseline discordant (QFT-positive/TST-negative) profile (P = 0.04). Reversion rates were significantly higher among those with baseline IFN-γ levels of between 0.35 and 3.0 IU/ml, as compared to those IFN-γ levels > 3.0 IU/ml (Table 5). Individuals with IFN-γ levels > 3.0 IU/ml were also more likely to have been TST-positive at baseline.
Table 5.
Rate of reversions by baseline IFN-γ value, among household contacts with QFT-positive results at baseline (n = 109)
| Baseline IFN-γ response, IU/ml | Retested n | TST-positive at baseline n (%) | Frequency of QFT reversions | Annual incidence of QFT reversions % | P value for trend in QFT reversion rates* |
|---|---|---|---|---|---|
| 0.35–0.69 | 10 | 5 (50) | 2 | 20.0 | 0.001 |
| 0.70–1.0 | 5 | 2 (40) | 1 | 20.0 | |
| 1.01–3.0 | 23 | 15 (65) | 4 | 17.4 | |
| 3.01–6.0 | 17 | 14 (82) | 0 | 0 | |
| 6.01–10.0 | 54 | 49 (91) | 0 | 0 | |
| Total | 109 | 85 (78) | 7 | 6.4 |
Cochrane-Armitage test for trend: χ2 = 11.66 (df 1); P = 0.001.
IFN-γ = interferon-gamma; QFT = QuantiFERON-TB Gold In-Tube®; IU = international units; TST = tuberculin skin test; df = degrees of freedom.
DISCUSSION
T-cell-based IGRAs have features that make them ideal for serial testing. However, given the limited serial testing data, IGRA conversions and reversions are hard to define and interpret. Our pilot study, although limited by relatively small numbers, provides useful data on QFT performance among exposed contacts in a high-burden setting. Our data suggest that both QFT conversions and reversions occurred among contacts, and conversion rates varied, depending on the test and the definitions used. Both conversions and reversions were frequent when IFN-γ values were close to the cut-off point. Our data confirm the findings of previous studies that suggest that conversions, reversions and non-specific variations occur with IGRA serial testing.8–15
IGRA conversions and their interpretation
Although a fairly high rate of IGRA conversions has been reported in high-endemic settings,8,9,15 there is no consensus on whether the same cut-off should be used for the diagnosis of LTBI as well as to define conversions. If not, will the choice of definitions produce divergent estimates of conversions? Some studies show that if a simple negative to positive definition is used, then conversion rates may be higher with IGRAs than with TST.8,15 In our study, the QFT conversion rate was highest (21.2%) when this least stringent definition was used.
Higher conversion rates with IGRAs could indicate that these assays are more sensitive at identifying new infections. However, at least a proportion of the higher conversion rate may be due to minor variations around the diagnostic cut-off. In our study, the uncertainty zone analysis suggested that only half of all conversions were ‘true conversions’. This finding, however, will need to be confirmed in other studies.
An interesting finding in our study was the variability in QFT conversion rates, depending on the definitions used. Although the rates were not significantly different because of the small number of conversions, nearly two- and three-fold differences were noticed when definitions/tests were changed. This variability may be an issue if IGRAs are to be used in community prevalence and ARTI surveys, which typically involve large sample sizes. Unless there is consensus on the definition for conversion, it will be difficult to interpret community-based epidemiological estimates based on IGRAs. The observed QFT conversion rate in our study may be due to a combination of several factors: household exposure to the index case, exposure to TB cases in the community, and exposure to environmental mycobacteria that secrete early secreted antigenic target 6 (ESAT-6) and culture filtrate protein 10 (CFP-10). Because we used a 12-month follow-up period, it is likely that some of the observed conversions were not associated with the original exposure, but were due to subsequent exposure to TB or environmental mycobacteria.
IGRA reversions and their interpretation
Previous studies have found high reversion rates with IGRAs.8–10,13 Although the overall reversion rate in our study was 6.4%, the rates differed significantly between baseline concordant positive and baseline discordant subgroups. QFT reversions were most likely when the baseline TST was negative, and QFT results were weakly positive (i.e., IFN-γ just above the diagnostic cut-off). Even minor, non-specific variations around the cut-off can thus potentially lead to apparent QFT reversions. This finding has implications for the timing of contact investigations. A recent study from The Gambia showed high rates of ELISpot (in-house) reversions among household contacts.9 The authors therefore recommended that a negative ELISPOT result among exposed contacts should be interpreted with caution.9 Based on these results, a negative IGRA result in an exposed contact does not necessarily rule out a transiently positive IGRA result, especially if the IGRA is done several weeks or months after the exposure. Further research is needed to determine the optimum time for performing IGRAs among exposed contacts. Currently, the recommendation to repeat the TST 8–10 weeks after exposure has ceased has been extrapolated to QFT.19
As reviewed recently,4,37 some reversions may reflect clearing of TB infection. Some reversions may merely be due to biological variations among IGRA positives, and some due to variability in laboratory and test procedures.34 Hill et al. recently suggested that IGRA responses are inherently transient and may require continued exposure to TB antigens to maintain high frequencies.9 They speculated that reversions may simply reflect the life cycle of Mycobacterium tuberculosis, where the mycobacterium enters a dormant state in which it may not reliably secrete antigens such as ESAT-6 and CFP-10, but instead secretes other antigens.
Further research is needed to elucidate the prognosis of IGRA reversions. Friedman and colleagues have suggested that reversions indicate lack of immunity to TB and that persons with IGRA reversions should therefore be re-evaluated when exposed again.13 Cohort studies are ongoing (summarised elsewhere38) and will help to settle these questions.
Study limitations
Our study had several limitations. First, our study was not designed as a typical contact investigation study. In India, contact investigation is not performed routinely, and we therefore did not repeat the TST and QFT at 8–12 weeks. Our data did not permit an analysis of test results based on the timing of last exposure or cessation of exposure, as such data were not routinely collected. Second, due to the small sample size in our pilot study, we were unable to adequately evaluate the association between exposure factors and rates of conversions and reversions. Third, as we did not perform a two-step baseline TST, the first TST may have boosted the follow-up TST results, and potentially affected the second QFT results. Currently, there is conflicting evidence as to whether a previous TST is likely to increase T-cell responses in a subsequent IGRA.39–42 Fourth, the uncertainty zone we proposed and some of the definitions for QFT conversions were chosen arbitrarily; these definitions need validation in larger studies. Fifth, because we did not re-test contacts who were TST-positive, we did not estimate TST reversion rates. Furthermore, lack of data on HIV precluded stratification of conversion/reversion results by HIV status. Last, as our study was conducted in a high-incidence setting, conversion and reversion rates may not be generalisable to contact studies in low-incidence settings.
CONCLUSIONS
In this pilot study, both QFT conversions and reversions occurred among household contacts of TB cases in India. The rate of conversions seemed to vary depending on the test and the definitions used. Further work is needed to confirm this in larger studies. Taken together with other studies, our data suggest that IFN-γ variability must be kept in mind when interpreting the results of repeat testing. Health professionals should be cautious about using a simplistic dichotomous approach to conversions and reversions, and should instead consider the amount of change in absolute IFN-γ responses, as well as relevant clinical information to interpret serial testing results.
Acknowledgments
The authors thank S Chavhan, V Kulkarni, S Taksande and P Raut for contributing to this project. This project was supported in part by grant MOP-81362 from the Canadian Institutes of Health Research (CIHR). M Pai is supported by a New Investigator Award from CIHR. R Joshi is a recipient of a training fellowship from the Fogarty AIDS International Training Programme (grant 1-D43-TW00003-17). D Menzies is a recipient of a career award from the Fonds de la Recherche en Santé du Québec.
References
- 1.Menzies D. Interpretation of repeated tuberculin tests. Boosting, conversion and reversion. Am J Respir Crit Care Med. 1999;159:15–21. doi: 10.1164/ajrccm.159.1.9801120. [DOI] [PubMed] [Google Scholar]
- 2.Menzies D, Pai M, Comstock G. Meta-analysis: new tests for the diagnosis of latent tuberculosis infection: areas of uncertainty and recommendations for research. Ann Intern Med. 2007;146:340–354. doi: 10.7326/0003-4819-146-5-200703060-00006. [DOI] [PubMed] [Google Scholar]
- 3.Pai M, Zwerling A, Menzies D. Systematic review: T-cell-based assays for the diagnosis of latent tuberculosis infection: an update. Ann Intern Med. 2008;149:177–184. doi: 10.7326/0003-4819-149-3-200808050-00241. [DOI] [PMC free article] [PubMed] [Google Scholar]
- 4.Pai M, O’Brien R. Serial testing for tuberculosis: can we make sense of T-cell assay conversions and reversions? PLoS Med. 2007;4:e208. doi: 10.1371/journal.pmed.0040208. [DOI] [PMC free article] [PubMed] [Google Scholar]
- 5.Pai M, Dheda K, Cunningham J, Scano F, O’Brien R. T-cell assays for the diagnosis of latent tuberculosis infection: moving the research agenda forward. Lancet Infect Dis. 2007;7:428–438. doi: 10.1016/S1473-3099(07)70086-5. [DOI] [PubMed] [Google Scholar]
- 6.Pai M, Dendukuri N, Wang L, Joshi R, Kalantri S, Rieder HL. Improving the estimation of tuberculosis infection prevalence using T-cell-based assay and mixture models. Int J Tuberc Lung Dis. 2008;12:895–902. [PMC free article] [PubMed] [Google Scholar]
- 7.Mazurek GH, Jereb J, Lobue P, Iademarco MF, Metchock B, Vernon A. Guidelines for using the QuantiFERON-TB Gold test for detecting Mycobacterium tuberculosis infection, United States. MMWR. 2005;54 (RR-15):49–55. [PubMed] [Google Scholar]
- 8.Pai M, Joshi R, Dogra S, Mendiratta DK, et al. Serial testing of health care workers for tuberculosis using interferon-gamma assay. Am J Respir Crit Care Med. 2006;174:349–355. doi: 10.1164/rccm.200604-472OC. [DOI] [PMC free article] [PubMed] [Google Scholar]
- 9.Hill PC, Brookes RH, Fox A, et al. Longitudinal assessment of an ELISPOT test for Mycobacterium tuberculosis infection. PLoS Med. 2007;4:e192. doi: 10.1371/journal.pmed.0040192. [DOI] [PMC free article] [PubMed] [Google Scholar]
- 10.Ewer K, Millington KA, Deeks JJ, Alvarez L, Bryant G, Lalvani A. Dynamic antigen-specific T-cell responses after point-source exposure to Mycobacterium tuberculosis. Am J Respir Crit Care Med. 2006;174:831–839. doi: 10.1164/rccm.200511-1783OC. [DOI] [PubMed] [Google Scholar]
- 11.Franken WP, Koster BF, Bossink AW, et al. Follow-up study of tuberculosis-exposed supermarket customers with negative tuberculin skin test results in association with positive gamma interferon release assay results. Clin Vaccine Immunol. 2007;14:1239–1241. doi: 10.1128/CVI.00185-07. [DOI] [PMC free article] [PubMed] [Google Scholar]
- 12.Lee SS, Liu Y-C, Huang T-S, et al. Comparison of the interferon-γ release assay and the tuberculin skin test for contact investigation of tuberculosis in BCG-vaccinated health care workers. Scand J Infect Dis. 2007:373–380. doi: 10.1080/00365540701730743. [DOI] [PubMed] [Google Scholar]
- 13.Friedman LN, Nash ER, Bryant J, et al. High rate of negative results of tuberculin and QuantiFERON tests among individuals with a history of positive skin test results. Infect Control Hosp Epidemiol. 2006;27:436–441. doi: 10.1086/503690. [DOI] [PubMed] [Google Scholar]
- 14.Hill PC, Jeffries DJ, Brookes RH, et al. Using ELISPOT to expose false-positive skin test conversion in tuberculosis contacts. PLoS ONE. 2007;2:e183. doi: 10.1371/journal.pone.0000183. [DOI] [PMC free article] [PubMed] [Google Scholar]
- 15.Corbett EL, Kathryn C, Millington KA, et al. Tuberculosis infection in African nursing students: tuberculin skin test compared to ELISPOT conversion rates. Int J Tuber Lung Dis. 2006;10 (Suppl 1):S231. [Google Scholar]
- 16.Canadian Tuberculosis Committee. Updated recommendations on interferon gamma release assays for latent tuberculosis infection. An Advisory Committee Statement (ACS) Can Commun Dis Rep. 2008;34 (ACS-6):1–13. [PubMed] [Google Scholar]
- 17.National Tuberculosis Advisory Committe. Position statement on interferon-gamma release immunoassays in the detection of latent tuberculosis infection, October 2007. Commun Dis Intell. 2007;31:404–405. [PubMed] [Google Scholar]
- 18.Centers for Disease Control and Prevention. Guidelines for preventing the transmission of Mycobacterium tuberculosis in health care settings, 2005. MMWR. 2005;54 (RR-17):1–141. [PubMed] [Google Scholar]
- 19.Centers for Disease Control and Prevention. Guidelines for the investigation of contacts of persons with infectious tuberculosis. Recommendations from the National Tuberculosis Controllers Association and CDC. MMWR. 2005;54 (RR-15):1–47. [PubMed] [Google Scholar]
- 20.Diel R, Forssbohm M, Loytved G, et al. Recommendations for background studies in tuberculosis. Pneumologie. 2007;61:440–455. doi: 10.1055/s-2007-959219. [French] [DOI] [PubMed] [Google Scholar]
- 21.Morrison J, Pai M, Hopewell PC. Tuberculosis and latent tuberculosis infection in close contacts of people with pulmonary tuberculosis in low-income and middle-income countries: a systematic review and meta-analysis. Lancet Infect Dis. 2008;8:359–368. doi: 10.1016/S1473-3099(08)70071-9. [DOI] [PubMed] [Google Scholar]
- 22.Ewer K, Deeks J, Alvarez L, et al. Comparison of T-cell-based assay with tuberculin skin test for diagnosis of Mycobacterium tuberculosis infection in a school tuberculosis outbreak. Lancet. 2003;361:1168–1173. doi: 10.1016/S0140-6736(03)12950-9. [DOI] [PubMed] [Google Scholar]
- 23.Shams H, Weis SE, Klucar P, et al. Enzyme-linked immunospot and tuberculin skin testing to detect latent tuberculosis infection. Am J Respir Crit Care Med. 2005;172:1161–1168. doi: 10.1164/rccm.200505-748OC. [DOI] [PMC free article] [PubMed] [Google Scholar]
- 24.Arend SM, Thijsen SF, Leyten EM, et al. Comparison of two interferon-gamma assays and tuberculin skin test for tracing tuberculosis contacts. Am J Respir Crit Care Med. 2007;175:618–627. doi: 10.1164/rccm.200608-1099OC. [DOI] [PubMed] [Google Scholar]
- 25.Brock I, Weldingh K, Lillebaek T, Follmann F, Andersen P. Comparison of tuberculin skin test and new specific blood test in tuberculosis contacts. Am J Respir Crit Care Med. 2004;170:65–69. doi: 10.1164/rccm.200402-232OC. [DOI] [PubMed] [Google Scholar]
- 26.Diel R, Nienhaus A, Lange C, Meywald-Walter K, Forssbohm M, Schaberg T. Tuberculosis contact investigation with a new, specific blood test in a low-incidence population containing a high proportion of BCG-vaccinated persons. Respir Res. 2006;7:77. doi: 10.1186/1465-9921-7-77. [DOI] [PMC free article] [PubMed] [Google Scholar]
- 27.Zellweger JP, Zellweger A, Ansermet S, de Senarclens B, Wrighton-Smith P. Contact tracing using a new T-cell-based test: better correlation with tuberculosis exposure than the tuberculin skin test. Int J Tuberc Lung Dis. 2005;9:1242–1247. [PubMed] [Google Scholar]
- 28.Richeldi L, Ewer K, Losi M, et al. T-cell-based tracking of multidrug-resistant tuberculosis infection after brief exposure. Am J Respir Crit Care Med. 2004;170:288–295. doi: 10.1164/rccm.200403-307OC. [DOI] [PubMed] [Google Scholar]
- 29.Jackson-Sillah D, Hill PC, Fox A, et al. Screening for tuberculosis among 2381 household contacts of sputum-smear-positive cases in The Gambia. Trans R Soc Trop Med Hyg. 2007;101:594–601. doi: 10.1016/j.trstmh.2007.02.001. [DOI] [PubMed] [Google Scholar]
- 30.Hill PC, Brookes RH, Adetifa IM, et al. Comparison of enzyme-linked immunospot assay and tuberculin skin test in healthy children exposed to Mycobacterium tuberculosis. Pediatrics. 2006;117:1542–1548. doi: 10.1542/peds.2005-2095. [DOI] [PubMed] [Google Scholar]
- 31.Hill PC, Brookes RH, Fox A, et al. Large-scale evaluation of enzyme-linked immunospot assay and skin test for diagnosis of Mycobacterium tuberculosis infection against a gradient of exposure in The Gambia. Clin Infect Dis. 2004;38:966–973. doi: 10.1086/382362. [DOI] [PubMed] [Google Scholar]
- 32.Pai M, Gokhale K, Joshi R, et al. Mycobacterium tuberculosis infection in health care workers in rural India: comparison of a whole-blood, interferon-γ assay with tuberculin skin testing. JAMA. 2005;293:2746–2755. doi: 10.1001/jama.293.22.2746. [DOI] [PubMed] [Google Scholar]
- 33.Chadha VK, Jagannatha PS, Vaidyanathan PS, Jagota P. PPD RT23 for tuberculin surveys in India. Int J Tuberc Lung Dis. 2003;7:172–179. [PubMed] [Google Scholar]
- 34.Veerapathran A, Joshi R, Goswami K, et al. T-cell assays for tuberculosis infection: deriving cut-offs for conversions using reproducibility data. PLoS ONE. 2008;3:e1850. doi: 10.1371/journal.pone.0001850. [DOI] [PMC free article] [PubMed] [Google Scholar]
- 35.American Thoracic Society. Targeted tuberculin testing and treatment of latent tuberculosis infection. Am J Respir Crit Care Med. 2000;161 (Suppl):S221–S247. doi: 10.1164/ajrccm.161.supplement_3.ats600. [DOI] [PubMed] [Google Scholar]
- 36.Harada N, Higuchi K, Sekiya Y, Rothel J, Kitoh T, Mori T. Basic characteristics of a novel diagnostic method (Quanti- FERON TB-2G) for latent tuberculosis infection with the use of Mycobacterium tuberculosis-specific antigens, ESAT-6 and CFP-10. Kekkaku. 2004;79:725–735. [Japanese] [PubMed] [Google Scholar]
- 37.Nardell EA, Wallis RS. Here today—gone tomorrow: the case for transient acute tuberculosis infection. Am J Respir Crit Care Med. 2006;174:734–735. doi: 10.1164/rccm.200607-923ED. [DOI] [PubMed] [Google Scholar]
- 38.Andersen P, Doherty TM, Pai M, Weldingh K. The prognosis of latent tuberculosis: can disease be predicted? Trends Mol Med. 2007;13:175–182. doi: 10.1016/j.molmed.2007.03.004. [DOI] [PubMed] [Google Scholar]
- 39.Richeldi L, Ewer K, Losi M, Roversi P, Fabbri LM, Lalvani A. Repeated tuberculin testing does not induce false-positive ELISPOT results. Thorax. 2006;61:180. doi: 10.1136/thx.2005.049759. [DOI] [PMC free article] [PubMed] [Google Scholar]
- 40.Naseer A, Naqvi S, Kampmann B. Evidence for boosting Mycobacterium tuberculosis-specific IFN-gamma responses at 6 weeks following tuberculin skin testing. Eur Respir J. 2007;29:1282–1283. doi: 10.1183/09031936.00017807. [DOI] [PubMed] [Google Scholar]
- 41.Igari H, Watanabe A, Sato T. Booster phenomenon of Quanti-FERON-TB Gold after prior intradermal PPD injection. Int J Tuberc Lung Dis. 2007;11:788–791. [PubMed] [Google Scholar]
- 42.Leyten EM, Prins C, Bossink AW, et al. Effect of tuberculin skin testing on a Mycobacterium tuberculosis-specific interferongamma assay. Eur Respir J. 2007;29:1212–1216. doi: 10.1183/09031936.00117506. [DOI] [PubMed] [Google Scholar]