Abstract
We have previously reported small-molecule inhibitors of Gli1-mediated transcription, an essential down-stream element of the Hh pathway. We created new derivatives of the previous compounds aiming to improve the druggable property. The new compounds, amide conjugates of ketoprofen and indole, showed inhibitory activity and membrane permeability, while also improving the microsome stability. Among them, 33 and 42 inhibited Gli-luciferase reporter in C3H10T1/2 cells that were exogenously transfected with Gli1 with 2.6 µM and 1.6 µM of IC50 respectively, and in Rh30 cells that endogenously overexpress Gli1, and was selective to Gli1 over Gli2.
1. Introduction
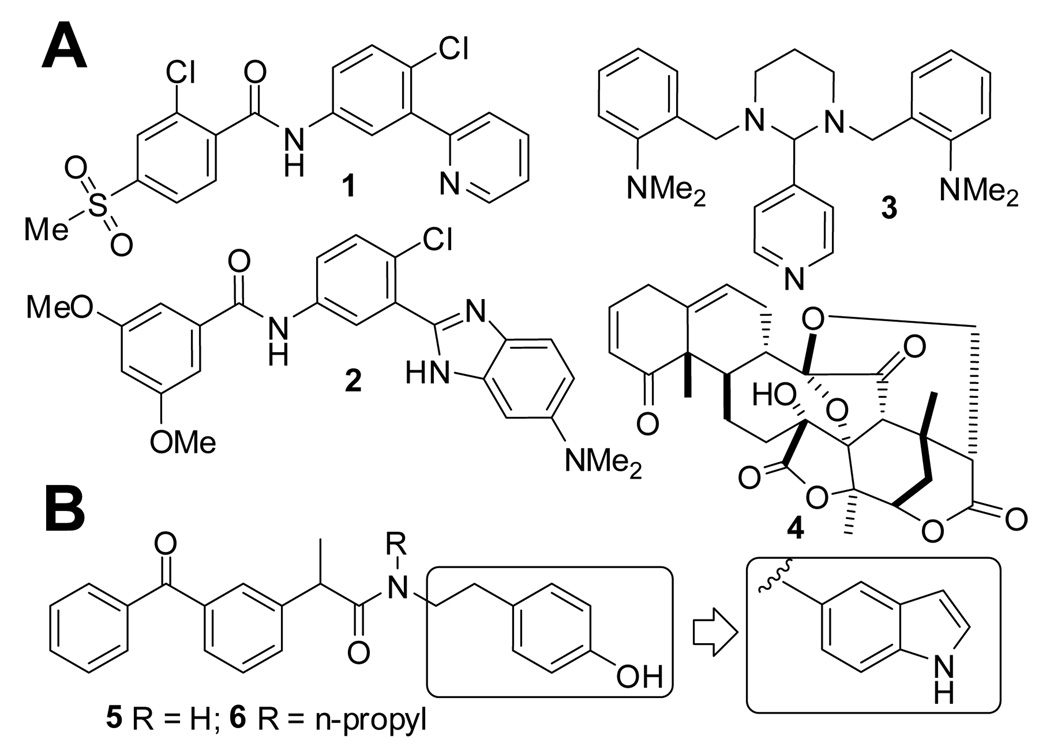
Inappropriate activation of the Hedgehog (Hh) signaling can result in cancer.1 Inhibitors of Smoothened (Smo), a transmembrane protein that promotes this pathway, have shown anticancer activity and in a recent clinical trial have proven to be effective.2 However, this Smo inhibitor, GDC0449 (1), rapidly acquired resistance by mutation of Smo.3 Another Smo inhibitor, HhAntag (2) was shown to eliminate medulloblastoma from a mouse model in which Ptch1 (a suppressor of the Hh signaling upstream of the Smo) is inactivated,4 but not to be effective in another mouse model in which SuFu (a suppressor of the Hh signaling downstream of the Smo) is inactivated.5 Furthermore, HhAntag caused permanent defects in bone development in young mice.6 This is believed to be a mechanism-based toxicity because Smo inhibitors mechanistically also inhibit Indian Hh-Gli2 signaling, an essential pathway for bone development,7 which could be affected also by non-selective Gli inhibitors such as GANT618 (3) and Physalin9 (4). This observation represented a very serious concern in their use for pediatric cancers. To overcome this problem, previously we have designed ketoprofen amide derivatives including 5 and 6 that inhibit transcription by Gli1,10 an oncogenic downstream transcription factor of the Hh pathway.11, 12 These compounds later were proven to be unstable in liver microsomes and this instability might be due to their phenol moiety (observation presented in this paper). There have been several efforts to improve metabolic stability and bioavailability of lead compounds possessing a phenol moiety, by replacing it with an indole13 or other NH-containing heterocyclic rings14. These studies motivated us to adopt a similar approach to improve druggability of our lead compounds. Here we report new compounds in which an indole is substituted in place of the phenol moiety of 5 and 6 (Figure 1B).
Figure 1.
Panel A: GDC0449 (1) and HhAntag (2) are inhibitors of Smo, and GANT61 (3) and Physalin (4) are inhibitors of Gli-mediated transcription. Panel B: Inhibitors of Gli1-mediated transcription (5 and 6) and lead optimization in this study.
2. Chemistry
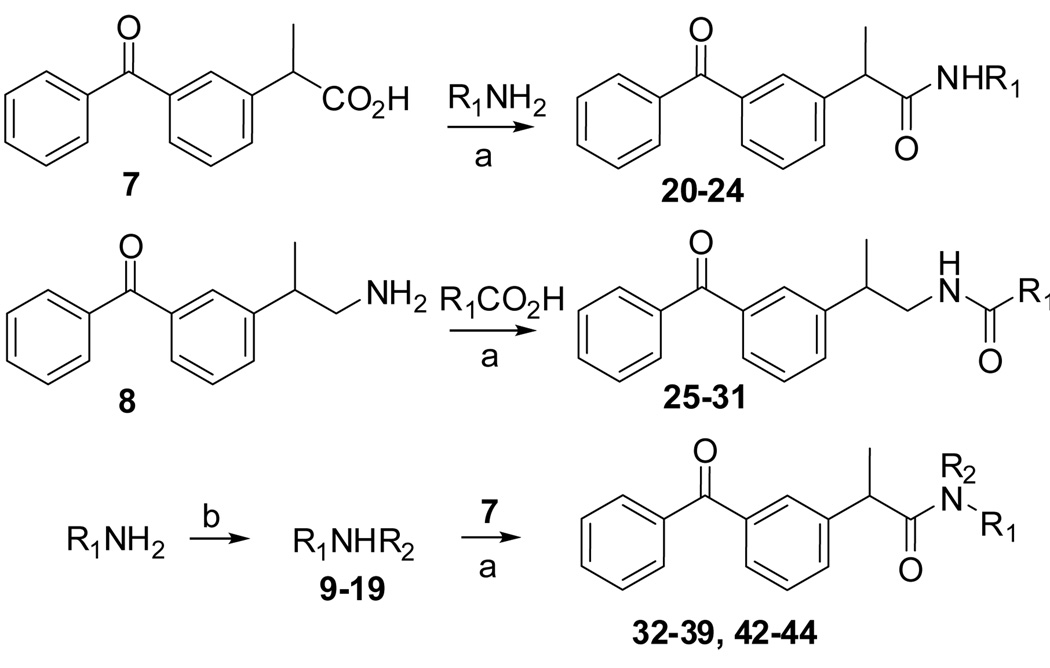
Compounds were prepared as outlined below (Scheme 1). Ketoprofen 7 was coupled with several indole primary amines to afford amides 20–24. An amine 8 was coupled with several indole carboxylic acids to afford reverse amides 25–31. Also, the indole amines were alkylated with several alkyl halides to afford secondary amines 9–19, which were coupled with 7 to afford N-alkyl amides 32–39 and 42–44. Preparation of compounds 40 and 41 were described in Experimental.
Scheme 1.
(a) HBTU (for 20–31) or HATU (for 32–39 and 42–44), N,N-diisopropylethylamine, DMF, room temperature; (b) R2Br, DMF, microwave, 5 min, 150 °C. Compound 8 was previously prepared from ketoprofen 7.10
3. Results and discussion
Compounds were tested in a reporter assay using C3H10T1/2 mouse embryo fibroblasts exogenously transfected with vectors encoding human full-length Gli1 and Gli-responsive luciferase (Gli-Luc) reporter. Endogenous Gli1 expression in C3H10T1/2 cells is undetectable and Gli-Luc activity in these cells is negligible without the exogenous Gli1, thus inhibitors of Gli-Luc activity in this assay are believed to be inhibitors of the Gli1-mediated transcription but not of upstream mediators of the Hh pathway, e.g., Smo. Consistently, HhAntag15, a Smo inhibitor with nanomolar level of IC50, is almost inactive in this assay at a concentration up to 40 µM; while GANT61 (3), a known non-selective inhibitor of Gli-mediated transcription8, showed activity with an IC50 of ~20 µM (Figure S1).
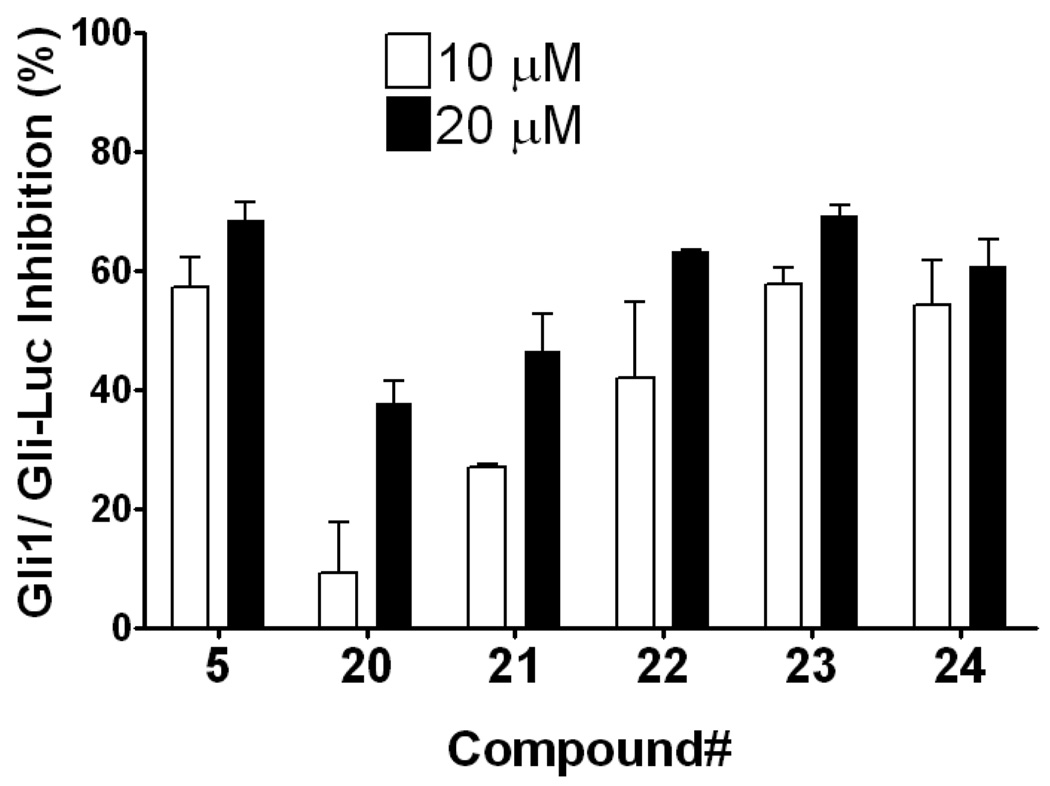
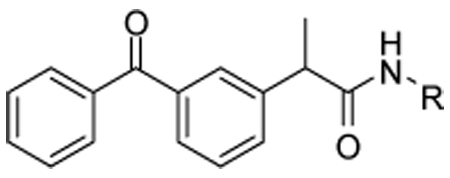
Compound 20, an indole variant of 5 having two methylenes between the amide group and the phenol, showed much weaker activity than 5. Compounds 21 and 22 with only one or no methylene spacer showed higher activity than 20. We investigated the preferable position of the indole substitution and found that the 6-position is best among the tested analogs (compound 23) (Table 1 and Figure 2).
Table 1.
Compounds that were designed by replacing the phenol moiety of 5 with different indoles.
 | |||
|---|---|---|---|
| R | R | ||
| 5 |  |
22 |  |
| 20 |  |
23 |  |
| 21 |  |
24 |  |
Figure 2.
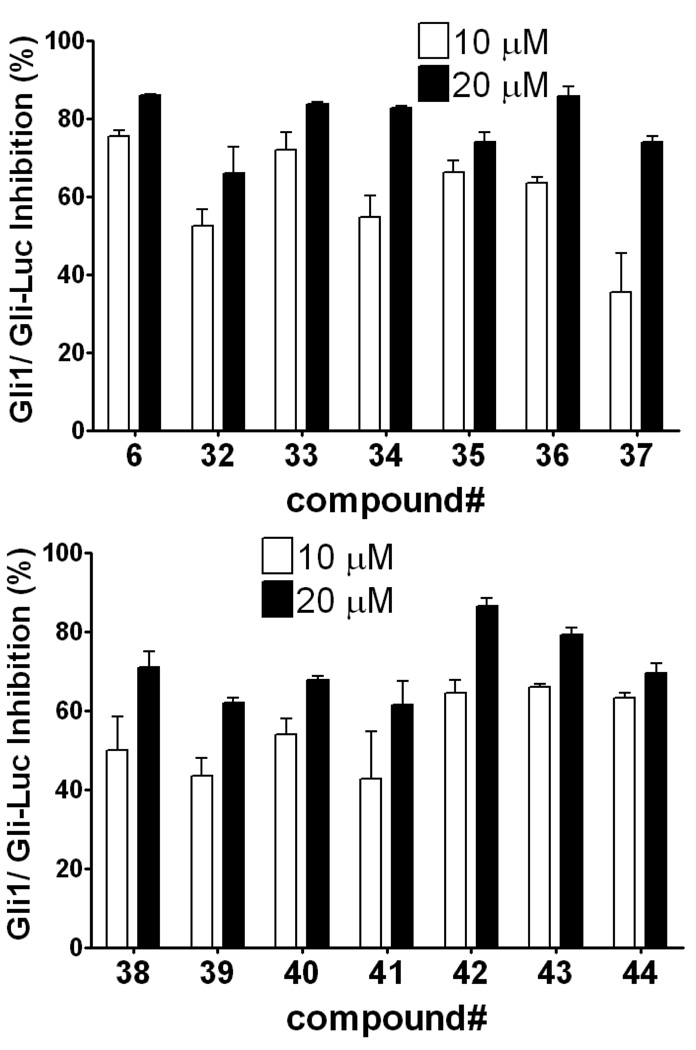
Replacement of the phenol in 5 with an indole moiety afforded equipotent inhibition of Gli1-mediated transcription. Percent inhibition of Gli-responsive firefly luciferase reporter activity in Gli1-transfected C3H10T1/2 cells 24 h after addition of 10 µM (open bar) or 20 µM (closed bar) of the test compound. Each Gli-Luc firefly luciferase signal is normalized with a Renilla luciferase transfection control and the normalized Gli-Luc activity with DMSO treatment serves as 0% inhibition. Error bars represent standard error of triplicate data.
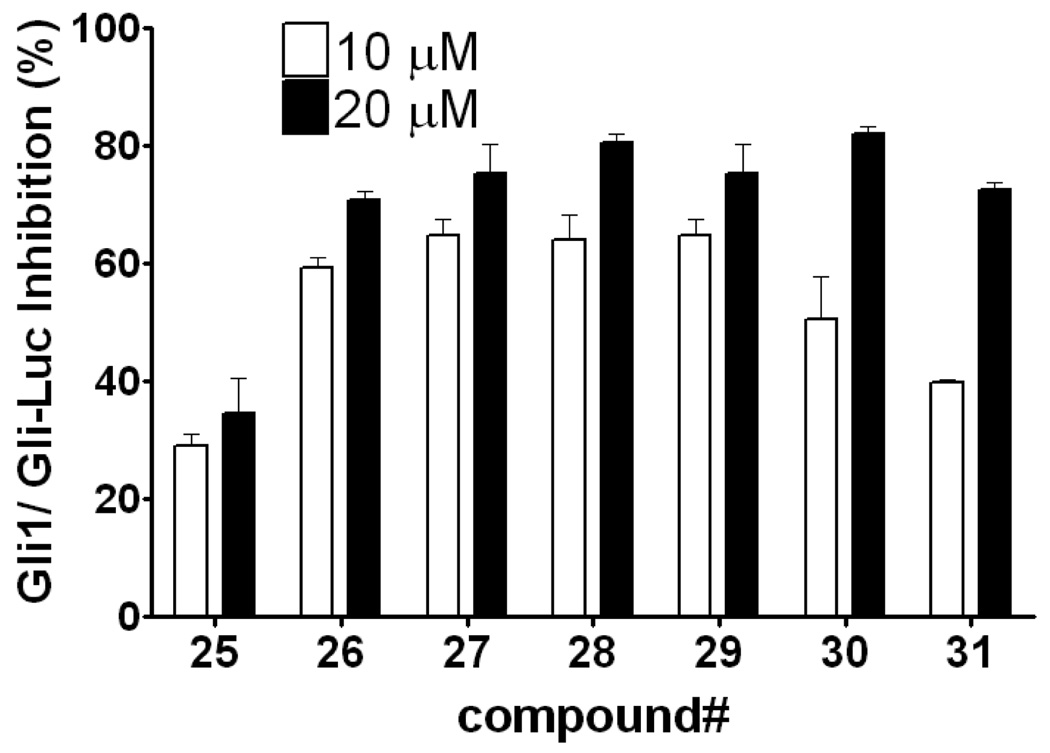
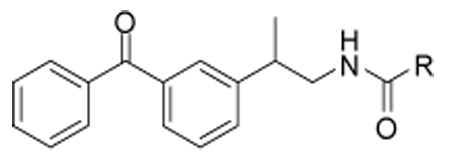
Next, we investigated the effect of reversal of the amide group. Compound 25 has a linker length the same as 5 and showed only weak activity, as observed in compound 20. In contrast, removal of the methylene spacer between the amide and 5- or 6-position of the indole in compounds 26 and 27 afforded equipotent activity to those of 23 and 24. Moving the substitution to the 2- or 3-position on the indole also gave equipotent inhibitors 28 and 29, though moving to the 4- or 7-position in compound 30 and 31 decreased the potency (Table 2 and Figure 3).
Table 2.
Compounds designed by reversing the amide group substitution of compounds.
 | |||
|---|---|---|---|
| R | R | ||
| 25 |  |
29 |  |
| 26 |  |
30 |  |
| 27 |  |
31 |  |
| 28 |  |
||
Figure 3.
The effect of position of the indole substitution of reverse amides. Data is measured and presented as in Figure 1.
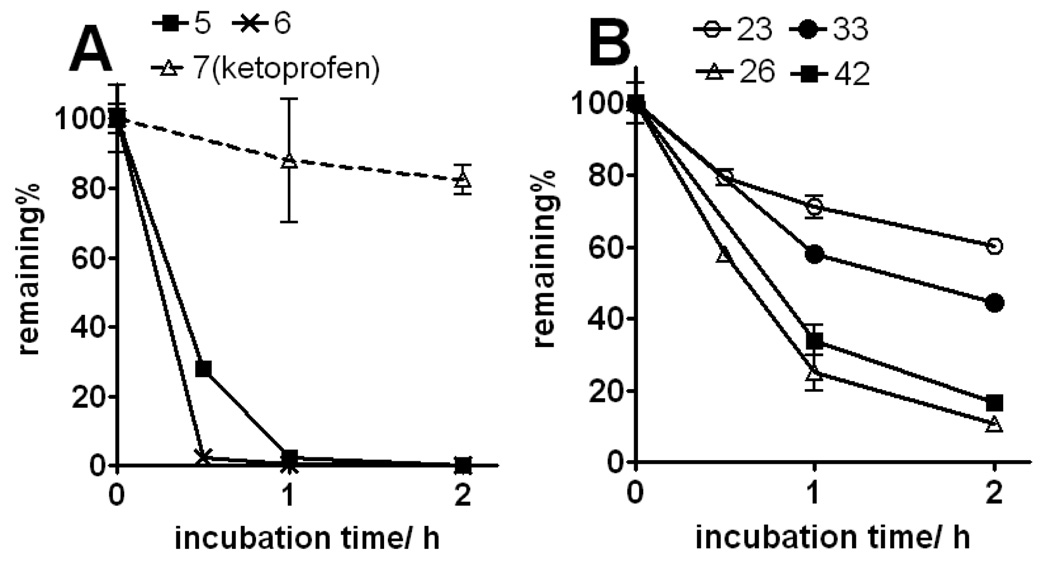
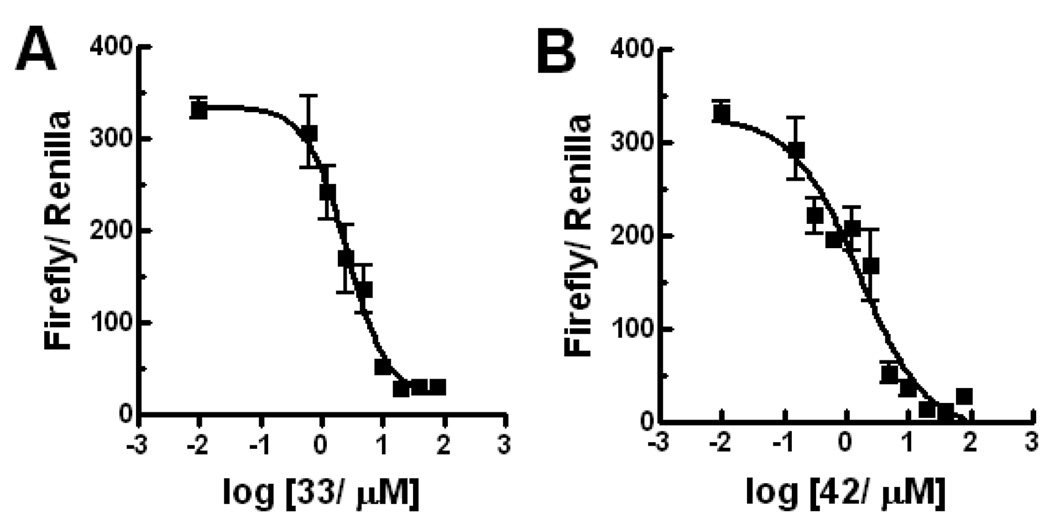
Next, we explored the effect of an alkyl group substitution on the amide moiety. We had previously observed that substitution of the amide nitrogen of 5 with an n-propyl group (compound 6) improved potency.10 To attain optimal substitution on its amide nitrogen, we had chosen 23 but not 26, because of better stability over liver microsome (Figure 9B). Little improvement was shown by a methyl group (compound 32) while substitution of an n-propyl group improved the potency (compound 33). A similar effect was observed with several other alkyl groups that are larger than n-propyl, but no further potency improvement was observed (compounds 34–36). Meanwhile, increasing hydrophilicity of the alkyl group decreased the potency (compounds 37–39). The positional effect of the n-propyl and indole was also investigated. Introduction of an n-propyl group on the benzyl carbon of the ketoprofen moiety (compound 40) or indole-1-position (compound 41) did not increase potency. Compounds 42 and 43, in which the indole is substituted on the 5- or 4-position, are equipotent to 33. Compound 44, a variant of 42 in which the indole substitution is homologated with one methylene, showed weaker potency than 42, as observed in 20 and 25. (Table 3 and Figure 4) In separate dose-response titrations, IC50 of 33 and 42 were estimated as 2.6 µM and 1.6 µM, respectively (Figure 5).
Figure 9.
Stability of compounds (1 µM) in CD-1 female mouse liver microsomes at 37°C. Panel A: phenol compounds and parent scaffold ketoprofen (7). Panel B: indole compounds. Half-lives are estimated as 2.8 h (23), 0.6 h (26), 1.8 h (33), and 0.8 h (42).
Table 3.
Compounds designed by incorporating an alkyl on the amide nitrogen or other positions.
 | |||
|---|---|---|---|
| R | R | ||
| 32 |  |
39 | 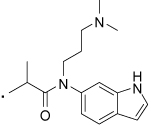 |
| 33 | 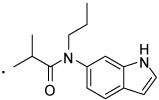 |
40 |  |
| 34 |  |
41 |  |
| 35 | 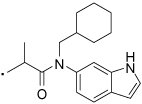 |
42 | 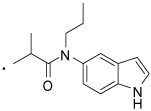 |
| 36 | 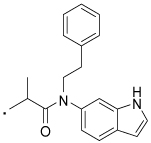 |
43 | 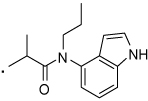 |
| 37 | 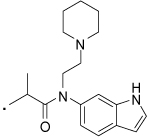 |
44 | 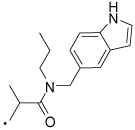 |
| 38 | 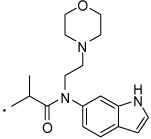 |
||
Figure 4.
(Two panels) Alkyl substitution on the amide nitrogen increases the potency. Data is measured and presented as in Figure 1.
Figure 5.
Dose response of Gli-Luc signal in Gli1-transfected C3H10T1/2 cells treated with 33 (panel A) or 42 (panel B). Data was plotted and curve fitted by Prism 4.03 (GraphPad Software). IC50 was estimated as 2.6 µM (1.77 to 3.75 µM for 95% confidence intervals) for 33 with curve fitting: R2= 0.93, and 1.6 µM (0.82 to 3.05 µM for 95% confidence intervals) for 42 with curve fitting: R2= 0.90. Error bars represent standard error of triplicate data.
Overall, clear SAR trend is observed. The effect of linker length is similar among two scaffolds; both amides 20, 21 and reversed amide 25 having a longer linker showed much lower activity than the corresponding shorter variants (22 and 26, respectively). Incorporating an n-propyl group on the amide nitrogen increased potency in both of the phenol derivatives (5 vs 6) and the indole derivatives (23 vs 33). Effect of the n-propyl is observed as a clear SAR; moving it to the adjacent methylene (40) or indole nitrogen (41) reduced the activity. These observations may suggest presence of a specific target that those compounds could bind to suppress the Gli1-mediated transcription.
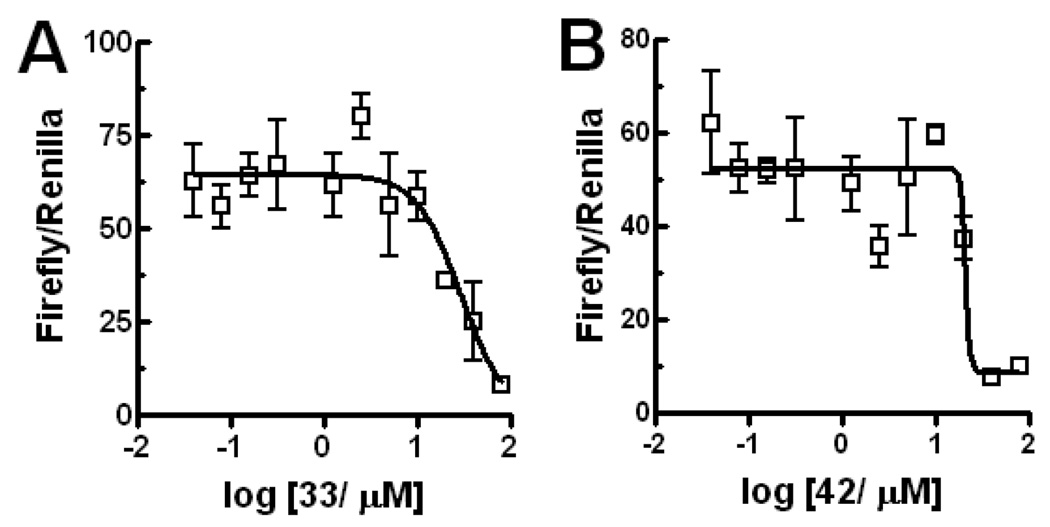
Selected indole compounds were assayed for inhibition of Gli2-mediated transcription by using a vector encoding Gli2. In this assay, IC50 of 33 and 42 were estimated as 29 µM and 21 µM, respectively (Figure 6); showing approximately ten-fold Gli1-selectivity. To further ensure that these lead compounds are not nonspecific inhibitors of transcription, lead compounds were tested also in an unrelated transcription reporter, AP-1, in the C3H10T1/2 cells with the same conditions for the Gli1/Gli-Luc assay. They showed no inhibition (Figure S3). Histone deacetylase (HDAC) strongly promotes transcriptional activation by both of Gli1 and Gli2.16 However, compounds 5, 6, 33, and 42 do not inhibit HDAC up to 40 µM (data not shown), suggesting that the Gli1-inhibition by these compounds is not due to HDAC inhibition.
Figure 6.
Compounds show smaller inhibitory activity for Gli2-mediated transcription than for Gli1-mediated transcription. IC50 was estimated as 29 µM for 33 and 21 µM 42 by Prism 4.03 (GraphPad Software). Error bars represent standard error of triplicate data.
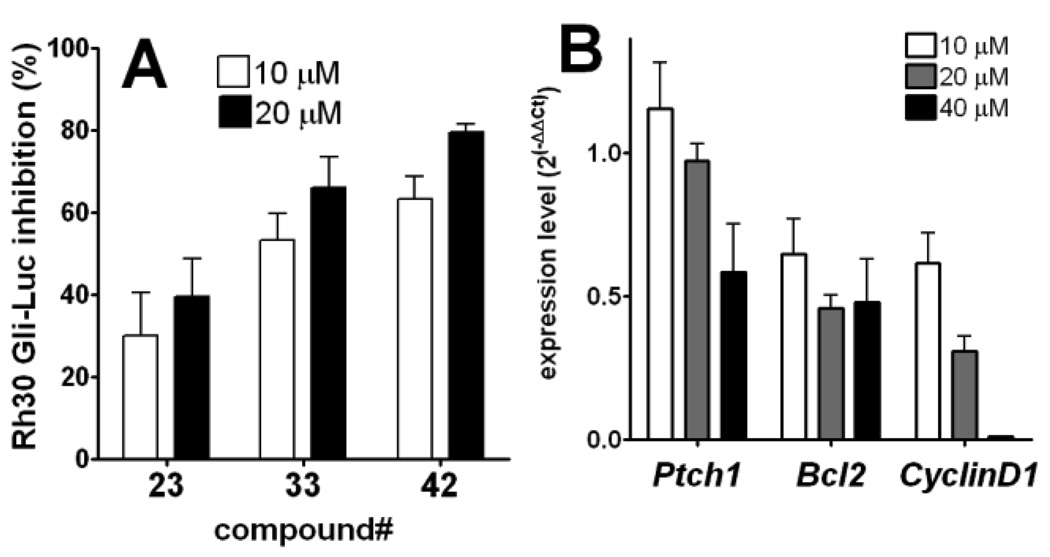
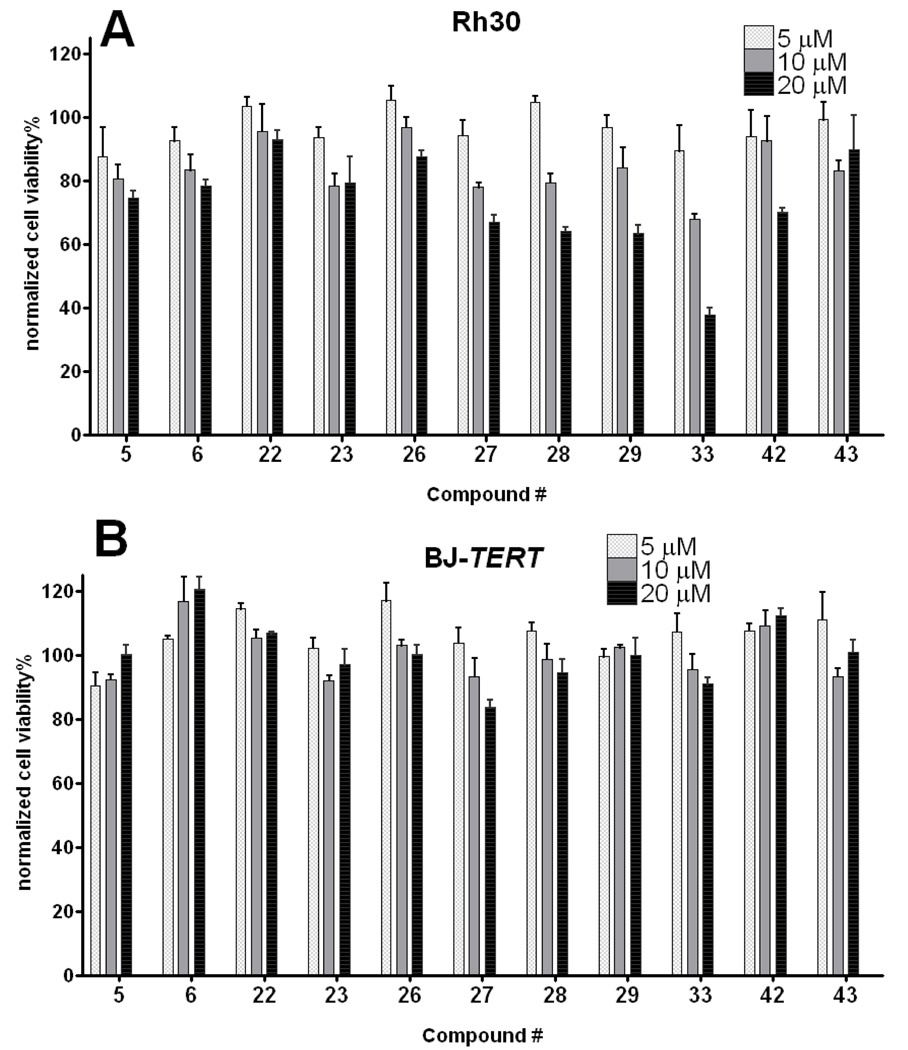
To exclude the possibility that these compounds are inhibitors of the specific promoter for the exogenous Gli1 transgene expression, and also to corroborate that lead compounds selected by assaying against artificially overexpressed Gli1 can inhibit endogenously overexpressed Gli1 in cancers, they were evaluated by inhibition of the Gli-Luc activity in Rh30, a rhabdomyosarcoma cell line that highly overexpresses Gli1 gene.17 HhAntag showed almost no Gli-Luc inhibition in these cells at a concentration as high as 40 µM, meanwhile GANT61 showed activity with an IC50 of ~40 µM (Figure S2). Compounds 23, 33, and 42 showed inhibition with similar or slightly weaker potency to those in the Gli1-transfected C3H10T1/2 cells (Figure 7A). The inhibitory effect in the Rh30 cells of 33 was observed also in regulating the messenger transcripts of some Gli1-target genes18, which were quantified by RT-PCR (Figure 7B). This chemical scaffold could suppress growth of Rh30 but is generally nontoxic to a human normal fibroblast cell line BJ (Figure 8).
Figure 7.
Panel A: lead compounds inhibit transcription by endogenous Gli in Rh30 cells. Percent inhibition of Gli-reporter activity in Rh30 cells (without Gli1 transfection) 24 h after addition of 10 µM (open bar) or 20 µM (closed bar) of the test compound. Each firefly luciferase signal is normalized with Renilla luciferase transfection control, and then normalized by firefly luciferase activity with DMSO treatment serving as 0% inhibition. Error bars represent standard error of triplicate data. Panel B: compound 33 inhibits expression of Gli1-target genes18 in Rh30 cells. Expression levels of each indicated Gli1-mediated transcription products in Rh30 cells were measured by real-time RT-PCR 24 h after addition of 33. Error bars represent standard error of duplicate data. Average ΔCt (Ct(target gene)-Ct(GAPDH)) were subtracted with that of DMSO treatment to calculate ΔΔCt. Ct, cycle time.
Figure 8.
Effect of lead compounds in growth of Rh30 (panel A) and normal human fibroblast cell line BJ-TERT19 (panel B). Cells were incubated with indicated compound for 72 h, and the viability was measured by Alamarblue assay. Data are normalized with signals of DMSO treatment (=100%) and no cells (=0%). Error bars represent standard error of triplicate data.
Finally, stability of the lead compounds in mouse liver microsomes was evaluated. The phenol-based compounds (5 and 6) were completely consumed within less than 1 h whereas ketoprofen (7) was very stable; suggesting that the phenol moiety is responsible for the instability (Figure 9A). In contrast, the indole-based compounds, especially 6-indole derivatives (23 and 33), were much more stable than 5 and 6 (Figure 9B). Cell membrane permeability of the lead compounds was evaluated in a PAMPA assay. The phenol-based amide 5 and indole-based amides 23 and 33 are permeated to a comparable extent, suggesting that the higher potency of 33 than 23 is not simply due to higher permeability. Meanwhile, the indole-based reverse amide 26 was less permeable (Table 4). This trend was also confirmed in a Caco-2 cell assay, in which all of the tested compounds had much lower efflux ratios, i.e., lower excretion than digoxin (Table 5).
Table 4.
PAMPA permeability of selected compounds at pH7.4. Ranitidine and carbamazepine served as controls.
| compound | average P(nm/s) | average permeability % |
|---|---|---|
| 5 | 602 | 92 |
| 23 | 778 | 75 |
| 26 | 521 | 47 |
| 33 | 714 | 80 |
| ranitidine | 55 | 2 |
| carbamazepine | 199 | 33 |
Table 5.
Caco2 cell permeability of selected compounds at pH7.4. Digoxin served as a control.
| compound | average Papp A→B (nm/s) |
average Papp B→A (nm/s) |
efflux ratio (B→A)/ (A→B) |
|---|---|---|---|
| 5 | 130 | 58 | 0.45 |
| 23 | 122 | 39 | 0.31 |
| 26 | 58 | 27 | 0.46 |
| digoxin | 80 | 92 | 1.15 |
4. Conclusion
To date, several compounds targeting Gli-transcription were found in a high-throughput screen,8, 20 but their druggable properties such as metabolic stability, cell permeability and non-specific toxicity were not addressed. Compounds from natural product (such as Physalin9 4) have another limitation; they cannot be easily reproduced or synthesized to yield the additional large amounts of materials needed for validating in the other assays, animal testing, and clinical trials. In contrast, compounds such as 33 are very easily prepared in large scale from ketoprofen, a clinically used drug. C3H10T1/2 cells express endogenous Gli2 and are differentiated into osteoblasts by Indian Hh; and this differentiation is inhibited by cyclopamine.21 In our hands, inhibitory effect of compounds 23, 33 and 42 in inducing Hh signal-mediated alkaline phosphatase, an osteoblastic differentiation marker, was much smaller than that of HhAntag in C3H10T1/2 cells (Figure S4). This suggests that selective inhibitors of the Gli1-mediated transcription could less affect mouse bone development than HhAntag did.6 Studies are ongoing to create additional leads with improved potency and Gli1/Gli2-selectivity, which will be tested in animal models of pediatric cancers for antitumor efficacy and bone growth safety.
5. Experimental Section
Materials
HhAntag was prepared by the method reported in the literature.15 GANT61 was purchased from Enzo Life Sciences (Plymouth Meeting, PA). Other chemicals and solvents were purchased from Sigma-Aldrich (St. Louis, MO) and used as received.
General Procedure for preparation of amines 9–19
The mixture of appropriate 1H-indolamine (1.0 eq) and haloalkane (0.5 eq) in DMF (0.5 mL) was exposed to microwave irradiations for 5 min at 150 °C. When the haloalkane is used as hydrochloride (14–16), triethylamine (2.5 eq) was included in the mixture prior to the irradiation. The reaction mixture was cooled to room temperature, quenched with water (10 mL) and extracted with ethyl acetate (2 × 10 mL). The organic layer was successively washed with water (2 × 10 mL) and brine (1 × 10 mL) and dried over anhydrous sodium sulfate. The solvent was removed in vacuo and the residue was chromatographed over silica gel (Biotage SP4, 12+S Column, eluting with dichloromethane: methanol gradient 0% to 10 %) to give N-alkyl-1H-indolamine in 50–55% yield.
N-Methyl-1H-indol-6-amine (9) was synthesized from 1H-indol-6-amine and iodomethane in 52% yield. 1H NMR (400 MHz, CDCl3) δ 7.87 (s, 1H), 7.44 – 7.36 (m, 1H), 6.97 (dd, J = 3.2, 2.3, 1H), 6.57 – 6.48 (m, 2H), 6.44 – 6.38 (m, 1H), 2.86 (s, 3H).
N-Propyl-1H-indol-6-amine (10) was synthesized from 1H-indol-6-amine and 1-bromopropane in 55% yield. 1H NMR (400 MHz, CDCl3) δ 7.85 (s, 1H), 7.39 (d, J = 8.4, 1H), 7.04 – 6.86 (m, 1H), 6.64 – 6.46 (m, 2H), 6.40 (dd, J = 3.6, 1.6, 1H), 3.56 (s, 1H), 3.10 (t, J = 7.1, 2H), 1.82 – 1.54 (m, 2H), 1.02 (t, J = 7.4, 3H).
N-Isobutyl-1H-indol-6-amine (11) was synthesized from 1H-indol-6-amine and 1-iodo-2-methylpropane in 54% yield. 1H NMR (400 MHz, CDCl3) δ 7.82 (s, 1H), 7.39 (d, J = 9.0, 1H), 6.93 (dd, J = 3.2, 2.3, 1H), 6.57 – 6.46 (m, 2H), 6.45 – 6.33 (m, 1H), 3.59 (s, 1H), 2.94 (d, J = 6.8, 2H), 1.92 (dt, J = 13.4, 6.7, 1H), 1.00 (d, J = 6.7, 6H).
N-(Cyclohexylmethyl)-1H-indol-6-amine (12) was synthesized from 1H-indol-6-amine and bromomethylcyclohexane in 48% yield. 1H NMR (400 MHz, CDCl3) δ 7.85 (s, 1H), 7.38 (d, J = 8.4, 1H), 6.95 (dd, J = 3.1, 2.3, 1H), 6.59 – 6.46 (m, 2H), 6.40 (ddd, J = 3.0, 2.0, 0.8, 1H), 3.63 (s, 1H), 2.97 (d, J = 6.7, 2H), 1.90 – 1.79 (m, 2H), 1.79 – 1.55 (m, 4H), 1.33 – 1.10 (m, 3H), 1.00 (qd, J = 12.1, 3.1, 2H).
N-Phenethyl-1H-indol-6-amine (13) was synthesized from 1H-indol-6-amine and 2-bromoethylbenzene in 55% yield. 1H NMR (400 MHz, CDCl3) δ 7.85 (s, 1H), 7.40 (d, J = 8.4, 1H), 7.36 – 7.28 (m, 2H), 7.23 (ddd, J = 4.3, 3.4, 2.4, 3H), 6.96 (dd, J = 3.2, 2.3, 1H), 6.56 (d, J = 1.9, 1H), 6.50 (dd, J = 8.4, 2.1, 1H), 6.40 (ddd, J = 3.1, 2.0, 0.9, 1H), 3.51 (s, 1H), 3.41 (t, J = 7.0, 2H), 2.94 (t, J = 7.0, 2H).
N-(2-(Piperidin-1-yl)ethyl)-1H-indol-6-amine (14) was synthesized from 1H-indol-6-amine and N-(2-chloroethyl)piperidine hydrochloride in 50% yield. 1H NMR (400 MHz, CDCl3) δ 8.28 (s, 1H), 7.39 (d, J = 8.7, 1H), 6.95 (dd, J = 3.0, 2.4, 1H), 6.60 – 6.48 (m, 2H), 6.44 – 6.29 (m, 1H), 4.46 (s, 1H), 4.12 (q, J = 7.1, 1H), 3.17 (t, J = 6.1, 2H), 2.60 (t, J = 6.1, 2H), 2.44 (s, 4H), 1.68 – 1.53 (m, 4H), 1.48 – 1.38 (m, 2H).
N-(2-Morpholinoethyl)-1H-indol-6-amine (15) was synthesized from 1H-indol-6-amine and N-(2-chloroethyl)morpholine hydrochloride in 50% yield. 1H NMR (400 MHz, CDCl3) δ 8.00 (s, 1H), 7.41 (d, J = 8.2, 1H), 6.97 (dd, J = 3.2, 2.3, 1H), 6.56 (ddd, J = 5.1, 3.3, 1.7, 2H), 6.41 (ddd, J = 3.0, 2.0, 0.8, 1H), 3.81 – 3.65 (m, 4H), 3.24 – 3.10 (m, 2H), 2.72 – 2.58 (m, 2H), 2.53 – 2.37 (m, 4H).
N1-(1H-Indol-6-yl)-N3,N3-dimethylpropane-1,3-diamine (16) was synthesized from 1H-indol-6-amine and 3-chloropropyldimethylamine hydrochloride in 55% yield. 1H NMR (400 MHz, CDCl3) δ 8.03 (s, 1H), 7.39 (d, J = 8.4, 1H), 6.96 (dd, J = 3.1, 2.4, 1H), 6.59 – 6.45 (m, 2H), 6.44 – 6.33 (m, 1H), 3.19 (t, J = 6.8, 2H), 2.41 (t, J = 6.9, 2H), 2.25 (s, 6H), 1.81 (p, J = 6.8, 2H).
N-Propyl-1H-indol-5-amine (17) was synthesized from 1H-indol-5-amine and 1-bromopropane in 54% yield.
N-Propyl-1H-indol-4-amine (18) was synthesized from 1H-indol-4-amine and 1-bromopropane in 56% yield.
N-((1H-Indol-5-yl)methyl)propan-1-amine (19) was synthesized from (1H-indol-5-yl)methanamine and 1-bromopropane in 52% yield.
General Procedure for preparation of Compounds 20–39 and 42–44
A mixture of (S)-ketoprofen (1 eq), HBTU or HATU (2.5 eq), and DIPEA (3 eq) in DMF (0.3 mL) was allowed to stand for 30 min at rt. Appropriate amine (9–19, 2.0 eq) was then added to the mixture and stirred for 2 h at rt. Water was added to the reaction mixture and extracted with ethyl acetate followed by successive washings with water and brine. The organic layer was dried over anhydrous sodium sulfate. The solvent was removed in vacuo to give the residue, which was purified by a chromatography over silica gel (Biotage SP4, 12+S column, eluting with hexanes/ ethyl acetate gradient from 10% to 80%) to give the desired compound in 60–80% yield. The purity of all the compounds was determined by HPLC on a Waters Alliance HT LC-MS system (Waters 2795 Separation Module linked to a Waters 2996 Photodiode Array Detector) using a Waters XBridge C18, 3.5 µm (4.6 × 50 mm) column by running a 0 to 95% gradient for Water (+ 0.05% TFA)/MeOH. All the compounds showed ≥ 95% HPLC purity (see Supplemental). Optical activities of the products were not determined.
N-(2-(1H-Indol-5-yl)ethyl)-2-(3-benzoylphenyl)propanamide (20) was synthesized by coupling 7 with 2-(1H-indole-5-yl)ethanamine in 66% yield. 1H NMR (400 MHz, CDCl3) δ 8.22 (s, 1H), 7.75 – 7.69 (m, 2H), 7.67 – 7.62 (m, 2H), 7.61 – 7.55 (m, 1H), 7.51 – 7.42 (m, 4H), 7.40 – 7.34 (m, 1H), 7.23 (d, J = 8.3, 1H), 7.18 – 7.13 (m, 1H), 6.84 (dd, J = 8.3, 1.6, 1H), 6.43 (ddd, J = 3.0, 2.0, 0.9, 1H), 5.39 (s, 1H), 3.63 – 3.37 (m, 3H), 2.82 (m, 2H), 1.50 (d, J = 7.2, 3H). HRMS (ESI (M+H)+ m/z) calcd for C26H25N2O2 397.1916, found 397.1928.
N-((1H-Indol-5-yl)methyl)-2-(3-benzoylphenyl)propanamide (21) Yield 73%. 1H NMR (400 MHz, CDCl3) δ 8.34 (s, 1H), 7.79 – 7.72 (m, 3H), 7.68 – 7.63 (m, 1H), 7.61 – 7.53 (m, 2H), 7.48 – 7.39 (m, 4H), 7.32 – 7.23 (m, 1H), 7.22 – 7.15 (m, 1H), 7.00 (dd, J = 8.4, 1.6, 1H), 6.47 (ddd, J = 3.0, 2.0, 0.9, 1H), 5.72 (s, 1H), 4.48 (qd, J = 14.3, 5.5, 2H), 3.61 (q, J = 7.1, 1H), 1.57 (d, J = 7.1, 3H). HRMS (ESI (M+H)+ m/z) calcd for C25H23N2O2 383.1760, found 383.1756.
2-(3-Benzoylphenyl)-N-(1H-indol-5-yl)propanamide (22) Yield 69%. 1H NMR (400 MHz, CDCl3) δ 8.41 (s, 1H), 7.84 (t, J = 1.6, 1H), 7.81 – 7.72 (m, 3H), 7.70 – 7.62 (m, 2H), 7.60 – 7.53 (m, 1H), 7.49 – 7.40 (m, 4H), 7.19 (d, J = 8.7, 1H), 7.14 – 7.06 (m, 2H), 6.42 (ddd, J = 2.9, 2.0, 0.8, 1H), 3.76 (q, J = 7.1, 1H), 1.60 (d, J = 7.1, 3H). HRMS (ESI (M+H)+ m/z) calcd for C24H21N2O2 369.1603, found 369.1598.
2-(3-Benzoylphenyl)-N-(1H-indol-6-yl)propanamide (23) Yield 62%. 1H NMR (400 MHz, CDCl3) δ 8.61 (s, 1H), 8.03 (s, 1H), 7.86 (s, 1H), 7.81 – 7.73 (m, 2H), 7.70 – 7.62 (m, 2H), 7.61 – 7.51 (m, 2H), 7.44 (m, 4H), 7.09 (dd, J = 3.1, 2.5, 1H), 6.77 (dt, J = 8.4, 1.7, 1H), 6.44 (ddd, J = 3.0, 2.0, 0.9, 1H), 3.79 (q, J = 7.1, 1H), 1.61 (d, J = 7.1, 3H). HRMS (ESI (M+H)+ m/z) calcd for C24H21N2O2 369.1603, found 369.1613.
2-(3-Benzoylphenyl)-N-(1H-indol-2-yl)propanamide (24) Yield 62%. 1H NMR (400 MHz, CDCl3) δ 10.34 (s, 1H), 8.22 (d, J = 4.6, 1H), 7.83 (s, 1H), 7.78 (dd, J = 5.1, 3.3, 2H), 7.72 – 7.55 (m, 3H), 7.53 – 7.36 (m, 4H), 7.32 – 7.20 (m, 1H), 7.15 – 7.01 (m, 2H), 5.78 (d, J = 1.6, 1H), 3.81 (q, J = 7.1, 1H), 1.61 (d, J = 7.1, 3H). HRMS (ESI (M+H)+ m/z) calcd for C24H21N2O2 369.1603, found 369.1606.
N-(2-(3-Benzoylphenyl)propyl)-2-(1H-indol-5-yl)acetamide (25) Yield 63%. 1H NMR (400 MHz, CDCl3) δ 8.27 (s, 1H), 7.71 (dd, J = 5.2, 3.2, 2H), 7.64 – 7.57 (m, 1H), 7.54 (m, 1H), 7.50 – 7.43 (m, 3H), 7.34 (s, 1H), 7.25 (d, J = 7.5, 1H), 7.20 (m, 3H), 6.87 (dd, J = 8.3, 1.6, 1H), 6.46 (m, 1H), 5.30 (s, 1H), 3.60 (s, 2H), 3.52 (m, 1H), 3.24 – 3.12 (m, 1H), 2.91 (dd, J = 15.0, 6.8, 1H), 1.20 (d, J = 7.0, 3H). HRMS (ESI (M+H)+ m/z) calcd for C26H25N2O2 397.1916, found 397.1924.
N-(2-(3-Benzoylphenyl)propyl)-1H-indole-5-carboxamide (26) Yield 60%. 1H NMR (400 MHz, CDCl3) δ 8.72 (s, 1H), 7.97 (d, J = 0.7, 1H), 7.80 – 7.74 (m, 2H), 7.72 (s, 1H), 7.68 – 7.63 (m, 1H), 7.58 – 7.49 (m, 3H), 7.46 – 7.39 (m, 3H), 7.35 – 7.31 (m, 1H), 7.24 – 7.22 (m, 1H), 6.59 – 6.54 (m, 1H), 6.15 (t, J = 5.7, 1H), 3.83 (dt, J = 13.1, 6.4, 1H), 3.51 (ddd, J = 18.8, 9.0, 4.8, 1H), 3.20 (dd, J = 14.7, 6.9, 1H), 1.37 (d, J = 7.0, 3H). HRMS (ESI (M+H)+ m/z) calcd for C25H23N2O2 383.1760, found 383.1761.
N-(2-(3-Benzoylphenyl)propyl)-1H-indole-6-carboxamide (27) Yield 80%. 1H NMR (400 MHz, CDCl3) δ 9.21 (s, 1H), 7.90 (s, 1H), 7.80 – 7.75 (m, 2H), 7.72 (dd, J = 4.6, 2.9, 1H), 7.61 (dt, J = 7.5, 1.5, 1H), 7.59 – 7.52 (m, 2H), 7.47 (dt, J = 7.6, 1.4, 1H), 7.41 (ddd, J = 7.6, 3.4, 2.1, 3H), 7.33 – 7.28 (m, 2H), 6.53 (ddd, J = 3.0, 2.0, 0.9, 1H), 6.24 (t, J = 5.8, 1H), 3.85 – 3.74 (m, 1H), 3.46 (ddd, J = 13.6, 8.5, 5.4, 1H), 3.17 (dd, J = 14.8, 6.8, 1H), 1.35 (d, J = 7.0, 3H). HRMS (ESI (M+H)+ m/z) calcd for C25H23N2O2 383.1760, found 383.1751.
N-(2-(3-Benzoylphenyl)propyl)-1H-indole-2-carboxamide (28) Yield 75%. 1H NMR (400 MHz, CDCl3) δ 9.53 (s, 1H), 7.80 – 7.76 (m, 2H), 7.72 (t, J = 1.7, 1H), 7.66 (dt, J = 7.3, 1.6, 1H), 7.61 – 7.57 (m, 1H), 7.55 (dt, J = 2.6, 1.6, 1H), 7.49 (dt, J = 7.6, 1.5, 1H), 7.47 – 7.43 (m, 2H), 7.43 – 7.39 (m, 2H), 7.27 (ddd, J = 8.3, 7.0, 1.1, 1H), 7.12 (ddd, J = 8.0, 7.0, 1.0, 1H), 6.69 (dd, J = 2.1, 0.8, 1H), 6.21 (t, J = 5.9, 1H), 3.84 (dt, J = 13.3, 6.5, 1H), 3.59 – 3.47 (m, J = 13.7, 8.4, 5.5, 1H), 3.25 – 3.13 (m, J = 14.9, 6.8, 1H), 1.39 (d, J = 7.0, 3H). HRMS (ESI (M+H)+ m/z) calcd for C25H23N2O2 383.1760, found 383.1764.
N-(2-(3-Benzoylphenyl)propyl)-1H-indole-3-carboxamide (29) Yield 41%. 1H NMR (400 MHz, CDCl3) δ 9.60 (s, 1H), 7.95 (s, 1H), 7.76 (dd, J = 8.2, 1.1, 2H), 7.72 (s, 1H), 7.68 – 7.64 (m, 1H), 7.59 (dd, J = 10.5, 4.4, 1H), 7.53 (t, J = 5.0, 2H), 7.48 – 7.42 (m, 3H), 7.41 – 7.34 (m, 1H), 7.33 – 7.28 (m, 2H), 5.89 (t, J = 5.8, 1H), 3.97 – 3.85 (m, 1H), 3.57 – 3.39 (m, 1H), 3.22 (dd, J = 15.4, 6.6, 1H), 1.41 (d, J = 7.0, 3H). HRMS (ESI (M+H)+ m/z) calcd for C25H23N2O2 383.1760, found 383.1760.
N-(2-(3-Benzoylphenyl)propyl)-1H-indole-4-carboxamide (30) Yield 79%. 1H NMR (400 MHz, CDCl3) δ 8.81 (s, 1H), 7.80 – 7.70 (m, 3H), 7.66 (d, J = 7.6, 1H), 7.55 (dd, J = 14.7, 7.5, 2H), 7.47 – 7.37 (m, 5H), 7.19 (t, J = 2.8, 1H), 7.14 (t, J = 7.8, 1H), 6.58 (s, 1H), 6.21 (t, J = 5.4, 1H), 3.89 (dt, J = 13.1, 6.4, 1H), 3.56 (ddd, J = 13.8, 8.8, 5.3, 1H), 3.24 (dd, J = 15.2, 6.8, 1H), 1.39 (d, J = 7.0, 3H). HRMS (ESI (M+H)+ m/z) calcd for C25H23N2O2 383.1760, found 383.1762.
N-(2-(3-Benzoylphenyl)propyl)-1H-indole-7-carboxamide (31) Yield 71%. 1H NMR (400 MHz, CDCl3) δ 10.26 (s, 1H), 7.80 – 7.70 (m, 4H), 7.66 (dt, J = 7.4, 1.5, 1H), 7.58 – 7.52 (m, 1H), 7.50 (dt, J = 7.6, 1.4, 1H), 7.45 (d, J = 7.5, 1H), 7.43 – 7.36 (m, 2H), 7.33 – 7.28 (m, 1H), 7.18 (d, J = 7.5, 1H), 7.03 (t, J = 7.7, 1H), 6.55 (dd, J = 3.2, 2.3, 1H), 6.38 (t, J = 5.5, 1H), 3.83 (dt, J = 13.1, 6.5, 1H), 3.54 (ddd, J = 13.6, 8.4, 5.4, 1H), 3.26 – 3.13 (m, 1H), 1.38 (d, J = 7.0, 3H). HRMS (ESI (M+H)+ m/z) calcd for C25H23N2O2 383.1760, found 383.1760.
2-(3-Benzoylphenyl)-N-(1H-indol-6-yl)-N-methylpropanamide (32) Yield 60%. 1H NMR (400 MHz, CDCl3) δ 8.69 (s, 1H), 7.71 (d, J = 7.4, 2H), 7.66 – 7.49 (m, 4H), 7.45 (t, J = 7.8, 2H), 7.36 (dd, J = 9.1, 6.2, 2H), 7.33 – 7.28 (m, 1H), 7.10 – 6.91 (m, 1H), 6.83 (s, 1H), 6.64 – 6.54 (m, 1H), 3.79 (q, J = 6.9, 1H), 3.30 (s, 3H), 1.41 (d, J = 6.9, 3H). HRMS (ESI (M+H)+ m/z) calcd for C25H23N2O2 383.1760, found 383.1760.
2-(3-Benzoylphenyl)-N-(1H-indol-6-yl)-N-propylpropanamide (33) Yield 73%. 1H NMR (400 MHz, CDCl3) δ 8.73 (s, 1H), 7.87 - 7.64 (m, 3H), 7.65 – 7.48 (m, 4H), 7.47 – 7.40 (m, 2H), 7.39 – 7.27 (m, 3H), 7.04 – 6.68 (m, 1H), 6.58 (s, 1H), 3.87 - 3.67 (m, 2H), 3.66 – 3.51 (m, 1H), 1.58 – 1.46 (m, 2H), 1.39 (d, J = 6.9, 3H), 0.84 (t, J = 7.4, 3H). HRMS (ESI (M+H)+ m/z) calcd for C27H27N2O2 411.2073, found 411.2075.
2-(3-Benzoylphenyl)-N-(1H-indol-6-yl)-N-isobutylpropanamide (34) Yield 60%. 1H NMR (400 MHz, CDCl3) δ 8.65 (s, 1H), 7.81 – 7.64 (m, 3H), 7.64 – 7.50 (m, 3H), 7.50 – 7.40 (m, 3H), 7.36 (t, J = 7.7, 1H), 7.33 – 7.28 (m, 1H), 6.96 (s, 1H), 6.76 (s, 1H), 6.62 – 6.55 (m, 1H), 3.87 – 3.33 (m, 3H), 1.78 (dt, J = 13.7, 6.8, 1H), 1.39 (d, J = 6.9, 3H), 0.85 (dd, J = 23.3, 5.9, 6H). HRMS (ESI (M+H)+ m/z) calcd for C28H29N2O2 425.2229, found 425.2226.
2-(3-Benzoylphenyl)-N-(cyclohexylmethyl)-N-(1H-indol-6-yl)propanamide (35) Yield 60%. 1H NMR (400 MHz, CDCl3) δ 8.61 (s, 1H), 7.80 – 7.62 (m, 3H), 7.58 (t, J = 7.4, 2H), 7.50 – 7.40 (m, 3H), 7.36 (t, J = 7.7, 1H), 7.32 – 7.26 (m, 3H), 6.95 (s, 1H), 6.75 (s, 1H), 6.62 – 6.56 (m, 1H), 3.85 – 3.42 (m, 3H), 1.50 (ddd, J = 18.0, 12.2, 9.8, 4H), 1.39 (d, J = 6.9, 3H), 1.19 – 0.81 (m, 6H). HRMS (ESI (M+H)+ m/z) calcd for C31H33N2O2 465.2542, found 465.2545.
2-(3-Benzoylphenyl)-N-(1H-indol-6-yl)-N-phenethylpropanamide (36) Yield 65%. 1H NMR (400 MHz, CDCl3) δ 8.58 (s, 1H), 7.71 (d, J = 7.5, 2H), 7.54 (ddd, J = 16.9, 14.5, 8.1, 4H), 7.44 (t, J = 7.7, 2H), 7.40 – 7.26 (m, 3H), 7.24 – 6.99 (m, 5H), 6.89 (s, 1H), 6.59 (d, J = 2.2, 1H), 4.06 – 3.55 (m, 3H), 2.88 (t, J = 7.8, 2H), 1.40 (d, J = 6.9, 3H). HRMS (ESI (M+H)+ m/z) calcd for C32H29N2O2 473.2229, found 473.2238.
2-(3-Benzoylphenyl)-N-(1H-indol-6-yl)-N-(2-(piperidin-1-yl)ethyl)propanamide (37) Yield 63%. 1H NMR (400 MHz, CDCl3+ CD3OD) δ 7.71 (d, J = 7.8, 2H), 7.59 (t, J = 7.4, 3H), 7.50 – 7.41 (m, 3H), 7.38 – 7.28 (m, 2H), 7.21 (d, J = 7.8, 1H), 6.95 (bs, 1H), 6.52 (d, J = 2.9, 1H), 6.38 (bs, 1H), 3.90 - 3.75 (m, 1H), 3.16 - 2.91 (m, 4H), 1.97 - 1.67 (m, 6H), 1.57 (s, 1H), 1.41 (d, J = 6.9, 2H), 1.23 – 1.14 (m, 1H). HRMS (ESI (M+H)+ m/z) calcd for C31H34N3O2 480.2651, found 480.2661.
2-(3-Benzoylphenyl)-N-(1H-indol-6-yl)-N-(2-morpholinoethyl)propanamide (38) Yield 58%. 1H NMR (400 MHz, CDCl3) δ 8.68 (bs, 1H), 7.71 (d, J = 7.3, 2H), 7.66 – 7.48 (m, 4H), 7.44 (dd, J = 10.6, 4.7, 2H), 7.40 -7.27 (m, 3H), 7.00 (bs, 1H), 6.85 (bs, 1H), 6.58 (ddd, J = 2.9, 1.9, 0.8, 1H), 4.09 - 3.95 (m, 1H), 3.81 - 3.65 (m, 2H), 3.59 (m, 4H), 2.43 (dd, J = 14.9, 8.8, 6H), 1.40 (d, J = 6.9, 3H). HRMS (ESI (M+H)+ m/z) calcd for C25H23N2O2 383.1760, found 383.1760.
2-(3-Benzoylphenyl)-N-(3-(dimethylamino)propyl)-N-(1H-indol-6-yl)propanamide (39) Yield 67%. 1H NMR (400 MHz, CDCl3) δ 7.73 (d, J = 8.2, 2H), 7.68 - 7.50 (m, 4H), 7.48 (t, J = 7.7, 2H), 7.42 – 7.29 (m, 3H), 7.18 (bs, 1H), 6.92 (bs, 1H), 6.55 (d, J = 2.5, 1H), 3.97 - 3.76 (m, 1H), 3.14 (s, 1H), 2.16 – 1.88 (m, 5H), 1.44 (d, J = 6.7, 1H). HRMS (ESI (M+H)+ m/z) calcd for C30H32N3O3 482.2444, found 482.2439.
2-(3-Benzoylphenyl)-N-(1H-indol-5-yl)-N-propylpropanamide (42) Yield 81%. 1H NMR (400 MHz, CDCl3) δ 8.61 (s, 1H), 7.76 - 7.66 (m, 2H), 7.62 (d, J = 7.5, 1H), 7.56 (t, J = 7.4, 1H), 7.51 – 7.38 (m, 4H), 7.35 (t, J = 7.6, 2H), 7.31 - 7.16 (m, 2H), 6.97 (d, J = 19.3, 1H), 6.57 (s, 1H), 3.85 – 3.53 (m, 3H), 1.60 – 1.45 (m, 2H), 1.40 (d, J = 6.9, 3H), 0.86 (t, J = 7.4, 3H). HRMS (ESI (M+H)+ m/z) calcd for C27H27N2O2 411.2073, found 411.2065.
2-(3-Benzoylphenyl)-N-(1H-indol-4-yl)-N-propylpropanamide (43) Yield 62%. 1H NMR (400 MHz, CDCl3) δ 7.88 (s, 1H), 7.83 – 7.68 (m, 5H), 7.61 – 7.55 (m, 1H), 7.52 (t, J = 7.7, 1H), 7.49 – 7.42 (m, 2H), 7.29 (s, 1H), 7.19 – 7.09 (m, 2H), 7.01 (d, J = 3.2, 1H), 6.06 (d, J = 2.9, 1H), 4.04 (t, J = 7.1, 2H), 3.90 (q, J = 7.1, 1H), 1.88 – 1.77 (m, 2H), 1.69 (d, J = 7.1, 3H), 0.89 (t, J = 7.4, 3H).
N-((1H-Indol-5-yl)methyl)-2-(3-benzoylphenyl)-N-propylpropanamide (44) Yield 72%. 1H NMR (400 MHz, CDCl3) (a mixture of rotamers) δ 8.17 (d, J = 25.6, 1H), 7.78 (t, J = 4.2, 1H), 7.72 (dd, J = 5.1, 3.3, 1H), 7.68 – 7.61 (m, 2H), 7.61 – 7.53 (m, 2H), 7.49 – 7.39 (m, 3H), 7.37 – 7.26 (m, 2H), 7.24 – 7.16 (m, 1H), 6.96 (ddd, J = 65.9, 8.4, 1.5, 1H), 6.48 (dt, J = 9.4, 2.1, 1H), 4.90 (d, J = 14.5, 0.5H), 4.70 (d, J = 16.8, 0.5H), 4.53 (d, J = 14.5, 0.5H), 4.42 (d, J = 16.7, 0.5H), 4.01 (dq, J = 17.3, 6.9, 1H), 3.73 – 3.59 (m, 0.5H), 3.20 (dd, J = 9.7, 5.7, 0.5H), 3.15 – 2.96 (m, 1H), 1.56 – 1.44 (m, 5H), 0.82 (dt, J = 10.2, 7.4, 3H). HRMS (ESI (M+H)+ m/z) calcd for C28H29N2O2 425.2229, found 425.2229.
2-(3-Benzoylphenyl)-N-(1H-indol-6-yl)-2-methylpentanamide (40) Thionyl chloride (0.043 mL, 0.590 mmol) was added to a solution of compound 7 (0.030 g, 0.118 mmol) in methanol (2 mL) at 0 °C and allowed to warm to room temperature. The reaction mixture was refluxed for 2 h and then the solvent was removed in vacuo, dissolved in ethyl acetate and washed with water and brine to give the 2-(3-benzoylphenyl)-2-methylacetate (0.032 g, 100% yield). To a solution of the 2-(3-benzoylphenyl)-2-methylacetate (0.032 g, 0.119 mmol) in DMF, NaH (60% in paraffin oil) (0.011 g, 0.298 mmol) was added and the mixture was stirred for 30 min at room temperature followed by addition of n-propyl iodide (0.023 mL, 0.238 mmol). The mixture was stirred for 2 h at room temperature and then water (10 mL) was added. The mixture was extracted with ethyl acetate (2 × 10 mL) and the organic layer was successively washed with water (2 × 10 mL) and brine (1 × 10 mL). The organic layer was dried over anhydrous sodium sulfate and the solvent was removed in vacuo to give methyl 2-(3-benzoylphenyl)-2-methylpentanoate (0.033 g, 89% yield). Methyl 2-(3-benzoylphenyl)-2-methylpentanoate (0.033 g, 0.106 mmol) was stirred with 1M aqueous lithium hydroxide (0.425 mL, 0.425 mmol) in MeOH (10 mL) at room temperature for 2 h. The solvent was removed and the residue was dissolved in ethyl acetate and washed with 1M hydrochloric acid followed by water and brine. The organic layer was dried over anhydrous sodium sulfate and reduced in vacuo to give 2-(3-benzoylphenyl)-2-methylpentanoic acid (0.030 g, 0.101 mmol, 95 % yield). 1H NMR (400 MHz, CDCl3) δ 7.85 (t, J = 1.7, 1H), 7.79 (dd, J = 5.1, 3.3, 2H), 7.70 – 7.65 (m, 1H), 7.63 – 7.55 (m, 2H), 7.50 – 7.42 (m, 3H), 2.10 – 1.88 (m, 2H), 1.61 (s, 3H), 1.34 – 1.16 (m, 2H), 0.92 (t, J = 7.3, 3H). This acid was coupled with 1H-indol-6-amine following the general procedure to give 40 in 72% yield. 1H NMR (400 MHz, CDCl3) δ 8.52 (s, 1H), 8.08 (s, 1H), 7.89 (t, J = 1.7, 1H), 7.82 – 7.75 (m, 2H), 7.75 – 7.69 (m, 1H), 7.66 (ddd, J = 7.9, 1.9, 1.1, 1H), 7.56 (ddd, J = 8.7, 2.5, 1.2, 1H), 7.53 – 7.45 (m, 2H), 7.42 (t, J = 7.8, 2H), 7.14 (dd, J = 3.1, 2.5, 1H), 6.97 (s, 1H), 6.63 (dd, J = 8.4, 1.9, 1H), 6.46 (ddd, J = 3.0, 2.0, 0.9, 1H), 2.20 – 2.00 (m, 2H), 1.69 (s, 3H), 1.44 – 1.29 (m, 1H), 1.29 – 1.15 (m, 1H), 0.95 (t, J = 7.3, 3H). HRMS (ESI (M+H)+ m/z) calcd for C27H27N2O2 411.2073, found 411.2065.
2-(3-Benzoylphenyl)-N-(1-propyl-1H-indol-6-yl)propanamide (41) The mixture of 23 (0.015 g, 0.041 mmol) and potassium hydroxide (2.5 mg, 0.045 mmol) in DMF (0.2 ml) was stirred for 10 min at room temperature followed by addition of 1-bromopropane (3.7 µL, 0.041 mmol). The mixture was stirred for another 2h. The reaction was quenched by addition of water (5 mL) and extracted with ethyl acetate (2 × 5 mL). The organic layer was washed with water (2 × 5 ml) followed by brine (5 mL) and dried over anhydrous sodium sulfate. The solvent was removed in vacuo and the residue purified by flash chromatography (Biotage SP4, 25+M silica gel column, eluting with hexane ethyl acetate gradient 10%–100 %) to give 41 in 54% yield. 1H NMR (400 MHz, CDCl3) δ 8.05 (s, 1H), 7.85 (s, 1H), 7.83 – 7.78 (m, 2H), 7.74 – 7.65 (m, 2H), 7.59 (t, J = 7.4, 1H), 7.48 (dt, J = 7.4, 6.3, 4H), 7.16 (s, 1H), 7.06 (d, J = 3.1, 1H), 6.69 (dd, J = 8.4, 1.9, 1H), 6.41 (d, J = 2.4, 1H), 4.05 (t, J = 7.1, 2H), 3.81 (q, J = 7.0, 1H), 1.85 (dd, J = 14.4, 7.2, 2H), 1.67 (d, J = 7.1, 3H), 0.91 (t, J = 7.4, 3H). HRMS (ESI (M+H)+ m/z) calcd for C27H27N2O2 411.2073, found 411.2072.
Gli-mediated transcription reporter assay in C3H10T1/2 cells transfected with Gli1 or Gli2
C3H10/T1/2 cells were plated at 2.5×10⁵ cells/dish in two 60-mm culture dishes in 5 mL of basal medium Eagle (BME) (Invitrogen Corporation, Carlsbad, CA) containing 2 mM L-glutamine and 10% fetal bovine serum (FBS, Hyclone Laboratories, Logan, UT). The cells were maintained in 5% CO2 at 37 °C in a humidified incubator. After 24 h, the cells were transfected at approximately 75% confluence by replacing the media with 5 mL BME (10% FBS) containing the mixture of plasmids encoding cDNAs of GliLuc-BS (250 ng/mL), hGli1 (250 ng/mL), and pRL-TK (12.5 ng/mL) (Promega, Madison, WI) and the transfection reagent Fugene6 (1:3 w/v of DNA) (F. Hoffmann-La Roche, Basel, Switzerland) and incubated overnight. A simultaneous control was transfected with empty vector, pcDNA3, GliLuc, pRL-TK, and Fugene6 in similar ratios as used for hGli1. Eighteen hours after transfection, the cells were trypsinized and reconstituted in 10 mL BME (10% FBS) and plated in a white 96-well cell culture plate at 100 µL/well. Six hours after plating, the media in the wells was replaced with 100 µL BME (10% FBS) containing the compound or the DMSO control. After exposing the cells to compound for 24 h at 37 °C in 5% CO2, the media was carefully aspirated to remove the compound, and the cells were lysed with 20 µL/well of Passive Lysis Buffer (1×) by placing the plate on a shaking platform for 15 min at 600 rpm. The luciferase activity was determined using Dual-Luciferase Reporter Assay System (Promega) according to manufacturer’s instructions. The activity was determined by dividing the luminescence of the firefly luciferase by that of Renilla luciferase. The assay for mGli2 was carried out following the protocol for the hGli1-transactivation assay except replacing hGli1 with mGli2.
Gli-mediated transcription reporter assay in Rh30 cells
Rh30 cells were plated at 3 ×10⁵ cells/dish in two 60-mm culture dishes in 5 mL RPMI-1640 (ATCC, Manassas, VA) containing 10% FBS (Hyclone Laboratories) and were maintained in 5% CO2 at 37 °C in a humidified incubator. After 24 h, the cells were transfected at approximately 70% confluence by replacing the media with 5 mL RPMI-1640 (10% FBS) containing the DNA mixture of GliLuc-BS (500 ng/mL) and pRL-CMV (2.5 ng/mL) (Promega), and Fugene6 (1:3 w/v of DNA) (F. Hoffmann-La Roche, Basel, Switzerland) and incubated overnight. Six hours after transfection, the cells were trypsinized and reconstituted in 10 mL RPMI-1640 (10% FBS) and plated in a white 96-well cell culture plate at 100 µL/well. Eighteen hours after plating, the media was replaced with 100 µL RPMI-1640 (10% FBS) containing the compound or the DMSO control. After cells were exposed to compound for 24 h at 37 °C in 5% CO2, the media was aspirated, and the cells were lysed with 20 µL/well of Passive Lysis Buffer (1×) by placing the plate on a shaking platform for 15 min at 600 rpm. The luciferase activity was determined as described above in the method using C3H10T1/2 cells.
Real-time RT-PCR
Rh30 cells were grown in 6-well plates and treated with compound or DMSO control. Plates were incubated for 24 h and cells were harvested by trypsinization. Total RNA extraction was carried out using Qiagen RNeasy kit (QIAGEN, Valencia, CA). Each RNA sample (250 ng) was used for cDNA synthesis using the QuantiTect Reverse Transcription kit (QIAGEN, Valencia, CA), following DNase removal according to the manufacturer’s protocol. The real time PCR reaction was carried out in 10 µL reactions using the QunatiFast SYBR Green PCR kit (QIAGEN, Valencia, CA). 1 µL of each 10 times-diluted cDNA sample was used along with each primer at 200 nM concentration. The relative quantity of Gli1-target mRNA level in each sample was determined using the comparative Ct method where the amount of target, normalized to GAPDH (endogenous control) and relative to a calibrator, is calculated using the formula 2−ΔΔCt. The ΔΔCt was calculated by subtracting the ΔCt (DMSO control) from the ΔCt (target gene) where ΔCt is the value of Ct (target gene or DMSO control) - Ct (GAPDH). Primer sequences are:
Ptch1: forward 5’TCCCAAGCAAATGTACGAGCA, reverse 5’TCCCAAGCAAATGTACGAGCA
Bcl2: forward 5’TGTGTGGAGAGCGTCAACC, reverse 5’GCCGTACAGTTCCACAAAGG
Cyclin-D1: forward 5’CTCTGTGCCACAGATGTGAA, reverse 5’TCCTGTCCTACTACCGCCTCA
GAPDH: forward 5’GGAGTCAACGGATTTGGTC, reverse 5’CCACCCATGGCAAATTCCA
Cell growth suppression assay
The cells were plated in the appropriate medium in a 384-well plate at 1.0 ×10³ (BJ) or 1.6 ×10³ (other cells) cells/well 24 h before the addition of the compounds. The 10-mM stock solution of each compound in DMSO was diluted in EMEM media to prepare 160-µM solution (4×), and 10 µL of that solution was added in triplicate to get a final concentration of 40 µM/well. The cells were allowed to incubate at 37 °C for 68 h. Alamar Blue (4 µL) (Biotium, Inc., Hayward, CA) was added to each well, and the plates were incubated for 4 h at 37 °C. The fluorescence was measured with excitation wavelength at 510 nm and emission wavelength at 590 nm using an EnVision Multilabel Plate Reader (PerkinElmer, Waltham, MA, USA). The cell viability was determined by comparing the fluorescence of experimental wells with that of the DMSO control wells.
Microsomal stability assay
The NADPH regenerating agent Solutions A (catalog#: 451220) and B (catalog#: 451200) and mouse liver microsomes (CD-1, female, catalog#: 452702) were obtained from BD Gentest (Woburn, MA). The microsomal stability assay was carried out as described22. The 2 mM solutions in 20% DMSO/80% acetonitrile were prepared from DMSO stock solutions (10 mM) of test compounds. Mouse liver microsomal solution was prepared by adding 1.27 mL of concentrated mouse liver microsomes (20 mg/mL protein concentration) to 38.6 mL of pre-warmed (37°C) 0.1 M potassium phosphate buffer (pH 7.4) containing 102 µL of 0.5 M EDTA to make a 0.6329 mg/mL (protein) microsomal solution. Each test compound (30.4 µL of 2 mM solution) was added directly to 2.4 mL of rat liver microsomal solution and 180 µL was transferred to 12 wells of a 96 well plate (0, 0.5, 1 and 2 h time points each in triplicate). The NADPH regenerating agent was prepared by mixing 2.5 mL of NADPH regenerating agent Solutions A, 0.5 mL of solution B and 7 mL of 0.1 M potassium phosphate buffer (pH 7.4). To each well of the 96 well plate, 45 µL of the NADPH regenerating agent was added to initiate the reaction, and the plate was incubated at 37°C for each time point (0, 0.5, 1 and 2 h each in triplicate wells). The reaction was quenched by adding 450 µL of cold acetonitrile containing ketoconazole (500 nM final conc.) as internal control to each well. All of the plates were centrifuged at 3000 rpm for 15 min and the supernatants (200 µL) were transferred to another 96 well plates for analysis on UPLC-MS (Waters Acquity UPLC linked to Waters Acquity Photodiode Array Detector and Waters Acquity Single Quadrupole Mass Detector) on Acquity UPLC BEH C18 1.7 µM (2.1 × 50 mm) column by running 90% to 5 % gradient for water (+ 0.1% formic acid) and acetonitrile (+ 0.1% formic acid). The area under the single ion recording (SIR) channel for the test compound divided by the area under the SIR for internal control at 0 time concentration was considered as 100% to calculate remaining concentration at each time point. The terminal phase rate constant (ke) was estimated by linear regression of logarithmic transformed concentration vs. the data, where ke = slope × (-ln10). The half life t1/2 was calculated as ln2/ ke.
Parallel artificial membrane permeability assay (PAMPA)
This assay is to analyze permeability of various compounds on a homogeneous artificial lipid membrane using the normal Double-Sink PAMPA protocol. 6 µL of 10 mM compounds solution in DMSO was applied to each well in a stock plate. Compounds were diluted 200 fold in system solution buffer (SSB, pH=7.4; pION INC, Woburn, MA). 180 µL of diluted solution was added to a donor plate (pION INC, Woburn, MA). A filter plate (acceptor plate; pION INC, Woburn, MA) containing 200 µL of acceptor sink buffer (ASB, pH=7.4; pION INC, Woburn, MA) was then placed over the donor plate. The plates were incubated at room temperature for 0.5 h with magnetic stirring in individual well to allow the compounds to cross the membrane. Fractions were collected from both the donor plate and the acceptor plate, and concentrations were assessed by UV spectrometry (230–500 nm). Sample preparation, sample analysis, and data processing were fully automated using Biomek FX ADME-TOX workstation and the UV-based PAMPA Evolution-96 Command Software. All compounds were tested in triplicates.
Caco-2 permeability assay
Caco-2 permeability was performed in the 96-well Transwell system. Caco-2 cells were maintained at 37 °C in a humidified incubator with an atmosphere of 5% CO2. The cells were cultured in MEM containing 20% FBS in 75 cm2 flasks, 100 units/mL of penicillin, and 100 µg/ml of streptomycin. The Caco-2 cells were seeded onto inserts of a 96-well plate at a density of 0.165×10⁵ cells/insert and cultured in the MEM containing 10% FBS for 7 days. Each cultured monolayer on the 96-well plate was washed twice with HBSS/HEPES (10 mM, pH 7.4). The permeability assay was initiated by the addition of each compound solution (50 µM) into inserts (apical side, A) or receivers (basolateral side, B). The Caco-2 cell monolayers were incubated for 2 h at 37 °C. Fractions were collected from receivers (if apical to basal permeability) or inserts (if basal to apical permeability), and concentrations were assessed by UPLC/MS (Waters; Milford, MA). All compounds were tested in triplicates. The A→B (or B→A) apparent permeability coefficients (Pappa, cm/s) of each compound were calculated using the equation, Pappa=dQ/dt×1/AC0. The flux of a drug across the monolayer is dQ/dt (µmol/s). The initial drug concentration on the apical side is C0 (µmol/L). The surface area of the monolayer is A (cm2).
Supplementary Material
Acknowledgments
We thank Mr. Marcelo Actis and Dr. Anand Mayasundari for excellent technical support, Dr. Shunsuke Ishii (RIKEN, Tsukuba, Japan) and Dr. Hiroshi Sasaki (RIKEN, Kobe, Japan) for the gift of Gli1, Gli2 and Gli-Luc plasmids. This work was supported by the American Lebanese Syrian Associated Charities (ALSAC) and NCI Cancer Center Support Grant 5 P30CA021765-31.
Abbreviations
- Hh
Hedgehog
- Gli
glioma-associated oncogene homolog
- Smo
Smoothened
- Ptch1
Patched 1
- SuFu
Suppressor of Fused
- GAPDH
glyceraldehyde 3-phosphate dehydrogenase
- Gli-Luc
Gli-responsible firefly luciferase
- HATU
2-(1H-7-azabenzo[d][1,2,3]triazol-1-yl)-1,1,3,3-tetramethyl-uronium hexafluorophosphate
- HBTU
2-(1H-benzo[d][1,2,3]triazol-1-yl)-1,1,3,3-tetramethyl-uronium hexafluorophosphate
- DIPEA
N,N-Diisopropylethylamine
- RT-PCR
reverse transcription polymerase chain reaction
- PAMPA
parallel artificial membrane permeability assay
Footnotes
Publisher's Disclaimer: This is a PDF file of an unedited manuscript that has been accepted for publication. As a service to our customers we are providing this early version of the manuscript. The manuscript will undergo copyediting, typesetting, and review of the resulting proof before it is published in its final citable form. Please note that during the production process errors may be discovered which could affect the content, and all legal disclaimers that apply to the journal pertain.
Supplementary Materials
Author contributions, method for the alkaline phosphatase assay, data of control experiments (Figures S1–S4) and HPLC traces for compounds 20–44, are available online.
References
- 1.Pasca di Magliano M, Hebrok M. Nat Rev Cancer. 2003;3:903. doi: 10.1038/nrc1229. [DOI] [PubMed] [Google Scholar]
- 2.Mahindroo N, Punchihewa C, Fujii N. J Med Chem. 2009;52:3829. doi: 10.1021/jm801420y. [DOI] [PMC free article] [PubMed] [Google Scholar]
- 3.Yauch RL, Dijkgraaf GJ, Alicke B, Januario T, Ahn CP, Holcomb T, Pujara K, Stinson J, Callahan CA, Tang T, Bazan JF, Kan Z, Seshagiri S, Hann CL, Gould SE, Low JA, Rudin CM, de Sauvage FJ. Science. 2009;326:572. doi: 10.1126/science.1179386. [DOI] [PMC free article] [PubMed] [Google Scholar]
- 4.Romer JT, Kimura H, Magdaleno S, Sasai K, Fuller C, Baines H, Connelly M, Stewart CF, Gould S, Rubin LL, Curran T. Cancer Cell. 2004;6:229. doi: 10.1016/j.ccr.2004.08.019. [DOI] [PubMed] [Google Scholar]
- 5.Lee Y, Kawagoe R, Sasai K, Li Y, Russell HR, Curran T, McKinnon PJ. Oncogene. 2007;26:6442. doi: 10.1038/sj.onc.1210467. [DOI] [PubMed] [Google Scholar]
- 6.Kimura H, Ng JM, Curran T. Cancer Cell. 2008;13:249. doi: 10.1016/j.ccr.2008.01.027. [DOI] [PubMed] [Google Scholar]
- 7.Joeng KS, Long F. Development. 2009;136:4177. doi: 10.1242/dev.041624. [DOI] [PMC free article] [PubMed] [Google Scholar]
- 8.Lauth M, Bergstrom A, Shimokawa T, Toftgard R. Proc. Natl. Acad. Sci. U S A. 2007;104:8455. doi: 10.1073/pnas.0609699104. [DOI] [PMC free article] [PubMed] [Google Scholar]
- 9.Hosoya T, Arai MA, Koyano T, Kowithayakorn T, Ishibashi M. Chembiochem. 2008;9:1082. doi: 10.1002/cbic.200700511. [DOI] [PubMed] [Google Scholar]
- 10.Mahindroo N, Connelly MC, Punchihewa C, Kimura H, Smeltzer MP, Wu S, Fujii N. J Med Chem. 2009;52:4277. doi: 10.1021/jm900106f. [DOI] [PMC free article] [PubMed] [Google Scholar]
- 11.Kimura H, Stephen D, Joyner A, Curran T. Oncogene. 2005;24:4026. doi: 10.1038/sj.onc.1208567. [DOI] [PubMed] [Google Scholar]
- 12.Fiaschi M, Rozell B, Bergstrom A, Toftgard R. Cancer Res. 2009;69:4810. doi: 10.1158/0008-5472.CAN-08-3938. [DOI] [PMC free article] [PubMed] [Google Scholar]
- 13.Forbes IT, Douglas S, Gribble AD, Ife RJ, Lightfoot AP, Garner AE, Riley GJ, Jeffrey P, Stevens AJ, Stean TO, Thomas DR. Bioorg Med Chem Lett. 2002;12:3341. doi: 10.1016/s0960-894x(02)00690-x. [DOI] [PubMed] [Google Scholar]
- 14.Wright JL, Gregory TF, Kesten SR, Boxer PA, Serpa KA, Meltzer LT, Wise LD, Espitia SA, Konkoy CS, Whittemore ER, Woodward RM. J Med Chem. 2000;43:3408. doi: 10.1021/jm000023o. [DOI] [PubMed] [Google Scholar]
- 15.Yauch RL, Gould SE, Scales SJ, Tang T, Tian H, Ahn CP, Marshall D, Fu L, Januario T, Kallop D, Nannini-Pepe M, Kotkow K, Marsters JC, Rubin LL, de Sauvage FJ. Nature. 2008;455:406. doi: 10.1038/nature07275. [DOI] [PubMed] [Google Scholar]
- 16.Canettieri G, Di Marcotullio L, Greco A, Coni S, Antonucci L, Infante P, Pietrosanti L, De Smaele E, Ferretti E, Miele E, Pelloni M, De Simone G, Pedone EM, Gallinari P, Giorgi A, Steinkuhler C, Vitagliano L, Pedone C, Schinin ME, Screpanti I, Gulino A. Nat Cell Biol. 2010;12:132. doi: 10.1038/ncb2013. [DOI] [PubMed] [Google Scholar]
- 17.Gerber AN, Wilson CW, Li YJ, Chuang PT. Oncogene. 2007;26:1122. doi: 10.1038/sj.onc.1209891. [DOI] [PMC free article] [PubMed] [Google Scholar]
- 18.Yoon JW, Kita Y, Frank DJ, Majewski RR, Konicek BA, Nobrega MA, Jacob H, Walterhouse D, Iannaccone P. J Biol Chem. 2002;277:5548. doi: 10.1074/jbc.M105708200. [DOI] [PubMed] [Google Scholar]
- 19.Jiang XR, Jimenez G, Chang E, Frolkis M, Kusler B, Sage M, Beeche M, Bodnar AG, Wahl GM, Tlsty TD, Chiu CP. Nat Genet. 1999;21:111. doi: 10.1038/5056. [DOI] [PubMed] [Google Scholar]
- 20.Hyman JM, Firestone AJ, Heine VM, Zhao Y, Ocasio CA, Han K, Sun M, Rack PG, Sinha S, Wu JJ, Solow-Cordero DE, Jiang J, Rowitch DH, Chen JK. Proc Natl Acad Sci U S A. 2009;106:14132. doi: 10.1073/pnas.0907134106. [DOI] [PMC free article] [PubMed] [Google Scholar]
- 21.Shimoyama A, Wada M, Ikeda F, Hata K, Matsubara T, Nifuji A, Noda M, Amano K, Yamaguchi A, Nishimura R, Yoneda T. Mol Biol Cell. 2007;18:2411. doi: 10.1091/mbc.E06-08-0743. [DOI] [PMC free article] [PubMed] [Google Scholar]
- 22.Di L, Kerns EH, Li SQ, Petusky SL. Int J Pharm. 2006;317:54. doi: 10.1016/j.ijpharm.2006.03.007. [DOI] [PubMed] [Google Scholar]
Associated Data
This section collects any data citations, data availability statements, or supplementary materials included in this article.


