Abstract
SIRT4, a member of the sirtuin family, has been implicated in the regulation of insulin secretion by modulation of glutamate dehydrogenase. However, the role of this enzyme in the regulation of metabolism in other tissues is unknown. In this study we investigated whether depletion of SIRT4 would enhance liver and muscle metabolic functions. To do this SIRT4 was knocked down using an adenoviral shRNA in mouse primary hepatocytes and myotubes. We observed a significant increase in gene expression of mitochondrial and fatty acid metabolism enzymes in hepatocytes with reduced SIRT4 levels. SIRT4 knockdown also increased SIRT1 mRNA and protein levels both in vitro and in vivo. In agreement with the increased fatty acid oxidation (FAO) gene expression, we showed a significant increase in FAO in SIRT4 knockdown primary hepatocytes compared with control, and this effect was dependent on SIRT1. In primary myotubes, knockdown of SIRT4 resulted in increased FAO, cellular respiration, and pAMPK levels. When SIRT4 was knocked down in vivo by tail vein injection of a shRNA adenovirus, we observed a significant increase in hepatic mitochondrial and FAO gene expression consistent with the findings in primary hepatocytes. Taken together these findings demonstrate that SIRT4 inhibition increases fat oxidative capacity in liver and mitochondrial function in muscle, which might provide therapeutic benefits for diseases associated with ectopic lipid storage such as type 2 diabetes.
Keywords: Fatty Acid Oxidation, Metabolism, Mitochondrial Metabolism, SIRT, Sirtuins
Introduction
Sirtuins (SIRTs)2 are an evolutionarily conserved family of NAD-dependent family of deacetylases that regulate diverse set of biological processes including stress response, genome maintenance, and energy metabolism (1, 2). The sirtuin family consists of seven family members (SIRT1–7), each containing a conserved catalytic core domain (3). SIRT1, SIRT2, SIRT3, and SIRT5 catalyze the NAD-dependent deacetylation, whereas SIRT4 and SIRT6 have been proposed to mediate ADP-ribosylation of protein substrates. The sirtuins are located in different organelles (4), with SIRT4 mainly localized in the mitochondria (5). Recent studies suggested that SIRT4 uses NAD to ADP-ribosylate and inactivate glutamate dehydrogenase, an enzyme that converts glutamate to α-ketoglutarate in mitochondria and thereby suppresses insulin secretion from pancreatic beta cells (5, 6). In addition to pancreatic beta cells, SIRT4 is highly expressed in brain, liver, kidney, and heart with moderate expression in skeletal muscle (5). The function of SIRT4 in these other tissues is unknown. Based on its mitochondrial localization, we hypothesized that SIRT4 is involved in mitochondrial oxidative metabolism. To test our hypothesis, we knocked down SIRT4 expression in primary hepatocytes and myotubes with an adenovirus expressing a SIRT4 shRNA and assessed fatty acid oxidation and oxygen consumption. In addition, we delivered an shRNA adenovirus in vivo to knock down SIRT4 specifically in liver in mice.
EXPERIMENTAL PROCEDURES
Cell Culture and Adenoviral Transduction
The sequence of Ad-shRNA-SIRT4 adenovirus was synthesized as described (5). The primers used were 5′-TTCGAACATATGTCTTCGAAAGCCTCCATTGGGTTAT (forward) and 5′-CTCGAGGCCCTGAAAATACAGGTTTTCGCATGGGTCTATCAAAGGCAG (reverse). The adenovirus was made by Welgen, Inc. 1012 vp/ml virus was aliquoted and stored at −80 °C before use. When ready for the experiments, 5 × 10⁹ vp/ml virus was diluted in William's E media.
Primary mouse hepatocytes seeded at 1 × 10⁶ cells/well in 6-well plates were purchased from CellzDirect. Upon cell arrival, media were changed to fresh media following the protocol provided by CellzDirect.
Primary mouse myoblasts were plated onto collagen-coated 6-well plates at a density of 8 × 10⁵ cells/well. The following day the cells were washed once with PBS then induced to differentiate by adding DMEM containing 5% horse serum for 3 days, changing the media once. Four hours after changing to fresh media, primary mouse hepatocytes were transduced either with an shRNA-control or shRNA-SIRT4 (5 × 10⁹ vp/ml) adenovirus for 48 h. The medium was replaced the next day with virus-free medium, and cells were harvested 48 h post-infection for RNA, FAO, and protein measurements.
Primary myotubes were transduced with 5 × 10⁸ viral particles per well of either sh-scramble or shRNA SIRT4 adenovirus, replacing the media after 24 h. Total RNA was extracted from cells using 1 ml of TRIzol (Invitrogen) according to the instructions provided by the supplier. The RNA was extracted following instructions for the mini RNeasy spin column (Qiagen).
Western Blot Analysis
Hepatocyte cells transduced with control shRNA or shRNA-SIRT4 adenovirus were harvested after 48 h. Cells were lysed with radioimmune precipitation assay lysis buffer (Upstate Biotechnology) supplemented with 10 mm NaF (Sigma), 2 mm Na3VO4 (Sigma), 1 mm phenylmethylsulfonyl fluoride (Pierce), 5 μm leupeptin (Sigma), 10 μm pepstatin (Fisher). The lysed cells were further dissolved by vortexing and left on ice for 30 min followed by centrifugation at 14,000 rpm for 20 min at 4 °C. Protein concentration was determined using the BCA assay (Pierce). Equal amount of proteins (40 μg/lane) from each treated group mixed with SDS sample buffer (Boston Bioproducts) were loaded on a 4–12% NuPage gel (Invitrogen). After electrophoresis, proteins were transferred to a PVDF membrane (Invitrogen) with the Mini Cell Novex system at 33 V for 1.5 h. The membrane was first blocked with 5% milk, TBS-Tween for 1 h followed by blotting with primary antibodies in 5% milk/TBS-Tween overnight at 4 °C. The chicken anti-mouse actin monoclonal antibody (Chemicon) was used to detect actin as a loading control. SIRT1 protein was detected using the rabbit anti-SIRT1 antibody, diluted 1:1000 (Upstate). After an overnight incubation, the membranes were washed three times with TBS-Tween and blotted with the secondary donkey anti-rabbit horseradish peroxidase antibody (Amersham Biosciences) at room temperature for 1 h followed by washing 3 times in TBS-Tween. The proteins were detected with ECL Super Signal West Pico (Pierce) or Super Signal West Dura (Pierce). The Fujifilm scanner (program of imageReaderLAS-3000) was used for detection of the signal.
In the Western blot for AMPK, mouse primary hepatocytes were transduced with the shRNA-SIRT4 adenovirus as described above. Forty-eight hours after transduction, the cells were starved for 2 h in 0.1% BSA. The cells were then stimulated with 2 mm 5-aminoimidazole-4-carboxamide ribonucleoside by carefully removing half the volume of media and adding a 2× treatment (1 mm final) or vehicle for 30 min. Cells were rinsed with ice-cold PBS and scraped on ice into lysis buffer (Cell Signaling Technology) that contained 20 mm Tris-HCl (pH 7.5), 50 mm NaCl, 1 mm EGTA, 1 mm Na2EDTA, 1% Triton, 2.5 mm sodium pyrophosphate, 1 mm β-glycerophosphate, 1 mm Na3VO4, and 1 μg/ml leupeptin. The cell lysates were then sonicated for 30 s. Nuclei and cell debris were removed by centrifugation (12,000 × g for 10 min), and 20 μg were run on a 4–12% Tris-glycine gel and transferred. The blots were incubated overnight at 4 °C with gentle shaking with a phospho-AMP kinase (Thr-172) antibody (Cell Signaling Technology) at a 1:500 dilution. The blots were extensively washed with PBS containing 0.05% Tween 20 (Bio-Rad) and 0.15% dry milk at room temperature and were further incubated with a 1:2000 dilution of horseradish peroxidase-coupled rabbit anti-mouse IgG in PBS containing 0.05% Tween 20 for 1 h at room temperature. The blots were then washed, and the signal was visualized by chemiluminescence according to the manufacturer's protocol. After stripping of phospho-αAMP kinase blots, total AMP kinase (Cell Signaling Technology) immunoreactivity was determined.
Gene Expression Analysis
Total RNA was isolated from primary hepatocytes or primary myotubes transduced with control shRNA and shRNA using the Qiagen RNeasy mini kit. For primary hepatocytes, cells were washed 2× with PBS and lysed with 500 μl of RNeasy lysis buffer supplied with the kit. The lysate was added to a Qiashredder (Qiagen). Using the manufactures protocol for the RNeasy mini kit, RNA was prepared, and 1 μg was used for the cDNA synthesis reaction. cDNA was made using the Bio-Rad iScript cDNA synthesis kit. For quantitative RT-PCR, cDNA was diluted 1:10, and 2–3 μl was used for each 10-μl PCR reaction. Taqman components include 5 μl of Taqman universal PCR master mix (Applied Biosystems), 0.5 μl of eukaryotic 18 S rRNA (served as an endogenous control (Applied Biosystems)), or 0.5 μl of PROBE. TaqMan gene expression assay probes for mitochondrial, fatty acid utilization, and transcriptional regulatory genes were purchased from Applied Biosystem (Table 1).
TABLE 1.
Probes for TaqMan gene expression assays
| Probe name | Applied Biosystem catalog no. |
|---|---|
| Cytochrome c | Mm01621044_g1 |
| PGC1α | Mm00447183_m1 |
| ERRα | Mm00433143_m1 |
| Isocitrate dehydrogenase 3α | Mm00499674_m1 |
| Cytochrome c oxidase subunit Va | Mm00432638_m1 |
| CPT-1a | Mm00487200_1m |
| PDK4 | Mm004443325_m1 |
| Medium chain acyl-CoA dehydrogenase | Mm00431611_m1 |
| SIRT4 | Mm001201917_m1 |
| SIRT1 | Mm00490758_ml |
| SIRT3 | Mm00452129_ml |
| PPARα | Mm00440930_ml |
| PPARδ | Mm00802186_ml |
| 18 S | Mm4310893E |
Fatty Acid Oxidation
Mouse primary hepatocytes seeded at 1 × 10⁶ cells/well in 6-well plates were transduced with an adenovirus expressing LacZ-shRNA (control) or an shRNA-control (scramble) or shRNA-SIRT4 (5 × 10⁹ vp/ml) in culture medium. The medium was changed after 24 h, and cells were used to measure FAO after 48 h post-infection. On the day of the experiment, cells were washed 1× with PBS and incubated in serum-free media containing 0.5 mg/ml BSA and [3H]palmitate (10 μm cold palmitate and 8.93 μCi/ml [3H]palmitate in each well) for 90 min. At the end of the incubation 100 μl of the media were transferred to a 96-well filter plate containing 100 μl of the phosphate-buffered equilibrated activated charcoal slurry (Sigma). The plate was centrifuged for 45 min at 2800 rpm. At the end of centrifugation, the charcoal-containing plate was discarded, and filtrate was counted in scintillation counter. Three biological samples were used for each assay. Mouse primary myoblasts were isolated from FVB mice as described previously (7). Myoblasts were plated onto collagen-coated 6-well plates at a density of 800,000 cells/well. The following day the cells were washed once with PBS then induced to differentiate by adding DMEM containing 5% horse serum for 3 days, with one media change. The cells were transduced with 5 × 10⁸ viral particles per well of either shRNA control or shRNA-SIRT4 adenovirus, replacing the media after 24 h. Fatty acid oxidation rates were measured as described previously (7) at 48 h post-transduction.
Oxygen Consumption
Mouse primary myoblasts were seeded at 6 × 10⁴ cells per well in differentiation medium containing DMEM with 5% horse serum on XF-24 cell culture plates (Seahorse) coated with rat tail collagen gel. The myotubes were transduced with an shRNA control (scramble) or an shRNA-SIRT4 at 48 h post-differentiation. Cellular oxygen consumption rate was measured by Seahorse XF24 at 48 h transduction. The concentrations of oligomycin and carbonyl cyanide p-trifluoromethoxyphenylhydrazone were 1.5 μg/ml and 0.6 μm, respectively.
In Vivo Knockdown of SIRT4
Chow fed, 4-month-old male C57BL/6 mice (Taconic) were housed under a reverse light-dark cycle. Mice were injected via the tail vein with PBS or 5 × 10⁸ pfu/mouse of an adenovirus expressing either a shRNA-SIRT4 or a scramble shRNA-control. Liver and plasma were collected 4 days after administration of the adenovirus. Blood glucose was measured using a handheld glucometer (One Touch Ultra, LifeScan). Liver RNA was isolated as described above. All animal procedures were performed in accordance with animal welfare regulations under an approved institutional Animal Care and Use Committee protocol in the Novartis Institute for Biomedical Research animal facility, which is accredited by the Association for Assessment and Accreditation of Lab Animal Care.
Data Mining
db/db, C57BLKS/J (db/db background), ob/ob, C57BL/6J (ob/ob background), and KKAa, KKAy mice of 8 weeks of age were purchased from The Jackson Laboratory and kept on chow diet and normal light cycle. Mice were sacked at 9 a.m. without fasting, and RNAs from the liver tissue (n = 4) for each group were extracted and hybridized to Affymetrix Mouse4302 platform. Raw data in cell file format were normalized using PLIER (Probe Logarithmic Intensity Error) (Affymetrix 2008) and summarized into probe-set level expression values. Welch t tests were performed on SIRT4 gene (probe set id 1426847_at) for differential expression between the diabetes model mice versus their corresponding control.
RESULTS
SIRT4 Knockdown Increases the Expression of Fatty Acid Oxidation Genes in Primary Mouse Hepatocytes
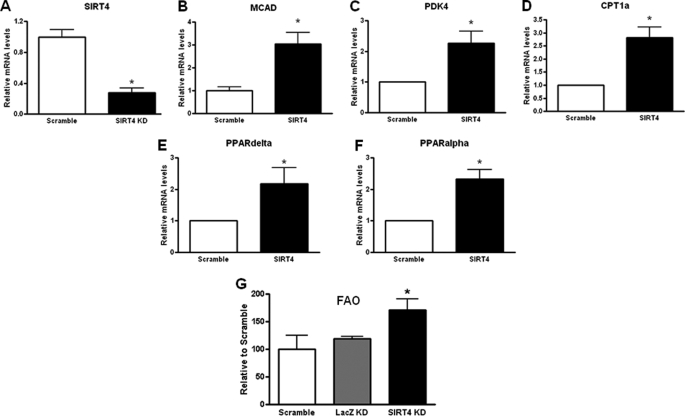
To evaluate the role of SIRT4 in regulating fatty acid oxidation, primary mouse hepatocytes were transduced with the shRNA-SIRT4 or a shRNA-control for 48 h. RNA was extracted, and the expression levels of several key enzymes in fatty acid metabolism were analyzed. SIRT4 mRNA levels were reduced 72% in by the SIRT4-shRNA (Fig. 1A). We observed a significant change in fatty acid oxidation genes including MCAD (medium chain acyl-CoA dehydrogenase), PDK4 (pyruvate dehydrogenase kinase isoenzyme 4), CPT1α (carnitine palmitoyltransferase 1α), PPARδ, and PPARα in SIRT4 knockdown primary hepatocytes compared with control (scramble shRNA; Fig. 1, B–F).
FIGURE 1.
SIRT4 knockdown increase FAO gene expression and FAO in mouse primary hepatocytes. Primary hepatocytes cells were silenced with a shRNA-SIRT4 adenovirus. A, quantitative real time PCR showing that SIRT4 was decreased by shRNA-SIRT4 compared with shRNA-control cells. B–F, mouse primary hepatocytes were transduced with control or shRNA-SIRT4 adenovirus. Cells were harvested after 48 h. RNA was extracted and used to measure the indicated gene expression using quantitative real time PCR analysis. G, FAO in control and SIRT4 knockdown cells was measured. Values represent the mean of quadruplicate samples. Error bars represent S.E. Statistical analyses were performed using analysis of variance. *, p < 0.05.
SIRT4 Knockdown Increases Fatty Acid Oxidation in Primary Hepatocytes
We determined whether induction of FAO genes would lead to increase fatty acid oxidation in the hepatocytes. Cellular FAO rates were measured in primary hepatocytes either transduced with the shRNA-SIRT4, the scramble shRNA-control, or the LacZ-shRNA (control) at 48 h post-transduction. We observed a significant increase in FAO in cells where SIRT4 was knocked down compared with the control cells (Fig. 1G).
SIRT4 Knockdown Increases Mitochondrial Gene Expression in Primary Mouse Hepatocytes
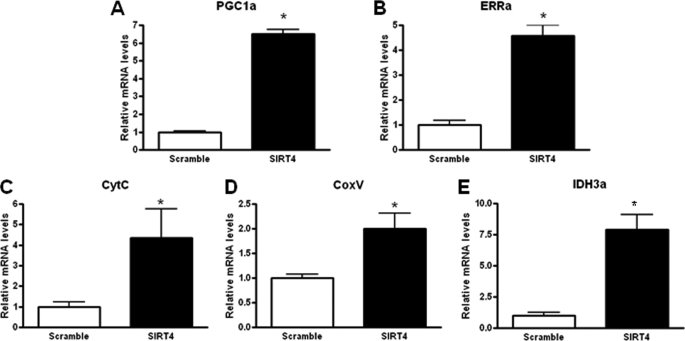
Primary mouse hepatocytes were transduced with the shRNA-SIRT4 or a shRNA-control for 48 h. RNA was then extracted, and the expression levels of several key mitochondrial enzymes were analyzed, including PGC1α, ERRα (estrogen-related receptor α), cytochrome c, CoxV, and isocitrate dehydrogenase in SIRT4 knockdown primary hepatocytes (Fig. 2, A–E). These findings suggest SIRT4 negatively regulates FAO through reducing expression of mitochondrial and fatty acid oxidation genes.
FIGURE 2.
SIRT4 knockdown increases mitochondrial gene expression in primary hepatocytes. A–E, mouse primary hepatocytes were transduced with control or shRNA-SIRT4 adenovirus. Cells were harvested after 48 h. FAO was measured, and RNA was extracted and used to measure the indicated gene expression using quantitative PCR analysis. Values represent the mean of quadruple samples. Error bar represent S.E. Statistical analyses were performed using analysis of variance. *, p ≤ 0.005.
SIRT4 Regulates Fatty Acid Oxidation through Regulation of SIRT1 Expression in Mouse Primary Hepatocytes
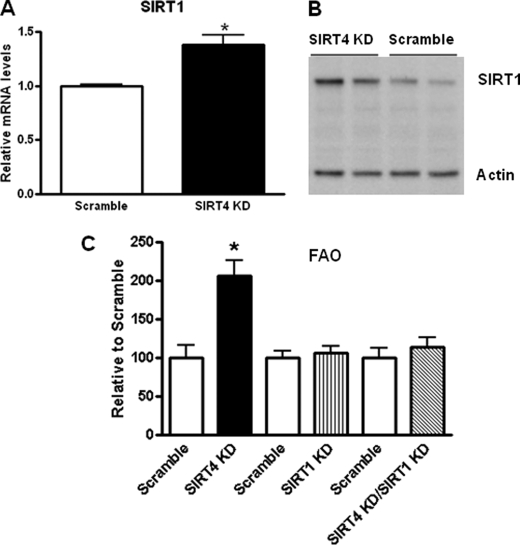
To investigate the mechanism by which SIRT4 regulates FAO, we again transduced hepatocytes with the -SIRT4 shRNA or a shRNA control for 48 h. We observed a greater than 1.4-fold increase in SIRT1 mRNA levels (Fig. 3A). Consistent with SIRT1 mRNA expression, protein levels of SIRT1 were also increased in SIRT4 knockdown hepatocytes (Fig. 3B). Together this data suggest that SIRT4 negatively regulates SIRT1 in hepatocytes. To address if the increase in FAO upon SIRT4 knockdown was dependent on SIRT1, we knocked down both SIRT4 and SIRT1 in mouse primary hepatocytes and measured FAO (Fig. 3C). As expected, SIRT4 knockdown led to a 2-fold increase in FAO, whereas no significant changes were observed when SIRT1 was knocked down. However, in the SIRT4/SIRT1 double knockdown hepatocytes, we observed a blunted increase in FAO compared with SIRT4 knockdown alone. These data suggest that SIRT1 is necessary for the effect of SIRT4 in modulating FAO in primary hepatocytes.
FIGURE 3.
SIRT4 knockdown increases SIRT1 levels and activity. A, quantitative real time PCR shows SIRT1 was induced by shRNA-SIRT4 compared with shRNA-control cells. B, immunoblot of SIRT1 and actin (loading control) in cells that were silenced using a shRNA-SIRT4 adenovirus is shown. KD, kinase dead. C, mouse primary hepatocytes were transduced with control of shRNA-SIRT4 and/or shRNA SIRT1 adenovirus. Cells were harvested 48 h later. FAO was. Values represent the mean of quadruple samples. Error bars represent S.E. Statistical analyses were performed using analysis of variance. *, p ≤ 0.005. FAO was measured as described under “Experimental Procedures.”
In Vivo Hepatic Knockdown of SIRT4 Using an shRNA Adenovirus
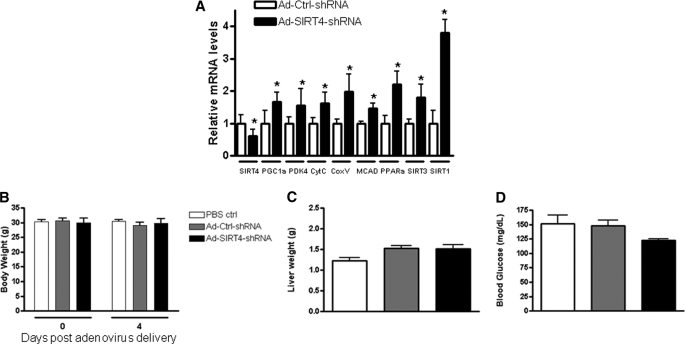
To examine the function of SIRT4 in the intact liver, an shRNA adenovirus targeting SIRT4 was injected into the tail vein of C57BL/6 mice. Four days after administration of the virus, the mice were sacrificed, and liver and blood were collected. Hepatic SIRT4 gene expression was reduced by 50% compared with control, and consistent with data from hepatocytes, the expression of key genes that regulate mitochondrial function and fatty acid oxidation were increased significantly (Fig. 4A). Interestingly, both SIRT1 and SIRT3 were up-regulated about 4- and 2-fold, respectively. To assess liver function, alanine aminotransferase and aspartate aminotransferase were measured, and no difference was observed compared with scramble controls (data not shown). Body weight (Fig. 4B) and liver weight (Fig. 4C) were similar to controls, but a slight decrease in blood glucose (Fig. 4D) was observed. Taken together with the data from hepatocytes, these results suggest a role for SIRT4 in regulating hepatic fat metabolism.
FIGURE 4.
SIRT4 knockdown increases fatty acid oxidation genes in mouse liver. Mice were infected with shRNA-control or shRNA-SIRT4 adenovirus. Animals were sacrificed 4 days after adenovirus injection. Liver RNA was extracted and used to measure the indicated gene expression using quantitative real time PCR analysis (A), body weight (B), liver weight (C), and blood glucose (D). Data are presented as mean ± S.E. n = 5/group. Statistical analyses were performed using Student's t test. *, p ≤ 0.05.
SIRT4 Knockdown Increases Fatty Acid oxidation, Gene Expression, and Oxygen Consumption in Primary Mouse Myotubes
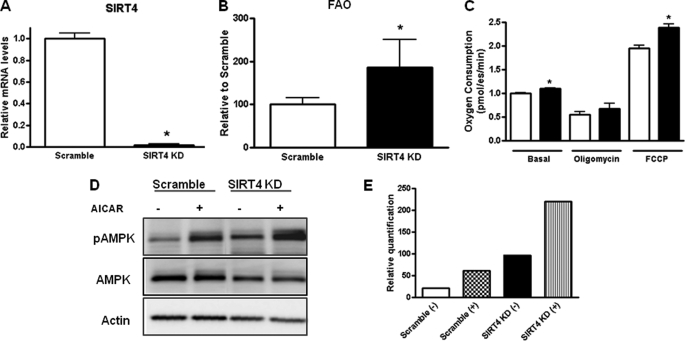
Next, we investigated the role of SIRT4 in regulating oxidative metabolism in muscle cells. Primary mouse myotubes were transduced with the SIRT4-shRNA or the control adenovirus for 48 h. Total RNA was extracted and subjected to quantitative real time PCR analysis. The expression level of SIRT4 was markedly reduced (95%) by the adenoviral shRNA-SIRT4 (Fig. 5A). We then assessed the effect of SIRT4 knockdown on fatty acid oxidation and mitochondrial function in these cells. Fatty acid oxidation rates were increased 90% in the SIRT4 knockdown cells over the controls (Fig. 5B). In addition, SIRT4 knockdown in the primary mouse myotubes significantly enhanced the basal and maximum (carbonyl cyanide p-trifluoromethoxyphenylhydrazone (FCCP)) cellular respiration rates (Fig. 5C). The uncoupling respiration (oligomycin), however, was not altered by SIRT4 knockdown (Fig. 5C). To further investigate the role of SIRT4 in myotubes, we evaluated the phosphorylation status of AMPK upon knockdown of SIRT4. We observed an increase in basal and 5-aminoimidazole-4-carboxamide ribonucleoside-stimulated pAMPK levels when SIRT4 was knocked down in primary myotubes (Fig. 5, D and E). Consistent with the effects in hepatocytes, these studies suggest that SIRT4 is a negative regulator of fat oxidation and overall mitochondrial oxidative metabolism.
FIGURE 5.
SIRT4 knockdown increases FAO, oxygen consumption, and pAMPK in mouse primary myotubes. Myotubes were transduced with an shRNA-SIRT4 adenovirus or a scramble shRNA-control adenovirus for 48 h. A, total RNA was extracted, and the mRNA levels of SIRT4 were determined by quantitative real time-PCR. B, fatty acid oxidation rates were measured. C, cellular oxygen consumption rates were determined by Seahorse XF-24. Values represent the means of quadruplicate samples in B and C. Error bars represent S.E. Statistical analyses were performed using analysis of variance. *, p < 0.05. D, SIRT4 was knocked down in primary myotubes, and the levels of pAMPK were measured by Western blot. pAMPK was measured under basal and 5-aminoimidazole-4-carboxamide ribonucleoside (AICAR)-stimulated conditions. E, quantification of experiment is shown in D.
The Sirt4 Gene Is Regulated in Diabetic Mouse Strains
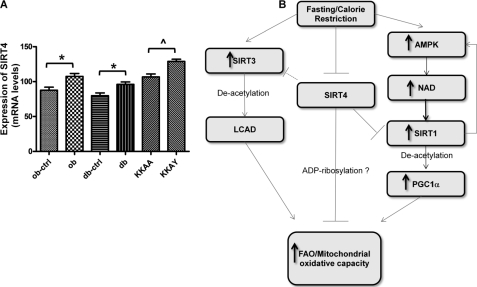
Based on our data from hepatocytes and liver, we hypothesized that Sirt4 gene expression would be altered in the liver of mouse models with diabetes and hepatic steatosis. Indeed, Sirt4 mRNA levels were significantly increased in ob/ob, db/db, and KKAy strains (Fig. 6A). Therefore, increased hepatic SIRT4 levels may contribute to the disease phenotype of these diabetic mouse models.
FIGURE 6.
A, the average gene expression of SIRT4 in liver tissue of three diabetes mouse models versus their corresponding background controls is shown. The probe set used for SIRT4 is 1426847_at. The error bars indicate the S.E. for each group. B, shown is schematic representation of the possible mechanisms by which SIRT4 regulates FAO. LCAD, long chain acyl-CoA dehydrogenase.
DISCUSSION
Sir2 is an NAD-dependent deacetylase that links metabolism with longevity in yeast, flies, and worms. Mammals have seven Sir2 orthologs (SIRT1–7) (3). SIRT4 is a mitochondrial enzyme that has been reported to use NAD to ADP-ribosylate and down-regulate glutamate dehydrogenase activity (5, 6). However, a recent study has called into question whether this purported ADP-ribosyltransferase activity of the sirtuins is physiologically relevant (8). Regardless of the precise mechanism, there is compelling evidence that SIRT4 is an important metabolic regulator via its effects on insulin secretion in beta cells (6). However, the metabolic functions of SIRT4 in other peripheral tissues are not well understood.
In this manuscript we present our studies testing the hypothesis that SIRT4 functions in mitochondrial oxidative metabolism. Several conclusions can be drawn from our studies. First, we observed that shRNA-mediated suppression of SIRT4 levels in both primary hepatocytes and intact liver was associated with the enhanced expression of genes that control fatty acid oxidation and mitochondrial oxidative capacity and that these changes in gene expression correlated with increased FAO in primary hepatocytes. Loss of SIRT4 activity in primary hepatocytes and intact liver led to increased expression of SIRT1 and SIRT3. When we prevented the increase SIRT1 in SIRT4-deficient cells, FAO was no longer enhanced, indicating that SIRT1 is required for the enhanced oxidative capacity of SIRT4 deficiency. We also show that loss of SIRT4 in myotubes is associated with increased AMPK, FAO, and oxygen consumption, suggesting SIRT4 contributes to the regulation of mitochondrial oxidative metabolism in multiple cell types. Taken together, these results suggest that SIRT4 is a negative regulator of oxidative metabolism, which is in stark contrast to the functions of SIRT1 and SIRT3, which enhance the oxidative capacity of tissues.
Another major finding from these studies is that our data support a functional interplay among the SIRTs to coordinate the flow of energy during a given metabolic state. We show that the increase FAO in response to loss of SIRT4 function was associated with increased SIRT1 and SIRT3 expression and that the enhanced expression of SIRT1 was required for the increased FAO in primary hepatocytes. Interestingly similar patterns of SIRT expression are observed in states of high metabolic demand, such as fasting, calorie restriction, or exercise. For example, fasting and/or calorie restriction is associated with increased expression of hepatic SIRT1 and SIRT3, whereas SIRT4 expression is repressed. Thus, SIRTs appear to be nodes in a network designed to integrate metabolic signals and effectively control the production and utilization of energy via enhanced fatty acid oxidation and mitochondrial oxidative capacity. The exact mechanism in which SIRT4 regulates lipid metabolism is not known. One possibility is that SIRT4 directly ribosylates and inhibits a critical enzyme in the fatty acid oxidation pathway analogous to the regulation of glutamate dehydrogenase by SIRT4 (Fig. 6B). Loss of SIRT4 function would then be expected to result in increased fatty acid oxidation. Whether SIRTs serve as physiologically relevant ADP ribosyltransferases has been recently challenged. Du et al. (8) find that SIRT-dependent ADP-ribosylation is orders of magnitude less efficient than a bacterial ADP-ribosyltransferase. Nonetheless, precedent for NAD-dependent modification of mitochondrial β-oxidation proteins was recently reported. SIRT3 was demonstrated to directly stimulate fatty acid oxidation in the liver by catalyzing the NAD-dependent deacetylation of long chain acyl-CoA dehydrogenase (LCAD) resulting in the activation of the enzyme (21). Interestingly, SIRT3 was previously shown to deacetylate glutamate dehydrogenase (9), which is believed to activate enzyme as chemical acetylation of the protein has been shown to inhibit its activity in vitro (10, 11). This begs the questions of whether SIRT3 and SIRT4 reciprocally regulate the same factors given the current metabolic demand of the cell, where SIRT3 activates and SIRT4 inhibits the catabolic enzymes involved in energy production.
Another potential mechanism for the regulation of fat oxidation by SIRT4 is modulation of the AMPK-SIRT1 pathway. In this study we identified an increase in SIRT1 mRNA and protein levels in response to SIRT4 knockdown (Fig. 3, A and B). How a primary change in a mitochondrial SIRT4 affects the expression of nuclear SIRT1 is unknown but could be related to alterations in NAD/NADH ratios, AMP/ATP ratios, or perhaps even generation of PPARα ligands. These types of changes in cellular metabolites could be expected to be generated in mitochondria by alterations of fatty acid metabolism and diffuse into the nucleus.
SIRT1 is a positive regulator of both PPARα and PGC1α transcriptional activity in the liver (12–14). These are two key mediators of the hepatic response to fasting that increase expression of genes involved in β-oxidation leading to increased FAO. Liver-specific deletion of SIRT1 impairs the hepatic response to fasting by inhibiting induction of PPARα target genes resulting in blunted FAO compared with wild-type controls (15). Conversely, overexpression of SIRT1 in the liver induces PPARα target genes (CPT1 and MCAD), and SIRT1 transgenic mice show protection from diet-induced hepatic steatosis (16). These findings support the concept that increased SIRT1 levels in response to SIRT4 knockdown play a role in the observed increase in FAO. The increase in SIRT1 levels observed in myotubes might also explain the increase in FAO observed with SIRT4 knockdown. SIRT1 deacetylases PGC1α in muscle cells and mediates the switch from using glucose to free fatty acids during periods of nutrient limitation, such as fasting or exercise (12, 14). SIRT1 knock-out mouse embryonic fibroblasts (MEFs) have decreased expression of mitochondrial and fatty acid oxidation genes (12). Our studies demonstrated increased AMPK activity in response to SIRT4 knockdown (Fig. 5, D and E). Activation of AMPK increases NAD levels (17, 18), thereby promoting deacetylation/activation of the SIRT1 targets such as PGC-1α and FOXO proteins (Fig. 6B) (17). Thereby, SIRT1 and AMPK regulate the switch to mitochondrial oxidation of fatty acids in response to nutrient limitation. Alternatively, SIRT1 has been shown to regulate AMPK in controlling hepatic lipid metabolism (19, 20). In particular, SIRT1-mediated activation of AMPK (via deacetylation of LKB1) increases acetyl-CoA carboxylase (ACC) phosphorylation which results in increased FAO. In this study we identify a novel role for SIRT4 in the regulation of fatty acid oxidation. SIRT4 may function upstream of AMPK and SIRT1 and play an important role in energy metabolism. Taken together, these findings suggest that SIRT4 inhibition may improve hepatic insulin sensitivity via increased fat oxidative capacity and, hence, may be beneficial for the treatment of type 2 diabetes.
Acknowledgments
We thank Soo-Hee Park for technical assistance, Ling Qiu and Hong Chen for the microarray data, and Bryan Laffitte and Susan C. Stevenson for critical reading of the manuscript.
Footnotes
- SIRT
- sirtuin
- FAO
- fatty acid oxidation
- vp/ml
- viral particles/mt
- AMPK
- AMP-activated protein kinase
- PPAR
- peroxisome proliferator-activated receptor
- PGC1α
- PPARγ coactivator1α.
REFERENCES
- 1.Guarente L. (2007) Cold Spring Harb. Symp. Quant. Biol. 72, 483–488 [DOI] [PubMed] [Google Scholar]
- 2.Haigis M. C., Sinclair D. A. (2010) Annu. Rev. Pathol. 5, 253–295 [DOI] [PMC free article] [PubMed] [Google Scholar]
- 3.Frye R. A. (1999) Biochem. Biophys. Res. Commun. 260, 273–279 [DOI] [PubMed] [Google Scholar]
- 4.Michan S., Sinclair D. (2007) Biochem. J. 404, 1–13 [DOI] [PMC free article] [PubMed] [Google Scholar]
- 5.Haigis M. C., Mostoslavsky R., Haigis K. M., Fahie K., Christodoulou D. C., Murphy A. J., Valenzuela D. M., Yancopoulos G. D., Karow M., Blander G., Wolberger C., Prolla T. A., Weindruch R., Alt F. W., Guarente L. (2006) Cell 126, 941–954 [DOI] [PubMed] [Google Scholar]
- 6.Ahuja N., Schwer B., Carobbio S., Waltregny D., North B. J., Castronovo V., Maechler P., Verdin E. (2007) J. Biol. Chem. 282, 33583–33592 [DOI] [PubMed] [Google Scholar]
- 7.Wu Z., Huang X., Feng Y., Handschin C., Feng Y., Gullicksen P. S., Bare O., Labow M., Spiegelman B., Stevenson S. C. (2006) Proc. Natl. Acad. Sci. U.S.A. 103, 14379–14384 [DOI] [PMC free article] [PubMed] [Google Scholar]
- 8.Du J., Jiang H., Lin H. (2009) Biochemistry 48, 2878–2890 [DOI] [PubMed] [Google Scholar]
- 9.Lombard D. B., Alt F. W., Cheng H. L., Bunkenborg J., Streeper R. S., Mostoslavsky R., Kim J., Yancopoulos G., Valenzuela D., Murphy A., Yang Y., Chen Y., Hirschey M. D., Bronson R. T., Haigis M., Guarente L. P., Farese R. V., Jr., Weissman S., Verdin E., Schwer B. (2007) Mol. Cell. Biol. 27, 8807–8814 [DOI] [PMC free article] [PubMed] [Google Scholar]
- 10.Colman R. F., Frieden C. (1966) J. Biol. Chem. 241, 3661–3670 [PubMed] [Google Scholar]
- 11.Colman R. F., Frieden C. (1966) J. Biol. Chem. 241, 3652–3660 [PubMed] [Google Scholar]
- 12.Gerhart-Hines Z., Rodgers J. T., Bare O., Lerin C., Kim S. H., Mostoslavsky R., Alt F. W., Wu Z., Puigserver P. (2007) EMBO J. 26, 1913–1923 [DOI] [PMC free article] [PubMed] [Google Scholar]
- 13.Nemoto S., Fergusson M. M., Finkel T. (2005) J. Biol. Chem. 280, 16456–16460 [DOI] [PubMed] [Google Scholar]
- 14.Rodgers J. T., Lerin C., Haas W., Gygi S. P., Spiegelman B. M., Puigserver P. (2005) Nature 434, 113–118 [DOI] [PubMed] [Google Scholar]
- 15.Rodgers J. T., Puigserver P. (2007) Proc. Natl. Acad. Sci. U.S.A. 104, 12861–12866 [DOI] [PMC free article] [PubMed] [Google Scholar]
- 16.Purushotham A., Schug T. T., Xu Q., Surapureddi S., Guo X., Li X. (2009) Cell Metab. 9, 327–338 [DOI] [PMC free article] [PubMed] [Google Scholar]
- 17.Cantó C., Gerhart-Hines Z., Feige J. N., Lagouge M., Noriega L., Milne J. C., Elliott P. J., Puigserver P., Auwerx J. (2009) Nature 458, 1056–1060 [DOI] [PMC free article] [PubMed] [Google Scholar]
- 18.Fulco M., Cen Y., Zhao P., Hoffman E. P., McBurney M. W., Sauve A. A., Sartorelli V. (2008) Dev. Cell 14, 661–673 [DOI] [PMC free article] [PubMed] [Google Scholar]
- 19.Lan F., Cacicedo J. M., Ruderman N., Ido Y. (2008) J. Biol. Chem. 283, 27268–27635 [DOI] [PMC free article] [PubMed] [Google Scholar]
- 20.Hou X., Xu S., Maitland-Toolan K. A., Sato K., Jiang B., Ido Y., Lan F., Walsh K., Wierzbicki M., Verbeuren T. J., Cohen R. A., Zang M. (2008) J. Biol. Chem. 283, 20015–20026 [DOI] [PMC free article] [PubMed] [Google Scholar]
- 21.Hirschey M. D., Shimazu T., Goetzman E., Jing E., Schwer B., Lombard D. B., Grueter C. A., Harris C., Biddinger S., Ilkayeva O. R., Stevens R. D., Li Y., Saha A. K., Ruderman N. B., Bain J. R., Newgard C. B., Farese R. V., Jr., Alt F. W., Kahn C. R., Verdin E. (2010) Nature 464, 121–125 [DOI] [PMC free article] [PubMed] [Google Scholar]


