Abstract
ZIP14 is a transmembrane metal ion transporter that is abundantly expressed in the liver, heart, and pancreas. Previous studies of HEK 293 cells and the hepatocyte cell lines AML12 and HepG2 established that ZIP14 mediates the uptake of non-transferrin-bound iron, a form of iron that appears in the plasma during pathologic iron overload. In this study we investigated the role of ZIP14 in the cellular assimilation of iron from transferrin, the circulating plasma protein that normally delivers iron to cells by receptor-mediated endocytosis. We also determined the subcellular localization of ZIP14 in HepG2 cells. We found that overexpression of ZIP14 in HEK 293T cells increased the assimilation of iron from transferrin without increasing levels of transferrin receptor 1 or the uptake of transferrin. To allow for highly specific and sensitive detection of endogenous ZIP14 in HepG2 cells, we used a targeted knock-in approach to generate a cell line expressing a FLAG-tagged ZIP14 allele. Confocal microscopic analysis of these cells detected ZIP14 at the plasma membrane and in endosomes containing internalized transferrin. HepG2 cells in which endogenous ZIP14 was suppressed by siRNA assimilated 50% less iron from transferrin compared with controls. The uptake of transferrin, however, was unaffected. We also found that ZIP14 can mediate the transport of iron at pH 6.5, the pH at which iron dissociates from transferrin within the endosome. These results suggest that endosomal ZIP14 participates in the cellular assimilation of iron from transferrin, thus identifying a potentially new role for ZIP14 in iron metabolism.
Keywords: Cell Surface Protein, Endocytosis, Hepatocyte, Iron, Iron Metabolism, Hemochromatosis, Transferrin, Transferrin Receptor
Introduction
Most cells acquire iron from transferrin (TF),2 a circulating plasma protein that can carry up to two ferric (Fe3+) iron atoms. After Fe-TF binds to cell surface TF receptor 1 (TFR1), the plasma membrane invaginates into clathrin-coated pits, which internalize the Fe-TF·TFR1 complex into endosomes. Upon endosomal acidification, Fe3+ is released and subsequently reduced to Fe2+. The liberated Fe2+ is then transported across the endosomal membrane and into the cytosol (1).
The assimilation of iron from TF has been best characterized in developing erythroid cells, the most avid consumers of TF-bound iron (TBI). In these cells, reduction of Fe3+ is catalyzed by the oxidoreductase Steap3 (2), and iron transport out of the endosome is facilitated by the transmembrane protein divalent metal transporter 1 (DMT1) (3, 4). Accordingly, mice lacking either Steap3 or DMT1 cannot incorporate sufficient iron into developing erythrocytes and become anemic (2, 3). After the erythroid marrow, the second largest consumer of TBI is the liver, accounting for 10–20% of iron exchange with the plasma (5). Interestingly, anemic Steap3-mutant mice or DMT1-null mice are able to take up iron into the liver (6, 7), indicating that Steap3 and DMT1 are dispensable for hepatic iron uptake.
Under normal conditions, >95% of plasma iron is TBI. Studies in perfused rat liver document that the liver takes up TBI, almost exclusively into hepatocytes (8). In iron overload conditions, such as hereditary hemochromatosis, the liver can also take up non-TF-bound iron (NTBI), a form of iron that appears in the plasma when the iron-carrying capacity of TF becomes exceeded (9). The uptake of NTBI into hepatocyte cell lines is mediated, at least in part, by the transmembrane protein ZIP14, a member of the ZIP family of metal ion transporters (10, 11). Recently, we found that expression of HFE, the hemochromatosis protein, in HepG2 cells decreased ZIP14 levels, apparently by decreasing ZIP14 stability (10). Importantly, the reduction in ZIP14 was associated with not only a diminished uptake of NTBI but also a decrease in the assimilation of iron from TF, suggesting that ZIP14 participates in both pathways of iron acquisition. In the present study, we investigated the role of ZIP14 in the cellular assimilation of iron from TF, the pH dependence of ZIP14-mediated iron uptake, and the subcellular localization of endogenous ZIP14. We found that overexpression of ZIP14 increased the assimilation of iron from TF and enhanced cellular iron uptake at pH 7.5 and 6.5. Endogenous ZIP14 in HepG2 cells localized to the plasma membrane and partially co-localized with endosomes containing internalized Fe-TF. Moreover, siRNA-mediated knockdown of endogenous ZIP14 decreased the assimilation of iron from TF without decreasing the uptake of TF or the levels of TFR1. These results suggest that ZIP14 participates in the assimilation of iron from TF in addition to playing a role in NTBI uptake.
EXPERIMENTAL PROCEDURES
Cell Culture
HEK 293T cells were grown in Dulbecco's modified Eagle's medium (DMEM; Mediatech) with 4.5 g/liter glucose, 4 mm l-glutamine, 1 mm sodium pyruvate, 100 units/ml penicillin, 100 μg/ml streptomycin, and 10% fetal bovine serum (FBS; Atlanta Biologicals). HepG2 cells were grown in DMEM with 4.5 g/liter glucose, 4 mm l-glutamine, 1 mm sodium pyruvate, 1× minimum Eagle's medium nonessential amino acids (Mediatech), 100 units/ml penicillin, 100 μg/ml streptomycin, and 10% FBS. All cells were maintained at 37 °C in 5% CO2. See also supplemental Experimental Procedures. For expression of mouse ZIP14 in HEK 293T cells, Effectene reagent (Qiagen) was used to transiently transfect HEK 293T cells with empty pCMVSport2 or pCMVSport6 containing mouse ZIP14 cDNA (GenBankTM accession number BC021530).
Measurement of Assimilation of Iron from TF
59Fe-TF was prepared by saturating human apo-TF (Sigma) with 59Fe-ferric nitrilotriacetic acid. After incubating for 1 h in PBS containing 10 mm NaHCO3, unbound iron was removed by repeated washing through a Centricon centrifugal filter (MWCO 30,000; Millipore). Cells were washed twice with serum-free DMEM medium (SFM) and incubated at 37 °C for 60 min to deplete TF from cells. Cells were then incubated in SFM containing 100 nm 59Fe-TF, 20 mm Hepes (pH 7.4) and 2 mg/ml ovalbumin. To stop uptake, cells were placed on ice, and externally bound 59Fe-TF was stripped with an acidic buffer (0.2 n acetic acid, 500 mm NaCl, 1 mm FeCl3) for 3 min. After washing suspended cells twice in cold SFM, cells were lysed in a solution containing 0.2% SDS and 0.2 m NaOH. Cell-associated radioactivity was determined by γ-counting. Protein concentrations of the cell extracts were measured by using the RC DC Protein Assay (Bio-Rad). Assimilation of 59Fe was expressed as cpm/mg of protein.
Measurement of pH-dependent Iron Transport Activity
The pH of the uptake buffer (130 mm NaCl, 10 mm KCl, 1 mm CaCl2 and 1 mm MgSO4) was adjusted from pH 7.5, 6.5, to 5.5 by using mixtures of Hepes and MES buffers (12). Iron transport was measured as previously described (11). Briefly, transfected HEK 293T cells (48 h after transfection) were washed three times in SFM and incubated for 1 h in SFM to deplete cells of TF. For uptake, cells were incubated with 2 μm 59Fe-ferric citrate for 60 min followed by three washes of cell-impermeant iron chelator solution to remove any surface-bound iron. Cell-associated radioactivity was determined by γ-counting. Uptake was expressed as cpm/mg of protein.
Determination of ZIP14 and DMT1 mRNA Copy Numbers
Total RNA was isolated from HepG2 and HEK 293T cells. Isolated RNA was treated with DNase I (Turbo DNA-free kit; Ambion) to remove any contaminating genomic DNA. First-strand cDNA was synthesized from the isolated RNA by using the High-Capacity cDNA Archive kit (Applied Biosystems). Quantitative RT-PCR was performed using iQ SYBR Green Supermix (Bio-Rad) and an Applied Biosystems 7300 real time PCR system. Copy numbers of DMT1 and ZIP14 mRNA were calculated by comparing Ct values obtained from HEK 293T and HepG2 RNA with those obtained from standard curves generated by using the plasmids pBluescriptR-human DMT1 (BC100014; Addgene, Cambridge, MA) and pXL4-human ZIP14 (NM_001135153.1; Open Biosystems). The primers used for ZIP14 (forward, 5′-CTGGACCACATGATTCCTCAG-3′ and reverse, 5′-GAGTAGCGGACACCTTTCAG-3′) and DMT1 (forward, 5′-TGGTTCTGACTCGCTCTATTGC-3′ and reverse, 5′-CATTCATCCCTGTTAGATGCTCTACA-3′) were designed to target all known variants of ZIP14 and DMT1 mRNA.
Genetic Knock-in to Tag Endogenous ZIP14 in HepG2 Cells
The 3×FLAG epitope tagging strategy and method have been described in detail previously (13, 14). Briefly, ∼1 kb of left and right homologous arms of ZIP14 were PCR-amplified from genomic DNA isolated from HepG2 cells. The primers that were used to generate the knock-in amplified regions upstream or downstream of the stop codon (supplemental Table 1). PCR products were inserted into the rAAV-Neo-Lox P-3×FLAG knock-in vector. To make AAV-Cre virus, the cre gene sequence was PCR-amplified from pBS185 plasmid (Addgene) by using gene-specific primers linked with NotI restriction sites at each end (supplemental Table 1). PCR products were then ligated into the pAAV vector (Stratagene). Targeting viruses were packaged into HEK 293-AAV cells by using the AAV Helper-Free system (Stratagene) according to the manufacturer's instructions. HepG2 cells were infected with targeting virus, and G418-resistant single-cell clones were transferred to 24-well plates for screening and expanding. After confirming successful homologous recombination by PCR with screening primers (supplemental Table 1) and DNA sequencing, the positive clones were infected with AAV-Cre virus to remove the neomycin-resistance cassette. Excision was confirmed by PCR with screening primers, and expression of endogenous ZIP14–3×FLAG in HepG2 cells was confirmed by Western blot analysis.
Knockdown of ZIP14 Using siRNA
SMARTpool siRNA specific for human ZIP14 mRNA (GenBankTM accession number NM_015359) and ON-TARGETplus Non-targeting Pool siRNA were purchased from Dharmacon (Thermo Scientific). Lipofectamine RNAiMAX transfection reagent (Invitrogen) was used to transfect siRNA into HepG2 cells. Briefly, 6 μl of Lipofectamine RNAiMAX and 60 pmol of RNAi duplex were mixed in 600 μl of Opti-MEM (Invitrogen) and added into each well of a 6-well plate. After incubating at room temperature for 15 min, ∼2 × 10⁵ cells were added to each well containing 1.8 ml of DMEM supplemented with 4.5 g/liter glucose, 4 mm l-glutamine, 1 mm sodium pyruvate, 1× minimum Eagle's medium nonessential amino acids and 10% FBS. Cells were incubated with the siRNA for 72 h. To confirm knockdown, ZIP14 protein levels were determined by Western blotting. See also supplemental Experimental Procedures.
Western Blot Analysis
Cells were washed with ice-cold phosphate-buffered saline (PBS) twice and lysed in SDS lysis buffer (170 mm Tris-HCl (pH 6.8), 2% SDS, 5% glycerol, 5% β-mercaptoethanol, and 1× Complete Mini Protease Inhibitor Mixture (Roche Applied Biosciences)). Protein concentrations of the cell lysates were measured by using the RC DC Protein Assay. Lysates were mixed with Laemmli buffer and incubated for 15 min at 37 °C. Proteins were separated electrophoretically on an SDS/7.5% polyacrylamide gel, transferred to nitrocellulose, and incubated for 1 h in blocking buffer (5% nonfat dry milk in Tris-buffered saline-Tween 20, TBST). Blots were then incubated for 1 h at room temperature in blocking buffer containing either 2.5 μg/ml affinity-purified rabbit anti-ZIP14 antibody, mouse anti-FLAG, M2 (1:2000; Sigma), mouse anti-TFR1 (1:1000, Invitrogen), mouse anti-TFR2 (1:200, Santa Cruz Biotechnology), or rabbit anti-DMT1 (1:500, Abcam). After four washes with TBST, blots were incubated with a 1:2000 dilution of donkey anti-rabbit (Amersham Biosciences) or goat anti-mouse (Invitrogen) secondary antibodies conjugated to horseradish peroxidase (HRP). To confirm equivalent loading, blots were stripped for 15 min in Restore PLUS Western Blot Stripping Buffer (Thermo Scientific), blocked for 1 h in blocking buffer, and reprobed with rabbit anti-actin (1:1000; Sigma) or mouse anti-α-tubulin, clone B-5-1-2 (Sigma) followed by HRP-conjugated secondary antibodies. After washing twice with TBST and twice with TBS, antibody cross-reactivity was visualized by using enhanced chemiluminescence (SuperSignal West Pico; Thermo Scientific) and x-ray film. See also supplemental Experimental Procedures.
Subcellular Localization of Endogenous ZIP14
HepG2 cells that were grown on poly-l-lysine- (Sigma)-coated coverslips were washed twice with PBS+/+ (PBS with 1 mm MgCl2 and 0.1 mm CaCl2) and fixed with 2% paraformaldehyde for 15 min at room temperature. Next, cells were washed three times with PBS, permeabilized with 0.1% saponin for 10 min, and then washed three times with PBS before blocking in 1% bovine serum albumin for 30 min. Endogenous ZIP14–3×FLAG was detected by using mouse anti-FLAG, M2 (1:200; Sigma) primary antibody (overnight at 4 °C) and rhodamine-conjugated donkey anti-mouse IgG secondary antibody (1:200; Jackson ImmunoResearch) for 1 h. For TF labeling, cells were incubated with 30 μg/ml Alexa Fluor 488-labeled human holo-TF (Invitrogen) for 30 min at 37 °C and washed three times with PBS before fixation. For subcellular localization, the following goat polyclonal antibodies (1:200) from Santa Cruz Biotechnology were used: anti-early endosome antigen 1 (EEA1), anti-Rab11, anti-lysosome-associated membrane protein 1 (LAMP1), and anti-TFR1 (CD-71). The secondary antibody (1:200) was donkey anti-goat IgG Alexa Fluor 488. To stain the nuclei, cells were washed three times with PBS and incubated for 5 min with 10 μg/ml 4′-6-diamidino-2-phenylindole (DAPI). After several washes of PBS, coverslips were mounted on microscope slides for confocal analysis using a Leica TCS SP5 laser-scanning confocal microscope.
Quantitative Determination of TF Uptake
To determine whether ZIP14 knockdown affected the uptake of TF, HepG2 cells in SFM were incubated with 100 nm biotin-labeled holo-TF (Sigma). After incubation, surface binding of TF was stopped by trypsinizing cells for 2 min at 37 °C. After washing suspended cells twice in cold SFM and PBS, cells were lysed in SDS lysis buffer. Cell extracts were analyzed by Western blotting as described above, but with ImmunoPure HRP-conjugated streptavidin (1:50,000 for 1 h) instead of antibodies.
Statistical Analysis
Data represent mean ± S.E. The assimilation of iron at various time points and the pH-dependence of iron uptake data were analyzed as a completely randomized block design using the Glimmix procedures (SAS Institute). Blocks were based on the replication of the experiment. Fixed effect included time and treatment (or treatment and pH) as well as the interactive effects. Block was the random effect. Multiple comparisons were adjusted by Tukey-Kramer. Degrees of freedom were approximated using the Kenward-Rogers method. A probability level of p < 0.05 was defined as a significant difference. When two groups were compared, data were analyzed by unpaired Student's t test (GraphPad Prism, GraphPad Software).
RESULTS
Overexpression of ZIP14 Increases Assimilation of Iron from TF
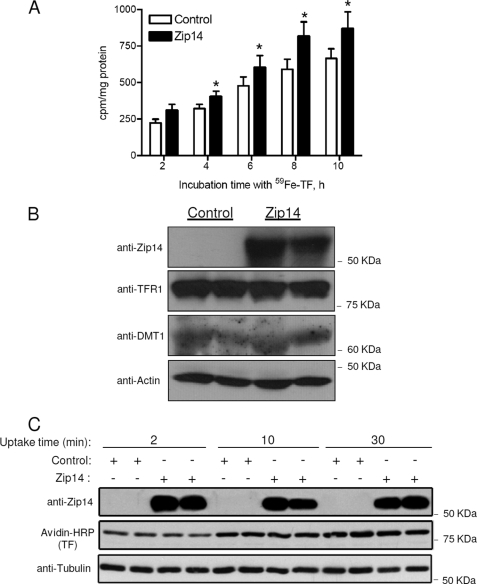
HEK 293T cells, an easily transfectable cell line, were used to investigate the effect of ZIP14 overexpression on the assimilation of iron from TF. Forty-eight hours after transfection with pCMVSport2 (control) or pCMVSport6/mouse ZIP14, cells were incubated with 100 nm 59Fe-TF for 2, 4, 6, 8, or 10 h, and the cellular assimilation of 59Fe was determined. We found that HEK 293T cells transfected with mouse ZIP14 took up 26–38% more 59Fe than control cells (Fig. 1A). Western blot analysis confirmed that the enhanced assimilation of 59Fe was associated with higher ZIP14 protein levels (Fig. 1B). In contrast, levels of TFR1 and DMT1, which may also function in the assimilation of iron from TF, did not differ between ZIP14-overexpressing cells and controls (Fig. 1B). To determine whether overexpression of ZIP14 increased the uptake of TF, we measured TF uptake at 2, 10, and 30 min. These shorter time points were used because of the rapid rate of internalization of TF (t½ = 3.5 min) in HepG2 cells (15). We found that overexpression of ZIP14 did not affect the amount of holo-TF taken up by the cells (Fig. 1C). The enhancement of iron assimilation by ZIP14-transfected cells suggests that ZIP14 plays a role in the assimilation of iron from TF.
FIGURE 1.
Overexpression of ZIP14 increases the cellular assimilation of iron from TF. A, HEK 293T cells transfected with pCMVSport2 (control) or pCMVSport6/mouse ZIP14 were incubated with 100 nm 59Fe-TF for the times indicated. Cells were harvested, and cell-associated radioactivity was determined by γ-counting. The amount of 59Fe assimilated by the cells is expressed as cpm/mg of protein. *, different from respective control, p < 0.05. The data shown represent the mean ± S.E. (error bars) of three independent experiments. B, lysates of cells incubated with 100 nm 59Fe-TF for 4 h were analyzed by Western blotting for ZIP14, TFR1, and DMT1. To indicate protein loading among lanes, the blot was stripped and reprobed for actin. Data are representative of one of three experiments. C, HEK 293T cells transfected with pCMVSport2 (control) or pCMVSport6/mouse ZIP14 were incubated with 100 nm biotin-labeled holo-TF for 2, 10, or 30 min. Cell lysates were analyzed by Western blotting for ZIP14, TF, and tubulin as a lane-loading control. Data are representative of one of two experiments.
pH-dependent Iron Transport Activity of ZIP14
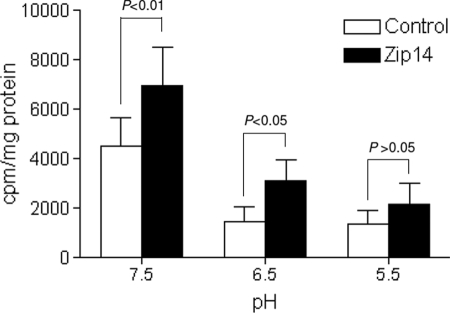
If ZIP14 is responsible for the transport of iron released from TF, then it would have to be able to transport iron out of acidified endosomal vesicles. To determine the pH dependence of ZIP14-mediated iron transport, we transfected HEK 293T cells with mouse ZIP14 or empty vector and measured the uptake of 59Fe-ferric citrate by cells incubated in medium at pH 7.5, 6.5, or 5.5. We found that cells overexpressing ZIP14 took up more iron than controls at pH 7.5 and 6.5, but not at 5.5 (Fig. 2). Even though the efficiency of transport was lower at pH 6.5 than at 7.5, these results imply that ZIP14 is capable of transporting iron at the acidic pH of the endosome.
FIGURE 2.
pH dependence of ZIP14-mediated iron transport. HEK 293T cells transfected with pCMVSport2 (control) or pCMVSport6/mouse ZIP14 were incubated with 2 μm 59Fe-ferric citrate for 1 h in uptake buffer at pH 7.5, 6.5, and 5.5. The amount of 59Fe taken up by cells is expressed as cpm/mg of protein. Data represent the mean ± S.E. (error bars) of three independent experiments.
ZIP14 and DMT1 mRNA Copy Numbers in HepG2 and HEK 293T Cells
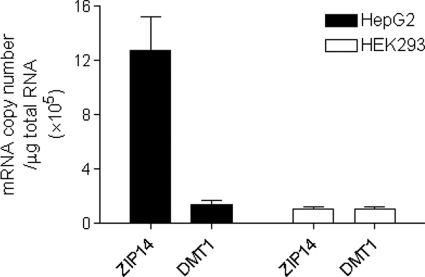
ZIP14 is most abundantly expressed in the liver (16, 17), a major organ of iron metabolism. We recently reported that ZIP14 mRNA levels (relative to GAPDH mRNA) were ∼6-fold higher than DMT1 mRNA levels in HepG2 cells (10), a human hepatoma cell line (18). Here, we measured absolute mRNA copy numbers of ZIP14 in HepG2 and HEK 293T cells and compared them with DMT1 mRNA copy numbers. In HepG2 cells, ZIP14 mRNA copy numbers were found to be 10-fold greater than DMT1 copy numbers (Fig. 3). Moreover, ZIP14 transcript levels in HepG2 cells were found to be 11-fold greater than in HEK 293T cells. Likewise, in human tissues ZIP14 is much more abundantly expressed in liver than in kidney (17). The high expression level of ZIP14 in liver and HepG2 cells suggests that ZIP14 plays an important role in hepatocytes.
FIGURE 3.
Comparison of ZIP14 and DMT1 mRNA levels in HepG2 and HEK 293T cells. Total RNA was isolated from untreated HepG2 and HEK 293T cells, and transcript copy numbers were determined by using quantitative RT-PCR. Data represent the mean ± S.E. (error bars) of three independent experiments of triplicate samples.
Epitope Tagging of Human Endogenous ZIP14 in HepG2 Cells
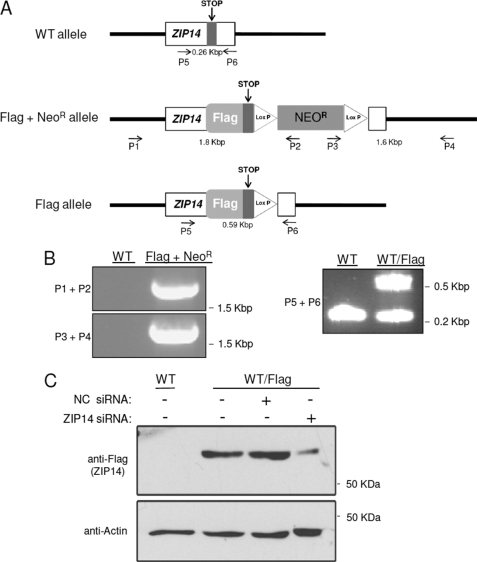
To investigate the role and subcellular localization of ZIP14 in HepG2 cells, we first generated a cell line that expresses FLAG-tagged ZIP14 from its endogenous locus. The addition of a FLAG tag to ZIP14 allows for highly specific and sensitive detection of the endogenous protein by the mouse anti-FLAG M2 monoclonal antibody. This strategy was used because we do not have an antibody suitable for immunofluorescence analysis of ZIP14 in human cells. FLAG tag-encoding DNA was knocked into the endogenous ZIP14 locus by homologous recombination (Fig. 4A). Correctly targeted neomycin-resistant (NeoR) clones were identified by genomic PCR. Primers used for the knock-in and screening are shown in supplemental Table 1. Screening primers were designed to regions of the FLAG + NeoR allele predicted to be ∼1.8 kbp (P1 + P2) and ∼1.6 kbp (P3 + P4). Fig. 4B shows the PCR identification of a correctly targeted clone. DNA sequencing of the PCR products confirmed correct knock-in of the flag epitope at the C terminus and insertion of the NeoR gene. Excision of the NeoR gene and identification of a FLAG allele were confirmed by PCR using primers (P5 + P6) (Fig. 4B) and by DNA sequencing. Western blot analysis using anti-FLAG antibody revealed translation of a FLAG-tagged protein (Fig. 4C). The FLAG-immunoreactive band was detected between ∼55 and 60 kDa, consistent with the calculated molecular mass of ZIP14 (54 kDa) plus the 3×FLAG (∼ 3 kDa). Moreover, the FLAG-immunoreactive band could be knocked down by using siRNA targeting ZIP14, thus confirming the band as ZIP14 (Fig. 4C).
FIGURE 4.
Targeted knock-in of 3×FLAG into the ZIP14 locus of HepG2 cells. A, diagrams of the wild-type (WT) ZIP14 allele, the FLAG + NeoR allele after homologous recombination with the targeting vector, and the FLAG allele after excising the neomycin cassette with Cre recombinase are shown. Clones were screened by using primers P1–P6 designed to target the indicated positions. B, PCR of genomic DNA identifies clones with the FLAG + NeoR allele and FLAG allele. C, Western blot analysis of HepG2 cells expressing FLAG-tagged ZIP14 and knockdown of endogenous ZIP14 in HepG2 cells using siRNA targeting ZIP14 are shown. To indicate protein loading among lanes, the blot was stripped and reprobed for actin.
Subcellular Localization of ZIP14 in HepG2 Cells
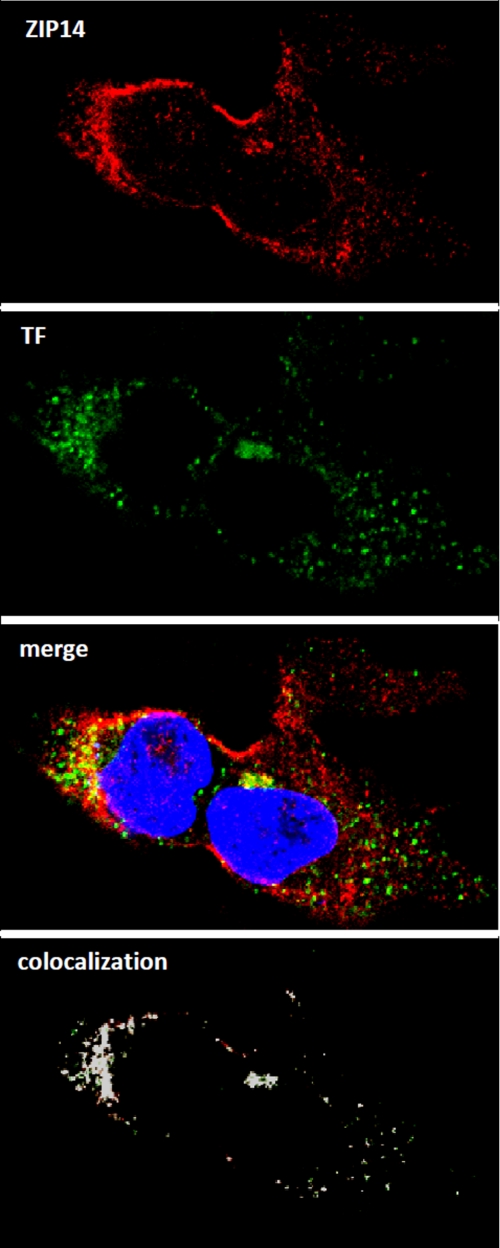
Previous immunofluorescence studies in primary mouse hepatocytes detected ZIP14 at the plasma membrane of nonpermeabilized cells (19). Here, we used immunofluorescence analysis of HepG2 cells expressing endogenous ZIP14–3×FLAG to investigate further the subcellular localization of ZIP14 (Fig. 5). In permeabilized HepG2 cells, we detected ZIP14–3×FLAG in intracellular puncta as well as on the plasma membrane. The specificity of the anti-FLAG antibody was confirmed by the absence of immunofluorescent staining in permeabilized wild-type HepG2 cells (data not shown). To determine whether intracellular ZIP14 co-localized with internalized TF, we used Alexa Fluor 488-labeled human holo-TF, which is endocytosed by the cells. As shown in Fig. 5, ZIP14 and the labeled TF partially co-localize in the cytosol. A co-localization rate of 56% between ZIP14 and TF was calculated by using the co-localization algorithm provided with the Leica LSM SP5 software. The presence of ZIP14 in TF-positive structures is consistent with the hypothesis that ZIP14 plays a role in the cellular assimilation of iron from TF.
FIGURE 5.
ZIP14 partially co-localizes with internalized TF in HepG2 cells. Cells were incubated for 30 min with Alexa Fluor 488-labeled human holo-TF prior to fixation and permeabilization. Endogenous ZIP14–3×FLAG was detected by using anti-FLAG antibody followed by rhodamine-conjugated secondary antibody. Merged image shows co-localization of ZIP14 and internalized holo-TF. Nuclei were stained with DAPI. All images were obtained by using a Leica TCS SP5 laser-scanning confocal microscope. Areas of co-localization (designated by white) were determined by using the co-localization tool provided with the Leica SP5 software.
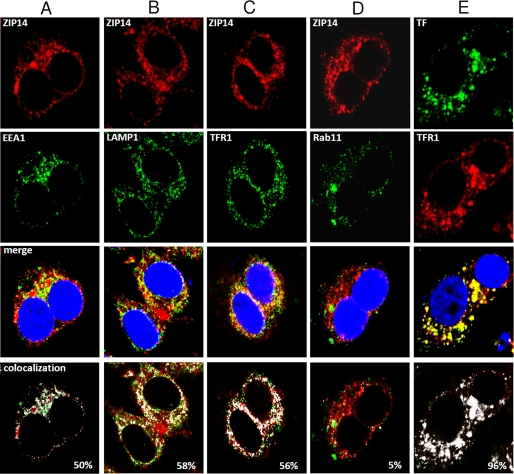
To investigate the localization of endogenous ZIP14 further, we performed immunofluorescence analysis using several marker proteins: EEA1 for early endosomes, LAMP1 for late endosomes and lysosomes, TFR1 for early and recycling endosomes, and Rab11 for recycling endosomes. In HepG2 cells, ZIP14 partially co-localized with EEA1, LAMP1, TFR1, but not with Rab11 (Fig. 6). Co-localization of TF with TFR1 was used as a control, showing 96% co-localization.
FIGURE 6.
Confocal microscopic analysis of the subcellular localization of ZIP14 in HepG2 cells. Fixed and permeabilized cells were analyzed for endogenous ZIP14–3×FLAG by using anti-FLAG antibody followed by rhodamine-conjugated secondary antibody. A–D, co-localization of ZIP14 with EEA1 (A), LAMP1 (B), TFR1 (C), and Rab11 (D) was determined by using respective primary antibodies followed by Alexa Fluor 488-labeled secondary antibody. Merged images show co-localization of ZIP14, with nuclei stained by DAPI. E, as a control, TF was co-localized with TFR1 by first incubating cells for 30 min with Alexa Fluor 488-labeled human holo-TF prior to fixation and permeabilization of cells. TFR1 was determined by using anti-TFR1 antibody followed by rhodamine-conjugated secondary antibody. All images were obtained by using a Leica TCS SP5 laser-scanning confocal microscope. Areas of co-localization (designated by white) were determined by using the co-localization tool provided with the Leica SP5 software.
Knockdown of ZIP14 in HepG2 Cells Decreases the Assimilation of Iron from TF
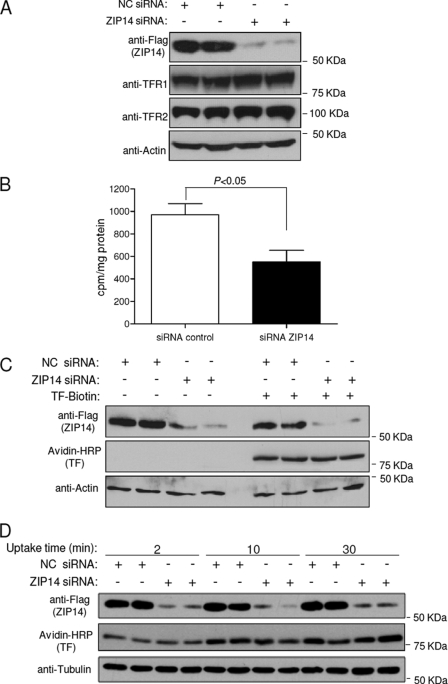
To determine whether endogenous ZIP14 plays a role in the assimilation of iron by HepG2 cells, we suppressed ZIP14 by using siRNA and then measured the cellular assimilation of 59Fe from 59Fe-TF. Efficient knockdown of ZIP14 was confirmed by Western blotting (Fig. 7A). ZIP14 knockdown did not decrease the levels of TFR1 or TFR2, which are both expressed in HepG2 cells (20). We were unable to detect DMT1 protein in these cells (data not shown), despite the fact that DMT1 mRNA copy numbers were similar to those in HEK 293T cells (Fig. 3), where we could detect DMT1 protein (Fig. 1B). The apparent discrepancy may reflect differences in post-transcriptional regulation of DMT1 between cell types (21). Importantly, suppression of ZIP14 expression resulted in 45% less 59Fe assimilation from 100 nm 59Fe-TF compared with control cells (Fig. 7B). Because the lower assimilation of 59Fe could possibly reflect diminished uptake of TF, we compared the amount of biotin-labeled TF taken up by control cells and after ZIP14 knockdown. Fig. 7C shows that ZIP14 knockdown did not decrease the uptake of TF after 4 h. Because TF will have cycled through many rounds of endocytosis after 4 h, we determined whether ZIP14 suppression affected TF uptake at 2, 10, and 30 min. Suppression of ZIP14 did not affect TF uptake at these shorter time points (Fig. 7D) (22, 23).
FIGURE 7.
Knockdown of ZIP14 in HepG2 cells decreases the assimilation of iron from TF. A, HepG2 cells were transfected with negative control (NC) or ZIP14 siRNA for 72 h prior to Western blot analysis for ZIP14, TFR1, TFR2, and actin as a lane loading control. B, HepG2 cells transfected with negative control or ZIP14 siRNA for 72 h were incubated with 100 nm 59Fe-TF for 4 h. Cells were harvested, and cell-associated radioactivity was determined by γ-counting. The amount of 59Fe assimilated by the cells is expressed as cpm/mg of protein. Data represent the mean ± S.E. (error bars) of three independent experiments. C, HepG2 cells transfected with negative control or ZIP14 siRNA for 72 h were incubated with or without 100 nm biotin-labeled holo-TF. After 4 h, cell lysates were analyzed by Western blotting for ZIP14, TF, and actin as a lane loading control. Data are representative of one of two independent experiments. D, HepG2 cells transfected with negative control or ZIP14 siRNA for 72 h were incubated with 100 nm biotin-labeled holo-TF. After 2, 10, and 30 min, cell lysates were obtained and analyzed by Western blotting for ZIP14, TF, and tubulin as a lane-loading control. Data are representative of one of two independent experiments.
DISCUSSION
ZIP14 is a transmembrane protein that belongs to the solute carrier 39 (SLC39A) family, which includes 14 known mammalian members. ZIP14 was first characterized in 2005 by Taylor et al. (17), who showed that ZIP14 overexpression in Chinese hamster ovary (CHO) cells stimulated the uptake of zinc into the cytosol. In 2006, Liuzzi et al. (11) reported that overexpression of ZIP14 in HEK 293 cells and Sf9 insect cells enhanced not only the uptake of zinc, but also iron. The iron was presented to the cells as ferric citrate, the major form of NTBI that appears in plasma in conditions of iron overload (22). In addition, suppression of endogenous ZIP14 with siRNA in AML12 cells, a mouse hepatocyte cell line, resulted in reduced uptake of NTBI from ferric citrate. Subsequently, Gao et al. (10) showed that ZIP14 overexpression stimulated NTBI uptake in HeLa cells and that suppression of endogenous ZIP14 in the human hepatoma cell line, HepG2, decreased NTBI uptake. Together, these data provide strong support that ZIP14 mediates NTBI uptake into cells (Fig. 8). A physiologic role for ZIP14 in NTBI uptake is suggested by the observation that human ZIP14 is expressed most abundantly in liver, heart, and pancreas (17), the tissues that preferentially accumulate iron in iron overload disorders such as hereditary hemochromatosis.
FIGURE 8.
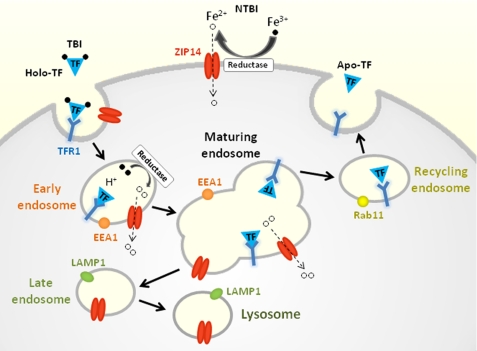
Model of ZIP14 function in iron assimilation by hepatocytes. Binding of holo-TF (Fe3+-TF) to TFR1 results in endocytosis of the TF·TFR1 complex. Acidification of early endosomes causes TF to release its Fe3+ iron, which is reduced to Fe2+ prior to transport into the cytosol via endosomal ZIP14. The TF·TFR1 complex recycles to the plasma membrane where apo-TF dissociates from TFR1. ZIP14 is detectable in EEA1- and LAMP1-positive structures, but not Rab11-positive structures, suggesting that ZIP14 does not recycle to the plasma membrane. ZIP14 at the cell surface mediates the uptake of NTBI.
In addition to clearing NTBI rapidly, the liver readily takes up TBI and assimilates the iron (8). Studies in isolated primary mouse and rat hepatocytes have shown that TBI can inhibit the uptake of NTBI (and vice versa), suggesting that NTBI and TBI share a common membrane iron transporter (9, 23, 24). Our previous study in HepG2 cells suggested that ZIP14 may represent this common transporter. Specifically, we found that HFE expression resulted in a down-regulation of ZIP14 that was associated with reduced uptake and assimilation of iron when the iron was presented to the cells as either NTBI or TBI (10).
In the present study we tested the hypothesis that ZIP14 plays a role in the assimilation of iron from TF. First, we found that transfection of HEK 293T cells with ZIP14 stimulated the assimilation of iron from TF. The enhanced assimilation of iron was not associated with changes in the levels of TFR1 or DMT1, which could also affect this process. These data suggest that ZIP14, rather than TFR1 or DMT1, is limiting for iron assimilation by this pathway in HEK 293T cells. That DMT1 is not limiting is further supported by the observation that the assimilation of iron from TF was unaffected in HEK 293T cells stably transfected with DMT1 (25). A similar lack of an effect of DMT1 transfection on the assimilation of iron from TF has also been observed in CHO cells (26) and in the human hepatoma cell line HLF (27).
As in human liver, ZIP14 is abundantly expressed in HepG2 cells, a human hepatoma cell line that possesses many of the key features of hepatocytes (18). Hepatocytes and hepatoma cells are known to take up Fe-TF by several mechanisms including a high affinity, low capacity TFR1-mediated endocytic pathway and a low affinity, high capacity TFR1-independent pathway (28–31). In primary mouse hepatocytes and HuH7 hepatoma cells, the TFR1-mediated pathway saturates at low TF concentrations between 50 and 100 nm (31, 32). Here, we document that in HepG2 cells incubated with 100 nm TF, knockdown of endogenous ZIP14-FLAG resulted in 45% less assimilation of iron from TF compared with controls. A similar decrement in iron assimilation from 100 nm TF was observed in wild-type HepG2 cells in which ZIP14 expression was suppressed (supplemental Fig. S1). These data provide strong support that ZIP14 plays a role in the assimilation of iron from TF, presumably through the high affinity, low capacity TFR1-mediated endocytic pathway (Fig. 8). Consistent with this possibility is the observation that endogenous ZIP14 in HepG2 cells partially co-localizes with endocytosed holo-TF, the early endosome marker EEA1, and TFR1. Moreover, ZIP14 is able to mediate the transport of iron at pH 6.5, the pH at which more than 50% of iron dissociates from TF in the endosome (33).
ZIP14 also partially co-localized with LAMP1, a marker for late endosomes and lysosomes, which usually have a pH of <6.0. Because ZIP14 does not appear to transport iron at pH 5.5, it seems unlikely that ZIP14 would function as an iron transporter in these more acidic organelles. A more effective transporter under lower pH conditions would be DMT1, which transports iron optimally at pH 5.5 (34) and which localizes to late endosomes and lysosomes (35).
Recently, Herbison et al. (36) showed that knockdown of TFR1 in HuH7 cells resulted in 80% less assimilation of iron from 50 nm TF compared with controls. The lower iron levels were due to diminished uptake of TF because TF uptake was also 80% lower. In our study, knockdown of ZIP14 in HepG2 cells did not affect the uptake of TF, but it did reduce the assimilation of iron from TF by 50%. These data indicate that ZIP14 is required for efficient cellular assimilation of iron from internalized TF.
In humans, plasma TF concentrations typically range between 25 and 50 μm. Saturation of TF with iron normally fluctuates between 20 and 55%, but can reach 100% in iron overload. At physiologic concentrations of TF, hepatocytes can take up TBI via a TFR1-independent pathway (29, 31, 37). The molecular mechanisms involved in this pathway, however, remain poorly defined.
The ability of ZIP14 to enhance the assimilation of iron from TF may be relevant to the hypoferremia (and anemia) of inflammation. In response to inflammatory stimuli, such as lipopolysaccharide (LPS) or turpentine, plasma iron levels rapidly decrease and hepatic iron levels increase (38, 39). The hypoferremia results predominantly from a blockade of iron release from reticuloendothelial macrophages, the main suppliers of iron to the plasma (40). Because the liver houses the largest population of reticuloendothelial macrophages (i.e. Kupffer cells), hepatic iron levels increase. During inflammation, iron release is also reduced from hepatocytes, further elevating hepatic iron concentrations. Increased hepatic uptake of plasma iron, which is normally >95% TBI, may additionally contribute to the hypoferremia of inflammation. Studies in isolated rat hepatocytes have shown that LPS markedly increases the assimilation of iron from internalized TF (41). Similarly in HepG2 cells, stimulation with the inflammatory cytokine, interleukin-6 (IL-6), enhanced the assimilation of iron from TF by 48% (42). Because LPS, turpentine, and IL-6 have all been shown to increase levels of ZIP14 potently in mouse liver and in isolated hepatocytes (19), it is possible that ZIP14 contributes to the hypoferremia of inflammation by stimulating the assimilation of iron from plasma TF.
Until now, DMT1 was the only transmembrane transport protein that has been proposed to participate in hepatocyte assimilation of iron from TF (1). Data from the present study suggest that ZIP14, which is expressed in HepG2 cells at 10 times higher levels than DMT1, participates in the assimilation of iron from TF. Future studies in whole animals will be needed to define the in vivo role of ZIP14 in iron uptake by the liver and other tissues/cell types. Of particular interest is the placenta, which has been shown to express ZIP14 (17). Placental iron transport involves endocytosis of TF from the maternal circulation and dissociation of iron from TF prior to export into the fetal circulation (43). The transport of iron out of the endosome in syncytiotrophoblast cells of the placenta was thought to be mediated by DMT1 (44), until the generation of DMT1 knock-out mice demonstrated that it was not required (6). If ZIP14 localizes to endosomes in syncytiotrophoblast cells as it does in HepG2 cells, it seems plausible that ZIP14 plays a role in placental iron transfer.
Supplementary Material
Acknowledgments
We thank Dr. Zhenghe Wang (Case Western Reserve University) for the rAAV-Neo-Lox P-3×FLAG knock-in vector and Dongyan Wang (University of Florida, IFAS Statistics Consulting Unit) for advice on statistical analyses.
This work was supported by National Institutes of Health Grants DK 080706 (to M. D. K.) and DK 054488 (to C. A. E.).

The on-line version of this article (available at http://www.jbc.org) contains supplemental Fig. S1, Experimental Procedures, and Table 1.
- TF
- transferrin
- AAV
- adeno-associated virus
- DMT1
- divalent metal transporter 1
- EEA1
- early endosome antigen 1
- Fe-TF
- iron-transferrin
- NTBI
- non-transferrin-bound iron
- SFM
- serum-free medium
- TBI
- transferrin-bound iron
- TFR
- transferrin receptor
- ZIP14
- ZRT/IRT-like protein 14.
REFERENCES
- 1.Graham R. M., Chua A. C., Herbison C. E., Olynyk J. K., Trinder D. (2007) World J. Gastroenterol. 13, 4725–4736 [DOI] [PMC free article] [PubMed] [Google Scholar]
- 2.Ohgami R. S., Campagna D. R., Greer E. L., Antiochos B., McDonald A., Chen J., Sharp J. J., Fujiwara Y., Barker J. E., Fleming M. D. (2005) Nat. Genet. 37, 1264–1269 [DOI] [PMC free article] [PubMed] [Google Scholar]
- 3.Fleming M. D., Romano M. A., Su M. A., Garrick L. M., Garrick M. D., Andrews N. C. (1998) Proc. Natl. Acad. Sci. U.S.A. 95, 1148–1153 [DOI] [PMC free article] [PubMed] [Google Scholar]
- 4.Su M. A., Trenor C. C., Fleming J. C., Fleming M. D., Andrews N. C. (1998) Blood 92, 2157–2163 [PubMed] [Google Scholar]
- 5.Cheney B. A., Lothe K., Morgan E. H., Sood S. K., Finch C. A. (1967) Am. J. Physiol. 212, 376–380 [DOI] [PubMed] [Google Scholar]
- 6.Gunshin H., Fujiwara Y., Custodio A. O., Direnzo C., Robine S., Andrews N. C. (2005) J. Clin. Invest. 115, 1258–1266 [DOI] [PMC free article] [PubMed] [Google Scholar]
- 7.Lambe T., Simpson R. J., Dawson S., Bouriez-Jones T., Crockford T. L., Lepherd M., Latunde-Dada G. O., Robinson H., Raja K. B., Campagna D. R., Villarreal G., Jr., Ellory J. C., Goodnow C. C., Fleming M. D., McKie A. T., Cornall R. J. (2009) Blood 113, 1805–1808 [DOI] [PMC free article] [PubMed] [Google Scholar]
- 8.Morgan E. H., Smith G. D., Peters T. J. (1986) Biochem. J. 237, 163–173 [DOI] [PMC free article] [PubMed] [Google Scholar]
- 9.Chua A. C., Olynyk J. K., Leedman P. J., Trinder D. (2004) Blood 104, 1519–1525 [DOI] [PubMed] [Google Scholar]
- 10.Gao J., Zhao N., Knutson M. D., Enns C. A. (2008) J. Biol. Chem. 283, 21462–21468 [DOI] [PMC free article] [PubMed] [Google Scholar]
- 11.Liuzzi J. P., Aydemir F., Nam H., Knutson M. D., Cousins R. J. (2006) Proc. Natl. Acad. Sci. U.S.A. 103, 13612–13617 [DOI] [PMC free article] [PubMed] [Google Scholar]
- 12.Worthington M. T., Browne L., Battle E. H., Luo R. Q. (2000) Am. J. Physiol. Gastrointest. Liver Physiol. 279, G1265–G1273 [DOI] [PubMed] [Google Scholar]
- 13.Zhang X., Guo C., Chen Y., Shulha H. P., Schnetz M. P., LaFramboise T., Bartels C. F., Markowitz S., Weng Z., Scacheri P. C., Wang Z. (2008) Nat. Methods 5, 163–165 [DOI] [PMC free article] [PubMed] [Google Scholar]
- 14.Wang Z. (2009) Methods Mol. Biol. 567, 87–98 [DOI] [PMC free article] [PubMed] [Google Scholar]
- 15.Ciechanover A., Schwartz A. L., Dautry-Varsat A., Lodish H. F. (1983) J. Biol. Chem. 258, 9681–9689 [PubMed] [Google Scholar]
- 16.Nomura N., Nagase T., Miyajima N., Sazuka T., Tanaka A., Sato S., Seki N., Kawarabayasi Y., Ishikawa K., Tabata S. (1994) DNA Res. 1, 223–229 [DOI] [PubMed] [Google Scholar]
- 17.Taylor K. M., Morgan H. E., Johnson A., Nicholson R. I. (2005) FEBS Lett. 579, 427–432 [DOI] [PubMed] [Google Scholar]
- 18.Bokhari M., Carnachan R. J., Cameron N. R., Przyborski S. A. (2007) J. Anat. 211, 567–576 [DOI] [PMC free article] [PubMed] [Google Scholar]
- 19.Liuzzi J. P., Lichten L. A., Rivera S., Blanchard R. K., Aydemir T. B., Knutson M. D., Ganz T., Cousins R. J. (2005) Proc. Natl. Acad. Sci. U.S.A. 102, 6843–6848 [DOI] [PMC free article] [PubMed] [Google Scholar]
- 20.Kawabata H., Nakamaki T., Ikonomi P., Smith R. D., Germain R. S., Koeffler H. P. (2001) Blood 98, 2714–2719 [DOI] [PubMed] [Google Scholar]
- 21.Trinder D., Oates P. S., Thomas C., Sadleir J., Morgan E. H. (2000) Gut 46, 270–276 [DOI] [PMC free article] [PubMed] [Google Scholar]
- 22.Grootveld M., Bell J. D., Halliwell B., Aruoma O. I., Bomford A., Sadler P. J. (1989) J. Biol. Chem. 264, 4417–4422 [PubMed] [Google Scholar]
- 23.Graham R. M., Morgan E. H., Baker E. (1998) Eur. J. Biochem. 253, 139–145 [DOI] [PubMed] [Google Scholar]
- 24.Trinder D., Morgan E. (1997) Hepatology 26, 691–698 [DOI] [PubMed] [Google Scholar]
- 25.Wetli H. A., Buckett P. D., Wessling-Resnick M. (2006) Chem. Biol. 13, 965–972 [DOI] [PMC free article] [PubMed] [Google Scholar]
- 26.Zhang A. S., Canonne-Hergaux F., Gruenheid S., Gros P., Ponka P. (2008) Exp. Hematol. 36, 1227–1235 [DOI] [PMC free article] [PubMed] [Google Scholar]
- 27.Shindo M., Torimoto Y., Saito H., Motomura W., Ikuta K., Sato K., Fujimoto Y., Kohgo Y. (2006) Hepatol. Res. 35, 152–162 [DOI] [PubMed] [Google Scholar]
- 28.Morgan E. H., Baker E. (1986) Fed. Proc. 45, 2810–2816 [PubMed] [Google Scholar]
- 29.Ikuta K., Zak O., Aisen P. (2004) Int. J. Biochem. Cell Biol. 36, 340–352 [DOI] [PubMed] [Google Scholar]
- 30.Trinder D., Morgan E. H., Baker E. (1988) Biochim. Biophys. Acta 943, 440–446 [DOI] [PubMed] [Google Scholar]
- 31.Trinder D., Zak O., Aisen P. (1996) Hepatology 23, 1512–1520 [DOI] [PubMed] [Google Scholar]
- 32.Chua A. C., Herbison C. E., Drake S. F., Graham R. M., Olynyk J. K., Trinder D. (2008) Hepatology 47, 1737–1744 [DOI] [PubMed] [Google Scholar]
- 33.Núñez M. T., Gaete V., Watkins J. A., Glass J. (1990) J. Biol. Chem. 265, 6688–6692 [PubMed] [Google Scholar]
- 34.Gunshin H., Mackenzie B., Berger U. V., Gunshin Y., Romero M. F., Boron W. F., Nussberger S., Gollan J. L., Hediger M. A. (1997) Nature 388, 482–488 [DOI] [PubMed] [Google Scholar]
- 35.Tabuchi M., Yoshimori T., Yamaguchi K., Yoshida T., Kishi F. (2000) J. Biol. Chem. 275, 22220–22228 [DOI] [PubMed] [Google Scholar]
- 36.Herbison C. E., Thorstensen K., Chua A. C., Graham R. M., Leedman P., Olynyk J. K., Trinder D. (2009) Am. J. Physiol. Cell Physiol. 297, C1567–C1575 [DOI] [PubMed] [Google Scholar]
- 37.Trinder D., Morgan E., Baker E. (1986) Hepatology 6, 852–858 [DOI] [PubMed] [Google Scholar]
- 38.Nemeth E., Rivera S., Gabayan V., Keller C., Taudorf S., Pedersen B. K., Ganz T. (2004) J. Clin. Invest. 113, 1271–1276 [DOI] [PubMed] [Google Scholar]
- 39.Sheikh N., Dudas J., Ramadori G. (2007) Lab. Invest. 87, 713–725 [DOI] [PubMed] [Google Scholar]
- 40.Knutson M., Wessling-Resnick M. (2003) Crit. Rev. Biochem. Mol. Biol. 38, 61–88 [DOI] [PubMed] [Google Scholar]
- 41.Potter B. J., Blades B., McHugh T. A., Nunes R. M., Beloqui O., Slott P. A., Rand J. H. (1989) Am. J. Physiol. Gastrointest. Liver Physiol. 257, G524–G531 [DOI] [PubMed] [Google Scholar]
- 42.Hirayama M., Kohgo Y., Kondo H., Shintani N., Fujikawa K., Sasaki K., Kato J., Niitsu Y. (1993) Hepatology 18, 874–880 [DOI] [PubMed] [Google Scholar]
- 43.McArdle H. J., Andersen H. S., Jones H., Gambling L. (2008) J. Neuroendocrinol. 20, 427–431 [DOI] [PubMed] [Google Scholar]
- 44.Georgieff M. K., Wobken J. K., Welle J., Burdo J. R., Connor J. R. (2000) Placenta 21, 799–804 [DOI] [PubMed] [Google Scholar]
Associated Data
This section collects any data citations, data availability statements, or supplementary materials included in this article.


