

Abstract
DNA-binding response regulators (RRs) of the OmpR/PhoB subfamily alternate between inactive and active conformational states, with the latter having enhanced DNA-binding affinity. Phosphorylation of an aspartate residue in the receiver domain, usually via phosphotransfer from a cognate histidine kinase, stabilizes the active conformation. Many of the available structures of inactive OmpR/PhoB family proteins exhibit extensive interfaces between the N-terminal receiver and C-terminal DNA-binding domains. These interfaces invariably involve the α4-β5-α5 face of the receiver domain, the locus of the largest differences between inactive and active conformations and the surface that mediates dimerization of receiver domains in the active state. Structures of receiver domain dimers of DrrB, DrrD, and MtrA have been determined, and phosphorylation kinetics were analyzed. Analysis of phosphotransfer from small molecule phosphodonors has revealed large differences in autophosphorylation rates among OmpR/PhoB RRs. RRs with substantial domain interfaces exhibit slow rates of phosphorylation. Rates are greatly increased in isolated receiver domain constructs. Such differences are not observed between autophosphorylation rates of full-length and isolated receiver domains of a RR that lacks interdomain interfaces, and they are not observed in histidine kinase-mediated phosphotransfer. These findings suggest that domain interfaces restrict receiver domain conformational dynamics, stabilizing an inactive conformation that is catalytically incompetent for phosphotransfer from small molecule phosphodonors. Inhibition of phosphotransfer by domain interfaces provides an explanation for the observation that some RRs cannot be phosphorylated by small molecule phosphodonors in vitro and provides a potential mechanism for insulating some RRs from small molecule-mediated phosphorylation in vivo.
Keywords: Allosteric Regulation, Bacterial Signal Transduction, Bioenergetics, Crystal Structure, Enzyme Kinetics, Histidine Kinases, Kinetics, Acetyl Phosphate, Bacterial Response Regulators, Bacterial Two-component Systems
Introduction
A fundamental aspect of signal transduction systems is the ability to toggle between different functional states. Many signaling systems, including two-component systems, utilize protein phosphorylation to modulate their output (1). In two-component systems, the phosphorylation cascade typically proceeds from a histidine kinase (HK)4 to the receiver domain of a response regulator (RR) in a reaction catalyzed by the RR (1, 2). Inhibitory or activating interactions with binding partners, specific to the unphosphorylated and/or phosphorylated receiver domains, are the basis of regulatory mechanisms that control RR activity (3).
Receiver domains exist in equilibrium between two predominant conformations designated inactive and active. Although the inactive conformation is energetically favored for unphosphorylated receiver domains and the active conformation is favored for phosphorylated receiver domains, receiver domains sample the active conformation even in the absence of phosphorylation. The coexistence of the two conformations within a population of unphosphorylated RR molecules was demonstrated directly by NMR analysis of Salmonella enterica NtrC (4), and structural and functional characterization of mutant proteins indicated a correlation between transcriptional activity and the position of the equilibrium (4, 5). The studies on NtrC, as well as those on other RRs such as Escherichia coli CheY (6), have been interpreted in terms of a simple two-state model. Although this model is likely an oversimplification of a more complex situation involving multiple functionally relevant conformations (7–10), it provides a useful foundation for understanding the dynamic aspects of RR function.
It is becoming clear that protein dynamics and function are intimately intertwined (11–15). Studies on several different proteins have indicated that enzymatic catalysis or binding activities occur only in subpopulations of proteins that pre-exist in competent conformations. This phenomenon has been suggested to explain the slow rate of autophosphorylation observed for Mycobacterium tuberculosis MtrA, a RR of the OmpR/PhoB subfamily of RR transcription factors (16). Intra- or intermolecular interactions of receiver domains have the potential to bias the conformational equilibrium by stabilizing either inactive or active conformations. In unphosphorylated MtrA, the α4-β5-α5 face of the receiver domain forms an interface with the DNA-binding domain (DBD), stabilizing the inactive conformation of the receiver domain. Supporting the hypothesis that the domain interface inhibits autophosphorylation, the isolated MtrA receiver domain, which lacks the constraints of the domain interface, exhibits a much faster rate of autophosphorylation than intact MtrA.
Despite the presence of structurally similar receiver and DBDs, different domain arrangements are observed in all available structures of full-length unphosphorylated (and presumably inactive) OmpR/PhoB subfamily RRs (16–19). When they exist, interdomain interfaces invariably involve the α4-β5-α5 face of the receiver domain interacting with some surface of the DBD. All OmpR/PhoB subfamily RRs are thought to adopt a similar dimeric structure in the active state, with the receiver domains dimerized via conserved residues on the α4-β5-α5 face and tethered to the DBDs by flexible linkers (20–25). Thus, α4-β5-α5 interactions with the DBD in the inactive state are effectively competitive inhibitors of activation. To examine the influences of interdomain interfaces on the catalytic activity of receiver domains, we determined autophosphorylation rates of five OmpR/PhoB subfamily RRs and of their isolated receiver domains. Slow rates of autophosphorylation were found in RRs with domain interfaces, supporting our hypothesis that interactions that stabilize the inactive conformation reduce catalysis. However, this effect was not observed in phosphotransfer mediated by a cognate HK. The results of this study provide an explanation for reports of some RRs that cannot be phosphorylated by small molecule phosphodonors in vitro and a potential mechanism for limiting phosphorylation by small molecule metabolites in vivo.
EXPERIMENTAL PROCEDURES
Cloning and Molecular Biology
The proteins analyzed in this study were expressed in pJZG92 from a T7 promoter. pJZG92 was created by removing the HindIII/XhoI fragment located within the multiple cloning site of pET21b (Novagen) and replacing it with a synthetically derived oligonucleotide that encodes a thrombin-sensitive sequence. Genes encoding the different proteins being expressed were introduced into pJZG92 via the NdeI and HindIII sites. Expression in these pJZG92-derived plasmids results in a protein product that includes a thrombin-sensitive sequence at the C terminus, followed by a His6 tag. The amino acid sequence following the last residue of each protein is KLLVPRGSLEHHHHHH. pDrrD served as the source of the genes that correspond to Thermotoga maritima DrrD and DrrDN (residues 1–122), and pDB1 was the source for T. maritima DrrB and DrrBN (residues 1–117). pTRM11 was the source for E. coli PhoB and PhoBN (residues 1–125). M. tuberculosis PrrA, PrrAN (residues 1–134), and PrrBHDC (residues 178–446) were amplified from M. tuberculosis H37Rv genomic DNA (obtained from Mycobacteria Research Laboratories at Colorado State University) and cloned into pJZG92 as described above. All plasmids and strains used in this study are listed in supplemental Table S1.
Protein Expression and Purification
DrrB, DrrBN, DrrD, DrrDN, MtrA, MtrAN, PrrA, PrrAN, PhoB, PhoBN, and PrrBHDC were expressed in either E. coli Rosetta(DE3) (PrrBHDC) or BL21(DE3) (all other proteins). All cells were grown at 37 °C to mid-log phase in either Terrific Broth with 1 m sorbitol (PrrA and PrrAN) or LB medium (all other proteins) containing 100 μg/ml ampicillin. Protein expression was induced by the addition of isopropyl 1-thio-β-d-galactopyranoside to a final concentration of 0.5 mm. Following induction, all protein expression strains except those expressing PrrA and PrrAN were grown for an additional 3 h at 37 °C. PrrA and PrrAN were grown for an additional 17 h at 20 °C. Cells were harvested by centrifugation and lysed by sonication Buffer A (20 mm sodium phosphate (pH 7.4), 500 mm NaCl, 25 mm imidazole, and 2 mm β-mercaptoethanol (BME)). The resulting lysate was centrifuged (60,000 × g), filtered through a 0.2-μm filter, and then loaded onto a 1-ml HisTrapTM FF crude column (GE Healthcare) pre-equilibrated with Buffer A. Bound proteins were eluted from the column with a 30-ml linear gradient from Buffer A to 20 mm sodium phosphate (pH 7.4), 500 mm NaCl, 500 mm imidazole, and 2 mm BME at a flow rate of 2 ml/min. Fractions that contained the protein of interest were pooled, filtered using a 0.2-μm filter, and then loaded onto a Superdex 75 26/60 gel filtration column (GE Healthcare) pre-equilibrated with 50 mm Tris (pH 7.5), 500 mm NaCl, and 2 mm BME. The fractions containing pure protein were pooled and stored at −80 °C after rapid freezing in a dry ice/ethanol bath. In some cases, the His6 tag was removed by thrombin treatment, and the digested protein was separated from the undigested protein and the cleaved His6 tag by passing the digested material over a HisTrapTM FF column. Removal of the His6 tag had no effect on subsequent assays. Although His residues can be phosphorylated by phosphoramidate (PA), the rates are negligible compared with phosphorylation of RRs at the active-site Asp (26).
Crystallization
Both DrrBN and DrrDN were activated by adding 6 mm BeCl2, 50 mm NaF, and 10 mm MgCl2 to 1.0–1.2 mg/ml protein. The activated proteins were then concentrated to ∼15 mg/ml using Amicon Ultra-10 centrifugal filter units (Millipore).
Crystals of activated selenomethionine-derivatized DrrBN were grown using the hanging drop method of vapor diffusion. The protein was mixed with an equal volume of reservoir solution containing 10% 2-propanol, 200 mm Li2SO4, and 0.1 m potassium citrate (pH 4.2). Crystals were cryoprotected by passing them quickly through reservoir solution containing 30% 2-methyl-2,4-pentanediol, 6 mm BeCl2, 50 mm NaF, and 10 mm MgCl2 and then flash-freezing them directly in a 100 K nitrogen stream. The crystals belong to space group C2 with cell constants a = 64.3, b = 37.5, and c = 91.5 Å and β = 108.1°, with two molecules/asymmetric unit.
Crystals of activated DrrDN were grown in a similar manner using reservoir solution composed of 9–12% polyethylene glycol 3350 and 200 mm NaH2PO4. Cryoprotection was done by briefly soaking the crystals in reservoir solution with 20% glycerol, 6 mm BeCl2, 50 mm NaF, and 10 mm MgCl2 and then flash-freezing them directly in a 100 K nitrogen stream. The crystals belong to space group P43212 with cell constants a = b = 74.9 and c = 98.7 Å, corresponding to two molecules/asymmetric unit.
Crystals of MtrAN were grown in a similar manner using a reservoir solution composed of 2.6 m NaCl, 100 mm HEPES (pH 7.5), and 100 mm MgCl2. Crystals formed within 24 h at room temperature and were flash-cooled in liquid nitrogen after being briefly soaked in the reservoir buffer with 25% glycerol. The crystals belong to space group P31 with cell constants a = b = 56.6 and c = 181.8 Å, with four molecules/asymmetric unit.
Single-wavelength anomalous dispersion data were collected from a single DrrBN crystal, and a native data set was collected using a single DrrDN crystal at beamline X4A at the National Synchrotron Light Source at Brookhaven National Laboratory (Upton, NY). MtrAN data were collected on a Rigaku MicroMax-007 HF generator equipped with a RaxisIV++ detector. Data were processed and scaled with DENZO and SCALEPACK (27).
Structure Determination and Refinement for DrrBN
Positions of five of the eight selenium sites were determined from the peak wavelength utilizing the single-wavelength anomalous dispersion phasing protocol implemented in CNS with a mean figure of merit of 0.283 and phasing power of 1.24 (28). Initial phase estimates extending to 1.9 Å were improved with solvent flipping and density modification. A starting model was generated utilizing the model building tools in COOT (29). Density corresponding to the BeF3− moiety was clearly visible after several rounds of refinement that included simulated annealing, maximum likelihood, and temperature factor refinements in CNS (28), followed by model building with COOT. Water molecules were added to positive difference Fourier peaks >2.5σ. The model was refined to 1.9 Å with an R factor of 0.189 and an Rfree value of 0.231. It contains 234 residues, 125 water molecules, and two magnesium, two beryllium, and six fluoride atoms. All residues lie in the allowed region of the Ramachandran plot and exhibit favorable stereochemistry as defined by PROCHECK (30).
Structure Determination and Refinement for DrrDN
The DrrDN structure was solved using molecular replacement by the program Phaser (31) with data extending from 15 to 3.0 Å. A polyalanine model of the DrrD N-terminal domain (residues 4–115) with the α4 helix omitted (residues 81–92) was used as a search model (17). An initial rigid body refinement was used to optimize the position of the two DrrDN monomers. Similar to the DrrBN structure, the model was subjected to iterative rounds of simulated annealing, maximum likelihood, and temperature factor refinements in CNS and manual rebuilding in COOT. BeF3− was positioned in the appropriate density, and water molecules were added to positive difference Fourier peaks >2.5σ. The final model was refined to 2.2 Å with an R factor of 0.221 and an Rfree value of 0.267. The model contains two monomers (amino acid residues 2–120), 139 water molecules, and two magnesium, two beryllium, and six fluoride atoms. All but one residue, Val58, lie in the allowed region of the Ramachandran plot and exhibit favorable stereochemistry as defined by PROCHECK (30).
Structure Determination and Refinement for MtrAN
The structure of MtrAN was solved by molecular replacement using PHENIX (32) and the N-terminal domain of full-length MtrA (Protein Data Bank code 2GWR) as a search model. The structure was rebuilt in place and iteratively refined using PHENIX and COOT. The model contains four protein molecules (amino acid residues 5–120 (A), 6–120 (B), 5–121 (C and D)), 155 water molecules, and four Mg2+ ions. All residues lie in the favored region of the Ramachandran plot and exhibit favorable stereochemistry as defined by MolProbity (33).
Data collection and refinement statistics for DrrBN, DrrDN, and MtrAN are given in supplemental Table S2. Figures were generated using the PyMOL Molecular Graphics System (Schrödinger LLC).
Protein Phosphorylation Analysis
The formation and subsequent hydrolysis of a phosphorylated RR (RR∼P) using a small molecule phosphodonor (X∼P) are described using Reaction 1 (34).
REACTION 1.

All RR autophosphorylation reactions monitored in this study were performed with the concentration of RR being small (10 μm) relative to X∼P (20 mm) such that plots of the fraction of [RR∼P]/[RRtotal] (F) versus time (t) can be fit with a first-order exponential decay of the following form (Equation 1).
In this equation, the values representing the maximum fraction of phosphorylated RR (F∞) and observed autophosphorylation rate (kobs) are described by the following relationships (Equations 2 and 3).
Note that both F∞ and kobs are dependent on both the rate of phosphotransfer to the RR (k2) and the RR∼P hydrolysis rate (k3). The kinetic and equilibrium constants in these equations are covariant parameters preventing an accurate determination of these values using unconstrained nonlinear least-squares analysis of the F versus t plots. Because of this limitation, we have chosen to use kobs values for the purpose of comparing the autophosphorylation energetics of each RR with its associated receiver domain. This comparison is valid when the concentrations of the reactants are identical in the compared experiments and the autodephosphorylation rates for both the full-length proteins and their isolated receiver domains are equivalent. This assumption is shown to be valid by analysis of the autodephosphorylation rates of two RRs and their receiver domains as herein described.
HPLC
Analyses were performed as described previously (16, 21, 35) using a Hitachi D-7000 HPLC system. Solutions of 10 μm protein in 50 mm Tris (pH 7.5), 100 mm NaCl, 2 mm BME, and 10 mm MgCl2 with or without incubations with 20 mm PA were prepared. 30-μl aliquots were injected onto a C-8 reverse-phase HPLC column (Grace Vydac, Inc.) pre-equilibrated with 31.5% (v/v) acetonitrile and 0.1% (v/v) TFA. Proteins were eluted using a 60-ml gradient from 31.5% (v/v) acetonitrile and 0.1% (v/v) TFA to 58.5% (v/v) acetonitrile and 0.1% (v/v) TFA at a flow rate of 1 ml/min. Absorbance data were recorded at 210, 220, 260, and 280 nm. Areas under each elution peak from the absorbance at 210 nm versus elution time plots were calculated using HPLC-associated software.
Fluorescence
Fluorescence experiments were conducted as described previously (36) using a FluoroMax-3 spectrofluorometer (HORIBA Jobin Yvon, Inc., Edison, NJ) equipped with a circulating water bath for temperature control. Fluorescence intensity values (I) corresponding to unphosphorylated protein (I0) and phosphorylated protein (If) were determined from the buffer- and dilution-corrected fluorescence intensities at 345 nm taken from the emission spectra of PhoB without PA and after 1800 s of incubation with PA. The fraction of phosphorylated protein at time t was calculated as (It − I0)/(If − I0).
Phosphoprotein Affinity Gel Electrophoresis
Phos-tagTM acrylamide gels (7 × 8 × 0.075 cm) were prepared as described previously (36). Briefly, Phos-tagTM acrylamide running gels contained 10% (w/v) 29:1 acrylamide/N,N′-methylenebisacrylamide, 375 mm Tris (pH 8.8), and 0.1% (w/v) SDS. Gels were copolymerized with 75 μm Phos-tagTM acrylamide and 150 μm MnCl2. Stacking gels contained 4% (w/v) 29:1 acrylamide/N,N′-methylenebisacrylamide, 125 mm Tris (pH 6.8), and 0.1% (w/v) SDS. All Phos-tagTM acrylamide-containing gels were run with standard denaturing running buffer (0.4% (w/v) SDS, 25 mm Tris, and 192 mm glycine) at 4 °C under constant voltage (160 V). The fraction of phosphorylated protein in each gel lane was determined by monitoring the Coomassie Blue staining intensity for the upshifted (phosphorylated) protein band in each lane relative to the total staining intensity for both bands (total protein) in the lane.
RR Dephosphorylation Analysis
His6-tagged PrrA, PrrAN, DrrB, and DrrBN were each phosphorylated by PA as follows. 750-μl solutions of 12 μm PrrA, 60 μm PrrAN, 15 μm DrrB, or 15 μm DrrBN were prepared in reaction buffer (50 mm Tris (pH 7.5), 100 mm NaCl, 2 mm BME, and 10 mm MgCl2) containing either 20 mm PA (PrrAN experiments) or 60 mm PA (all other experiments). PrrA, PrrAN, and DrrBN solutions were incubated at room temperature for 45 min, and DrrB was incubated at 60 °C for 20 min and at room temperature for 5 min. 150 μl (PrrAN) or 50 μl (all other proteins) of nickel-nitrilotriacetic acid-agarose beads (Qiagen) were added to the reaction solution. After 10 min to allow all proteins to bind to the beads, the samples were centrifuged at 2000 × g for 1 min to pellet the beads, and the supernatant was removed. The samples were washed three times with reaction buffer, with the beads being centrifuged and the supernatant removed each time. Samples were eluted from the beads using 333 mm imidazole, 33 mm Tris (pH 7.5), 67 mm NaCl, and 6.7 mm MgCl2. Samples were diluted 1:3 in reaction buffer. To monitor the extent of protein phosphorylation, 15-μl aliquots from each reaction solution were quenched at 10–15-min intervals by the addition of 5 μl of 4× SDS loading buffer. The extent of protein phosphorylation was determined using phosphoprotein affinity gel electrophoresis. The rate of RR autodephosphorylation was determined from the slope of the best fit lines for plots of the natural logarithm of the fraction of phosphorylated protein versus time.
Autophosphorylation of PrrBHDC and Phosphotransfer Analysis
PrrBHDC∼P was prepared by adding 2 mm ATP to a reaction solution containing 20 μm PrrBHDC in 10 mm Tris (pH 8.0), 5 mm MgCl2, and 50 mm KCl and incubating the solution at 35 °C for 90 min, followed by incubation at room temperature for an additional 90 min. This reaction resulted in >50% phosphorylation of PrrBHDC (data not shown). The solution was then cooled to 4 °C for subsequent experiments to prevent additional rounds of phosphorylation of PrrBHDC by unreacted ATP and also to slow the phosphotransfer reaction, thereby allowing an accurate rate to be determined without using stopped-flow techniques. Phosphotransfer experiments were initiated by mixing the above solution of ATP-treated PrrBHDC with an equal volume of either 40 μm PrrA or 40 μm PrrAN in the same buffer. PrrBHDC dephosphorylation was monitored by removing and immediately quenching 15-μl aliquots of each reaction solution by the addition of 5 μl of 4× SDS loading buffer at 10, 20, 30, 40, 50, 90, 120, 180, 300, 600, and 1200 s following initiation of the reaction. The extent of protein phosphorylation was determined using phosphoprotein affinity gel electrophoresis, and the rate of PrrBHDC∼P-mediated RR phosphorylation was determined from the first-order exponential decay fits for plots of the fraction of PrrBHDC∼P versus time.
RESULTS
Structures of DrrBN, DrrDN, and MtrAN
Structures of isolated OmpR/PhoB family receiver domains stabilized in their active conformations either by high protein concentrations or by the presence of the noncovalently associated phosphoryl analog beryllofluoride (37) have been reported previously (20–25, 38). However, no such structures have been determined for RRs for which structures of the inactive full-length proteins are also known. As noted previously, the interdomain interfaces in most inactive OmpR/PhoB RRs determined to date involve the α4-β5-α5 face of the receiver domain, a surface that is also essential for formation of the active-state α4-β5-α5 dimer that is proposed to be common to most all OmpR/PhoB RRs. To explore whether this active-state dimer is adopted by OmpR/PhoB RRs regardless of the involvement of the α4-β5-α5 face of the receiver domain in interdomain interfaces in the inactive state, we determined a set of isolated receiver domain structures for three OmpR/PhoB family proteins for which structures of inactive full-length proteins are available, T. maritima DrrB and DrrD and M. tuberculosis MtrA (Fig. 1A) (16–18).
FIGURE 1.

Structures of DrrD, DrrB. and MtrA. A, ribbon depictions of full-length T. maritima DrrD and DrrB and M. tuberculosis MtrA (Protein Data Bank codes 1KGS, 1P2F, and 2GWR) presumed to be in inactive conformations. Surfaces (shown in white) illustrate differences in the extent of interdomain interfaces. B, ribbon depictions of the corresponding receiver domain dimers (Protein Data Bank codes 3NNS, 3NNN, and 3NHZ) with protomers colored blue and green. Structures of DrrD and DrrB receiver domains were determined in the presence of the phosphoryl analog BeF3−, shown in ball-and-stick mode, and are presumed to be in active conformations. All structures are aligned relative to the blue receiver domain. Asp residues at the sites of phosphorylation and the conserved Thr and Tyr switch residues in the receiver domains are shown in ball-and-stick depictions. In full-length DrrB and MtrA, Asp residues in the effector domains that form hydrogen bonds with the conserved Tyr residues are also shown.
The structures of the isolated receiver domains of DrrB, DrrD, and MtrA, henceforth referred to as DrrBN, DrrDN, and MtrAN, respectively, are shown in Fig. 1B. DrrBN and DrrDN were maintained in their activated conformations by the presence of BeF3−, whereas crystals of MtrAN were obtained only in the absence of BeF3−. Clear electron density for BeF3− is present at the active sites of DrrBN and DrrDN, although the electron density is weaker for DrrDN, suggesting partial occupancy. In these two proteins, the conserved Thr and Tyr switch residues are in orientations characteristic of activated receiver domains, distinct from the orientations observed in the corresponding inactive full-length proteins. All three proteins form symmetric dimers with an interface between the α4-β5-α5 faces of the individual receiver domains, similar to the dimeric structure observed for other isolated receiver domains of OmpR/PhoB RRs (20–25, 38).
Despite the overall similarities in the receiver domain dimers, there are some notable differences. The orientation of the two receiver domains in MtrAN is skewed, with one protomer rotated by ∼50° about an axis perpendicular to the plane of the α4-β5-α5 face relative to the corresponding protomer of other OmpR/PhoB receiver domain dimers (Fig. 2). Although the Cα atoms of the individual protomers of MtrAN and DrrBN align well with a root mean square distance of 0.89 Å, the dimers align poorly with a root mean square distance of 5.7 Å. A very similar skewed orientation has been observed in structures of Bacillus subtilis YycF receiver domains (Protein Data Bank codes 2ZWM and 3F6P) (38), which can be aligned with MtrAN as a monomer or dimer with root mean square distances for Cα atoms of 0.60 and 0.92 Å, respectively.
FIGURE 2.

Dimer interfaces of MtrA and BeF3−-activated DrrB receiver domains. A and B, ionic and hydrophobic interactions, respectively, at dimer interfaces. The α4-β5-α5 regions of two protomers (blue and green) are shown as ribbon depictions, with conserved charged residues that participate in intra- and/or intermolecular salt bridges (dashed lines) shown in stick format and hydrophobic residues involved in intermolecular contacts shown in spheres (carbons, blue and green; nitrogens, blue; oxygens, white). Tyr switch residues (white spheres) are oriented away from the interface in DrrB and form the central contact of the interface in MtrA. All dimers are aligned relative to the green protomer, illustrating the ∼50° rotation of the blue protomer around an axis perpendicular to the plane of the interface. C, conserved switch residues in DrrB and MtrA. Asp residues at the site of phosphorylation and conserved Thr and Tyr switch residues in inactive DrrB (blue), active DrrB (green), and MtrA (gold) are displayed on backbone traces of aligned receiver domains. Orientations of the Thr and Tyr residues in MtrA are similar to those observed in inactive receiver domains.
The skewed orientations of MtrAN and YycFN (N-terminal receiver domain residues 1–120) result in interfaces that, despite sequence conservation of charged residues, retain only the central salt bridge of the extensive ionic interactions that are conserved in the α4-β5-α5 interfaces of most other OmpR/PhoB RRs (Fig. 2A). The conserved network of salt bridges is also altered in DrrBN, in which the charged residues of one of the highly conserved salt bridges are substituted by a Val-Ile pair that expands the hydrophobic contact at the domain interface (Fig. 2, A and B). Additional contacts unique to MtrAN and YycFN appear to stabilize the skewed dimer. Prominent among these are the hydrophobic interactions of the aromatic switch residues (Tyr102 in MtrAN and Tyr98 in YycFN) that project outward from the α4-β5-α5 surfaces in orientations corresponding to the rotameric states of inactive receiver domains (Fig. 2B). Likewise, the conserved Thr switch residues adopt orientations characteristic of inactive receiver domains (Fig. 2C). Thus, although unactivated MtrA and YycF receiver domains are capable of dimerizing when the DBDs are removed, they do not appear to adopt fully activated states, as has been observed previously for other OmpR/PhoB RRs in the absence of phosphoryl analogs (22, 24). It seems likely that reorientation of the conserved Tyr side chain toward the protein interior upon phosphorylation would allow both MtrA and YycF to adopt the same α4-β5-α5 dimer interface and ionic interaction network of conserved charged residues that typify most other OmpR/PhoB RR active dimers.
The previously determined structures of inactive full-length DrrB, DrrD, and MtrA reveal remarkably different interdomain interfaces between the receiver and DNA-binding domains. Despite its short interdomain linker, DrrD has an interdomain interface of only 250 Å2 (17), much less than the minimum surface area expected for a physiologically relevant stable protein interface (39). The absence of an interdomain interface has not been observed in any other crystal structures of inactive OmpR/PhoB RRs, likely reflecting a bias in the structural data base toward proteins most amenable to crystallization. In contrast, both DrrB and MtrA display tightly packed interfaces that bury 750 and 720 Å2, respectively (16, 18), similar to interfaces in most other structurally characterized OmpR/PhoB family RRs (19).
Many of the residues involved in contacts between protomers of the DrrBN and MtrAN dimers characterized in this study (Fig. 1B) are also involved in contacts between the N- and C-terminal domains in the inactive full-length proteins (16, 18). Thus, substantial rearrangements of the domains must occur in transitions between inactive and active states. Furthermore, in both proteins, the inactive conformation is stabilized by an interdomain hydrogen bond that involves the conserved Tyr residue in the receiver domain (Tyr97–Asp131 and Tyr102–Asp190 in DrrB and MtrA, respectively) (Fig. 1A) (16,18). This hydrogen bond must be broken to allow dimerization through the α4-β5-α5 face.
Unlike inactive DrrB, inactive DrrD contains few intramolecular interactions that would prevent the receiver domain from obtaining an active conformation. The orientations of the conserved Thr81 and Tyr100 residues in the receiver domain of full-length DrrD are different from those in the structure of BeF3−-activated DrrDN but deviate from the orientations of switch residues observed in most other inactive receiver domains. Although the intermediate orientations of the switch residues are possibly influenced by packing interactions in the crystal lattice, they provide evidence for the plasticity of the inactive receiver domain when unconstrained by interdomain contacts.
Determination of Protein Autophosphorylation Rates
To assess the influence of interdomain interfaces on the propensity for phosphorylation, the extent and rate of phosphotransfer from the small molecule phosphodonor PA to structurally characterized OmpR/PhoB RRs were determined. Multiple previously documented techniques for monitoring RR phos-phorylation (34–36) were employed because of the large variation in autophosphorylation rates among RRs, requiring seconds to hours to achieve steady-state levels. Autophosphorylation of T. maritima DrrB and DrrD, RRs with very different interdomain interfaces, was characterized using Phos-tagTM acrylamide gel electrophoresis. The extent of autophosphorylation for DrrB, DrrD, and the corresponding isolated receiver domains (DrrBN and DrrDN) is shown in Fig. 3. DrrB remained nearly completely unphosphorylated even after 20 min of treatment with PA as evidenced by the absence of an upshifted band in the Phos-tagTM gels in Fig. 3A. Conversely, DrrD became nearly completely phosphorylated under these conditions as evidenced by the disappearance of the lower band and the appearance of the upper band in the gels depicted in Fig. 3B. Both DrrBN and DrrDN autophosphorylated readily, reaching nearly complete phosphorylation in 10 and 20 min, respectively, following the addition of PA (Fig. 3, A and B). The slow rate of phosphorylation of DrrB relative to that of DrrBN in contrast to the similar rates of phosphorylation for DrrD and DrrDN is consistent with the hypothesis that interdomain interactions inhibit autophosphorylation. This inhibition is relieved in isolated receiver domains and in full-length RRs that lack substantial interdomain interfaces.
FIGURE 3.

Autophosphorylation of DrrB, DrrD, and their isolated receiver domains. A, phosphoprotein affinity gel electrophoresis using Phos-tagTM acrylamide gel electrophoresis separation of DrrB∼P from DrrB and DrrBN∼P from DrrBN (upper and lower gels, respectively). B, similar gels depicting the separation of DrrD∼P from DrrD and DrrDN∼P from DrrDN (upper and lower gels, respectively). In both A and B, lanes 1–9 correspond to samples collected 0, 20, 40, 60, 90, 120, 300, 600, and 1200 s following the addition of PA. Each autophosphorylation reaction was performed with 10 μm RR and 20 mm PA in 50 mm Tris, 100 mm NaCl, 10 mm MgCl2, and 2 mm BME at pH 7.5. At the indicated time points, 15-μl aliquots were removed from the reaction solution and mixed with 5 μl of 4× SDS loading buffer (0.8% (w/v) SDS, 250 mm Tris (pH 6.8), 4% (v/v) glycerol, 0.08% (v/v) bromphenol blue, and 572 mm BME) to stop the reactions. C and D, plots of the corrected fraction of phosphorylated DrrB (●) and DrrBN (○) (C) and DrrD (●) and DrrDN (○) (D) versus incubation time with PA. In each plot, the fraction of phosphorylated protein from each time point was characterized using the average of at least three independent phosphoprotein affinity gel electrophoresis experiments, with error bars representing S.D. Solid and dashed lines depict the first-order exponential decay fit of the indicated points for the full-length and isolated receiver domains, respectively.
Analysis of autophosphorylation was performed on additional RRs. Autophosphorylation rates in the presence of PA were determined by plotting the extent of RR phosphorylation as a function of time and fitting with a single exponential decay, yielding an observed rate of autophosphorylation (kobs) as described under “Experimental Procedures” (for representative plots, see Fig. 3, C and D). The kobs value provides a useful numerical method for comparing the autophosphorylation rates of RRs with those of their isolated receiver domains and also with each other. Table 1 lists the observed autophosphorylation rates for DrrB, DrrD, MtrA, PrrA, and PhoB and for their isolated receiver domains. The ratio of the kobs values for the receiver domain versus the full-length form of each RR facilitates comparison of the different RRs. The full-length forms of MtrA and PrrA, like DrrB, have low rates of phosphorylation. It is notable that these three proteins all have extensive interdomain interfaces, and in each of these slowly phosphorylating proteins, removal of the DBD enhances the autophosphorylation rate by >9-fold.
TABLE 1.
Experimentally determined rates associated with autophosphorylation reactions of RR proteins
| Protein | Domain interfacea | kobs | kobsN/kobsFullb | kdephos, k3 | Techniquec |
|---|---|---|---|---|---|
| Å2 | min−1 | min−1 | |||
| DrrB | 750 | <0.01 | >100 | 0.09 ± 0.01 | HPLC |
| DrrBN | 0.97 ± 0.04 | 0.09 ± 0.01 | Phos-tagTM | ||
| DrrD | 250 | 0.10 ± 0.01 | 0.7 | Phos-tagTM | |
| DrrDN | 0.07 ± 0.01 | Phos-tagTM | |||
| PhoB | Unknown | 0.45 ± 0.01 | 1.0 | Fluorescence | |
| PhoBN | 0.44 ± 0.01 | Fluorescence | |||
| MtrAd | 720 | 0.014 ± 0.005 | 10.7 | 32P incorporation | |
| MtrAN | 0.15 ± 0.02 | Phos-tagTM | |||
| PrrA | 820 | 0.028 ± 0.010 | 9.2 | 0.06 ± 0.01 | HPLC |
| PrrAN | 0.26 ± 0.01 | 0.04 ± 0.01 | HPLC |
a The interdomain interface areas were calculated using AREAIMOL in the CCP4 suite (62).
b The ratio of kobs for the isolated N-terminal domain (kobsN) versus kobs for the full-length RR (kobsFull) was used to compare the effects of domain interactions on RR autophosphorylation between different proteins.
c The various techniques used for determining the rates of autophosphorylation for RR proteins are indicated as follows: HPLC, Phos-tagTM (phosphoprotein affinity gel electrophoresis), fluorescence (phosphorylation-induced changes in intrinsic tryptophan fluorescence), and 32P incorporation (radiometric analysis of 32P phosphotransfer from [32P]phosphoramidate). Descriptions of these techniques are given under “Experimental Procedures.”
d Previously reported data for autophosphorylation of MtrA (16) were quantitated as described under “Experimental Procedures” (Equation 1).
DrrD, which lacks an extensive interface, phosphorylates readily in both full-length and truncated forms. PhoB, for which the structure has not been determined, exhibits similar phosphorylation behavior. The similarity in phosphorylation kinetics for full-length PhoB and the isolated receiver domain suggests that PhoB might lack an extensive domain interface. Further support for a weak interdomain interface has been obtained from NMR analyses. The transverse relaxation optimized spectroscopy-heteronuclear single quantum coherence spectrum of inactive full-length PhoB superimposes almost exactly with the combined spectra of the isolated receiver and DNA-binding domains, suggesting that there are no extensive interactions between the two domains (40).
Although misfolding of full-length RRs is a possible explanation for the low autophosphorylation activity of DrrB, MtrA, and PrrA, several observations argue against this. All of the proteins behave homogeneously during purification, with no evidence of aggregation. Furthermore, concentrated solutions of these proteins readily yield crystals of native protein under appropriate crystallization conditions. Importantly, the low stoichiometry of phosphorylation at steady state can be increased to >50% by manipulating the reaction conditions, either by increasing the reaction temperature or by increasing the concentration of PA in the reaction (see below). The latter observation is consistent with previous studies showing that RR phosphorylation is linearly dependent on phosphodonor concentration because of the very low affinity of RRs for small molecule phosphodonors (41). Thus, the low stoichiometries of phosphorylation observed under the experimental conditions in this study do not result from limiting quantities of native protein available for phosphorylation but rather reflect low rates of phosphorylation relative to the rates of dephosphorylation.
Influence of the DBD on Autodephosphorylation Rate
Removal of the DBD enhances the observed rate of autophosphorylation for three of the five RRs examined. However, it is possible that this effect results from altered rates of dephosphorylation of the RR receiver domain because the kobs value is dependent on both the rate of phosphotransfer from PA and the rate of dephosphorylation of the RR. To address the contributions of these two opposing rates, dephosphorylation rates (kdephos) were measured for PrrA and DrrB, two of the RRs that have increased kobs values when the DBD is removed (Fig. 4). Both full-length proteins and their isolated receiver domains were phosphorylated with PA. To enhance the extent of phosphorylation of the full-length proteins to >50%, either the PA concentration was increased (for PrrA) or the incubation temperature was raised (for DrrB). After removing unreacted PA by affinity chromatography, the rate of dephosphorylation of each protein was measured using phosphoprotein affinity gel electrophoresis following quenching of the autodephosphorylation reaction by denaturation with SDS. The kdephos values listed in Table 1 demonstrate that, for PrrA and DrrB, the presence of the DBD does not significantly alter kdephos, confirming that the differences in kobs between full-length RRs and isolated receiver domains reflect an effect on autophosphorylation rates rather than dephosphorylation rates.
FIGURE 4.
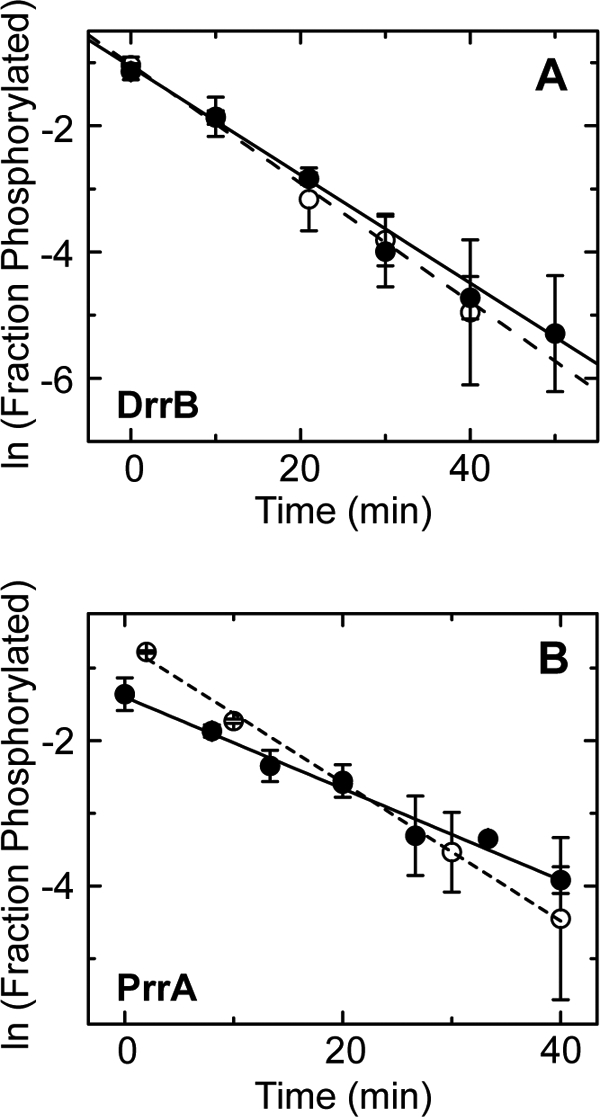
Rate of autodephosphorylation of DrrB, PrrA, and their isolated receiver domains. A and B, plots of the natural logarithm of the observed fraction of phosphorylated DrrB (●) and DrrBN (○) (A) and PrrA (●) and PrrAN (○) (B) at various times after removal of the phosphodonor (PA). Solid and dashed lines represent the best fit linear regression of the plots of the full-length RRs and isolated receiver domains, respectively. Each data point represents the average of two independent measurements, with error bars indicating S.D.
PrrB-mediated Phosphotransfer to PrrA
Small molecule phosphodonors such as acetyl phosphate are thought to be minor contributors to the overall phosphorylation state of most RRs within cells (42–45). The major route of RR phosphorylation is through phosphotransfer from cognate HKs. To determine whether the inhibitory effects of interdomain interactions on receiver domain autophosphorylation by small molecule phosphodonors are also applicable to HK-mediated RR phosphorylation, phosphotransfer from the cytoplasmic domain of PrrB (PrrBHDC), the cognate HK of PrrA, to full-length PrrA and PrrAN was characterized. Phosphotransfer from phosphorylated PrrBHDC to the PrrA proteins was assayed by measuring the decrease in the fraction of phosphorylated PrrBHDC, as shown in Fig. 5. The studies were performed at 4 °C to ensure that the phosphotransfer rate was in the appropriate time scale for measurement using available techniques. The kobs value for PrrA phosphorylation via PrrB was 0.011 ± 0.001 min−1, whereas that for PrrAN phosphorylation was 0.008 ± 0.001 min−1. These values are nearly within the experimental error, demonstrating that, unlike the case with small molecule phosphodonors, interdomain interactions do not inhibit RR phosphorylation via a cognate HK.
FIGURE 5.
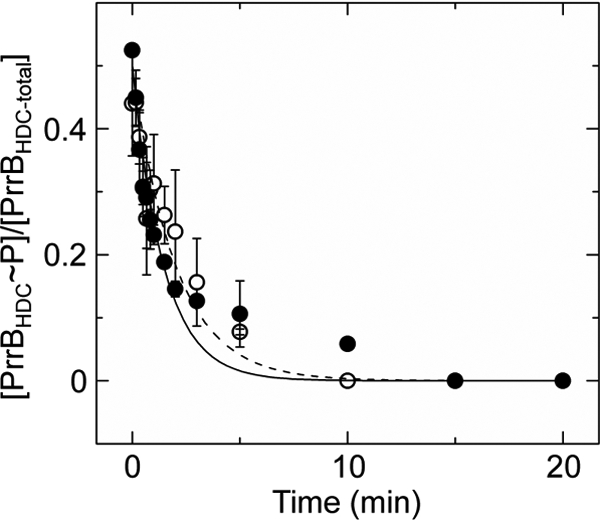
Rate of phosphotransfer from PrrBHDC to PrrA and PrrAN. Shown is a plot of the fraction of phosphorylated PrrBHDC observed at various time points following incubation with PrrA (●) or PrrAN (○). Solid and dashed lines depict the first-order exponential decay fits using PrrA and PrrAN as the phosphoacceptors, respectively. Each data point represents the average of at least two independent experiments, with error bars representing S.D.
DISCUSSION
Interactions That Alter RR Protein Dynamics Modulate Autophosphorylation
Substantial differences in rates of autophosphorylation occur among the different RRs characterized in this study. To a first approximation, the OmpR/PhoB RRs can be grouped into two distinct classes based on observed autophosphorylation rates: 1) RRs that are readily phosphorylatable (e.g. DrrD and PhoB) and 2) RRs that are poorly phosphorylatable (e.g. DrrB, MtrA, and PrrA). Interestingly, these groupings correlate with an obvious feature of the structurally characterized RRs (DrrD, DrrB, MtrA, and PrrA), specifically the extent of the interdomain interface of the proteins in their inactive states. Proteins that phosphorylate poorly have substantial interdomain interfaces. It should be noted that the class of RRs that are readily phosphorylatable contains only one structurally characterized RR, likely reflecting the difficulty of crystallizing proteins with multiple domains that lack fixed orientations. However, the additional finding that removal of the DBD significantly enhances the rate of autophosphorylation for the poorly phosphorylatable RRs with extensive interdomain interfaces but not for the readily phosphorylatable RRs that lack substantial interfaces strongly suggests that interdomain interactions inhibit autophosphorylation.
Despite the observation that RRs with substantial interdomain interactions have diminished rates and extents of phosphorylation, structural models show few direct contacts between residues at the domain interface and the catalytic residues required for phosphorylation (16, 18, 19). It seems likely that the interdomain interactions observed in the poorly phosphorylatable RRs stabilize a conformation that is not catalytically competent, whereas RRs with weak interdomain interactions, like isolated receiver domains, have fewer conformational constraints preventing adoption of a phosphorylatable conformation.
Unphosphorylated receiver domains have been shown to exist in a concentration-independent equilibrium between at least two distinct conformational states, with the minor population resembling that of the phosphorylated form and designated the active conformation (4, 5, 7, 15, 46, 47). Our data are consistent with the hypothesis that catalysis of phosphorylation by small molecule phosphodonors occurs in a subpopulation of the unphosphorylated receiver domains that pre-exist in an active conformation. This hypothesis has precedent in the conclusions reached by Kern and co-workers (11) in their studies of the prolyl cis,trans-isomerase cyclophilin A. Using NMR relaxation techniques (48), they correlated conformational dynamics with enzyme activity and concluded that catalysis occurs only within a minor subpopulation of the cyclophilin A molecules that pre-exist in a catalytically competent conformation, analogous to the substrate-bound form. Our study of OmpR/PhoB RRs provides another example in which conformational rearrangements appear to be the rate-limiting step in catalysis.
The schematic reaction diagram depicted in Fig. 6 links the conformational energetics of RR proteins to their ability to undergo autophosphorylation by small molecule phosphodonors. In this model, the rearrangement into a phosphorylatable conformation is a major energetic barrier to the phosphorylation reaction. The extent of this barrier to phosphorylation can be modulated by RR interdomain interactions. To adopt a phosphorylatable conformation, RRs with more extensive interfaces have a greater energetic barrier to overcome than RRs with less extensive interdomain interfaces. Thus, RRs with more extensive interfaces have a lower initial free energy. This initial free energy defines the magnitude of the phosphorylation activation free energy (ΔG‡) if the high energy transition state (Fig. 6, starburst) is assumed to be similar for all RRs regardless of their initial steady-state conformation (Fig. 6, oval).
FIGURE 6.

Contribution of coupled conformational equilibria to the energetics of RR autophosphorylation reactions. The conformational change of a RR receiver domain from an unphosphorylatable (oval) to a phosphorylatable (starburst) conformation is a rate-limiting step in the RR autophosphorylation reaction. The energetic cost of this conformational change is modulated by RR interdomain interactions. Multiple interdomain orientations and strengths of interaction exist (represented by the dotted lines), with strength of the interdomain interaction correlating directly to the activation free energy (ΔG‡) of the reaction (dotted arrow). Note that the overall reaction has a favorable free energy change (ΔG° < 0) due to the hydrolysis of the small molecule phosphodonor.
Although this study has focused on interdomain interactions that stabilize the inactive conformation of receiver domains, these interactions are not the sole regulatory mechanisms for modulating the activation energy for RR autophosphorylation. Any intra- or intermolecular interactions that stabilize or destabilize one of the conformational states of the receiver domain and thus alter the population distribution of the active and inactive substates of the protein would be expected to alter the rate of RR autophosphorylation. Indeed, autophosphorylation of OmpR has been shown to increase in the presence of oligonucleotides that contain OmpR recognition sequences (49). Our own analyses of this transcription factor concur with these findings and further show that the autophosphorylation rate of DNA-bound OmpR is faster than that of not only OmpR alone but also than that of the isolated receiver domain of OmpR.5 These observations are consistent with the notion that DNA binding stabilizes the active conformation, biasing the conformational equilibrium and increasing the population of OmpR molecules that exist in a catalytically competent state.
These findings provide examples of domain interactions that influence enzymatic reactions through their modulation of protein dynamics. The inhibitory and activating domain interactions described are not likely restricted solely to the proteins studied here and are expected to occur broadly throughout the entire family of RR proteins as well as in other enzymes. The interplay of inhibitory and activating intra- and intermolecular domain interactions might be an important strategy contributing to the regulation of signaling activities of RR proteins.
Manipulation of Conformational Equilibria Can Be a Useful Tool for Biochemical and Structural Studies
It has been described here and observed elsewhere, although often unpublished, that some RRs are not readily phosphorylated using small molecule phosphodonors. In some cases, deviations in conserved active-site residues clearly indicate that the RRs have evolved to function independently of phosphorylation (50–53). However, in other cases in which active sites are retained, the inability to be phosphorylated by small molecule phosphodonors has possibly been misinterpreted to suggest that phosphotransfer is not an essential signaling mechanism for these proteins. In these RRs, the inhibitory effects of interdomain interactions provide an alternative explanation for the absence of observable autophosphorylation.
Our analysis of PrrA demonstrates that the inhibitory effects of domain interfaces do not impact phosphotransfer from the cognate HK to the RR. Thus, analysis of phosphorylation in vitro using HK-RR pairs is presumably a robust method for assessing the potential for RR phosphorylation. However, in some cases, the cognate HK is unknown, or the transmembrane HK or suitable soluble domains cannot be purified in a functional state. In such cases, if RRs are found not to be phosphorylatable by small molecule phosphodonors, removal of the effector domain of the RR might provide a simple method for verifying whether the receiver domain is capable of phosphorylation.
It is apparent from the available structures of full-length RRs that domains are arranged differently in different RRs even among RRs of a single subfamily with similar domain architectures. Knowledge of domain arrangements is important to understanding function because distinct inhibitory or activating protein-protein interactions specific to the inactive or active states enable different regulatory strategies (54). Unfortunately, structures of full-length RRs are few compared with those of isolated RR domains. Additionally, these structures are biased toward proteins amenable to crystallization, likely favoring those with interdomain interfaces over those with domains connected by flexible linkers. The observed correlation between reduced autophosphorylation rates of full-length RRs relative to isolated receiver domains and the presence of interdomain interfaces suggests that autophosphorylation kinetics might provide a simple biochemical method for inferring the strength of interdomain interfaces involving receiver domains in individual RRs.
Roles for Interactions That Influence the Conformational Dynamics of RRs
Interdomain interfaces involving receiver domains can potentially influence RR activity in many different ways. Interfaces in inactive RRs that sterically block access to functional regions of effector domains, such as the recognition helices of transcription factors, ensure a very low level of basal activity in the unphosphorylated protein. In inactive RRs of the OmpR/PhoB family, interfaces with effector domains involve the α4-β5-α5 face of the receiver domain, making the effector domain essentially a competitive inhibitor of the active-state dimer. This study has demonstrated yet another way that interdomain interfaces can pose a barrier to RR activation, specifically by restricting the conformational dynamics required for phosphorylation by small molecule phosphodonors.
The inhibition of catalysis by interdomain interfaces is specific to autophosphorylation and does not occur during phosphotransfer between HK-RR pairs, at least in the case of phosphotransfer from PrrB to PrrA. This difference has several possible origins that individually or in combination might account for the different effects of interdomain interfaces on small molecule- and HK-mediated phosphorylation of RRs. Phosphotransfer occurs within an HK-RR complex, and interactions between the HK and RR might stabilize a catalytically competent conformation of the receiver domain. Indeed, in the recently reported structure of a T. maritima HK-RR complex, the receiver domain adopts an active conformation despite the absence of phosphorylation or a phosphoryl mimic (55). Also, within the HK-RR complex, both proteins contribute residues to the active site of phosphotransfer, and it is possible that the catalytic mechanism and/or transition state differs between autophosphorylation and phosphotransfer reactions. However, kinetic analyses suggest that the approximately thousandfold greater rate observed for HK-mediated relative to small molecule-mediated phosphorylation of RRs can be explained primarily by the productive docking of the phosphoryl substrate in the RR active site that occurs upon HK-RR interaction without invoking a different catalytic mechanism (41). In this context, our data suggest that interdomain interfaces influence substrate binding, a step that is rate-limiting for phosphorylation from small molecule phosphodonors but not for phosphotransfer from phosphohistidine residues within HK-RR complexes. This interpretation coincides with the emerging view that ligands or substrates bind to distinct conformational isomers that pre-exist within conformationally diverse populations. This conformational selection model is gaining favor over both the lock-and-key and induced-fit models of protein-ligand interactions (for reviews, see Refs. 56–58).
Although phosphotransfer from cognate HKs is the primary mechanism for phosphorylation of most RRs in vivo, phosphorylation by acetyl phosphate is thought to contribute to the regulation of some RRs (for review, see Ref. 45). Intracellular levels of acetyl phosphate vary greatly under different growth conditions, with concentrations in E. coli estimated to range from <40 μm to ∼3 mm, the latter being sufficiently high to enable RR autophosphorylation (44, 59). Acetyl phosphate has been shown to regulate the activities of several RRs in the absence of RR phosphatase activity of cognate HKs, and it has been postulated that in, the presence of HKs, acetyl phosphate might contribute to basal phosphorylation of some RRs, altering the sensitivity of the response (44). Furthermore, acetyl phosphate has been shown to be an important regulator of a few specific two-component systems, presumably functioning through direct phosphorylation of RRs (60, 61). Thus, interdomain interfaces that inhibit autophosphorylation have the potential to serve a physiological role, providing a mechanism to maintain signal specificity in two-component systems by insulating some RRs from activation by small molecule phosphodonors.
Acknowledgments
We thank Ti Wu for assistance with protein purification and the staff at beamlines X4A and X4C at the National Synchrotron Light Source at Brookhaven National Laboratory for assistance with x-ray diffraction data collection.
This work was supported, in whole or in part, by National Institutes of Health Grant R37GM047958 (to A. M. S.).
This article was selected as a Paper of the Week.

The on-line version of this article (available at http://www.jbc.org) contains supplemental Tables S1 and S2.
The atomic coordinates and structure factors (codes 3NNS, 3NNN, and 3NHZ) have been deposited in the Protein Data Bank, Research Collaboratory for Structural Bioinformatics, Rutgers University, New Brunswick, NJ (http://www.rcsb.org/).
C. M. Barbieri, unpublished data.
- HK
- histidine kinase
- RR
- response regulator
- DBD
- DNA-binding domain
- BME
- β-mercaptoethanol
- PA
- phosphoramidate.
REFERENCES
- 1.Hoch J. A., Silhavy T. J. (eds) (1995) Two-component Signal Transduction, American Society for Microbiology Press, Washington, DC [Google Scholar]
- 2.Stock A. M., Robinson V. L., Goudreau P. N. (2000) Annu. Rev. Biochem. 69, 183–215 [DOI] [PubMed] [Google Scholar]
- 3.Gao R., Mack T. R., Stock A. M. (2007) Trends Biochem. Sci. 32, 225–234 [DOI] [PMC free article] [PubMed] [Google Scholar]
- 4.Volkman B. F., Lipson D., Wemmer D. E., Kern D. (2001) Science 291, 2429–2433 [DOI] [PubMed] [Google Scholar]
- 5.Nohaile M., Kern D., Wemmer D., Stedman K., Kustu S. (1997) J. Mol. Biol. 273, 299–316 [DOI] [PubMed] [Google Scholar]
- 6.Schuster M., Silversmith R. E., Bourret R. B. (2001) Proc. Natl. Acad. Sci. U.S.A. 98, 6003–6008 [DOI] [PMC free article] [PubMed] [Google Scholar]
- 7.Simonovic M., Volz K. (2001) J. Biol. Chem. 276, 28637–28640 [DOI] [PubMed] [Google Scholar]
- 8.Da Re S., Tolstykh T., Wolanin P. M., Stock J. B. (2002) Protein Sci. 11, 2644–2654 [DOI] [PMC free article] [PubMed] [Google Scholar]
- 9.Guhaniyogi J., Robinson V. L., Stock A. M. (2006) J. Mol. Biol. 359, 624–645 [DOI] [PMC free article] [PubMed] [Google Scholar]
- 10.Dyer C. M., Dahlquist F. W. (2006) J. Bacteriol. 188, 7354–7363 [DOI] [PMC free article] [PubMed] [Google Scholar]
- 11.Eisenmesser E. Z., Millet O., Labeikovsky W., Korzhnev D. M., Wolf-Watz M., Bosco D. A., Skalicky J. J., Kay L. E., Kern D. (2005) Nature 438, 117–121 [DOI] [PubMed] [Google Scholar]
- 12.Henzler-Wildman K., Kern D. (2007) Nature 450, 964–972 [DOI] [PubMed] [Google Scholar]
- 13.Henzler-Wildman K. A., Lei M., Thai V., Kerns S. J., Karplus M., Kern D. (2007) Nature 450, 913–916 [DOI] [PubMed] [Google Scholar]
- 14.Henzler-Wildman K. A., Thai V., Lei M., Ott M., Wolf-Watz M., Fenn T., Pozharski E., Wilson M. A., Petsko G. A., Karplus M., Hübner C. G., Kern D. (2007) Nature 450, 838–844 [DOI] [PubMed] [Google Scholar]
- 15.Gardino A. K., Villali J., Kivenson A., Lei M., Liu C. F., Steindel P., Eisenmesser E. Z., Labeikovsky W., Wolf-Watz M., Clarkson M. W., Kern D. (2009) Cell 139, 1109–1118 [DOI] [PMC free article] [PubMed] [Google Scholar]
- 16.Friedland N., Mack T. R., Yu M., Hung L. W., Terwilliger T. C., Waldo G. S., Stock A. M. (2007) Biochemistry 46, 6733–6743 [DOI] [PMC free article] [PubMed] [Google Scholar]
- 17.Buckler D. R., Zhou Y., Stock A. M. (2002) Structure 10, 153–164 [DOI] [PubMed] [Google Scholar]
- 18.Robinson V. L., Wu T., Stock A. M. (2003) J. Bacteriol. 185, 4186–4194 [DOI] [PMC free article] [PubMed] [Google Scholar]
- 19.Nowak E., Panjikar S., Konarev P., Svergun D. I., Tucker P. A. (2006) J. Biol. Chem. 281, 9659–9666 [DOI] [PubMed] [Google Scholar]
- 20.Bent C. J., Isaacs N. W., Mitchell T. J., Riboldi-Tunnicliffe A. (2004) J. Bacteriol. 186, 2872–2879 [DOI] [PMC free article] [PubMed] [Google Scholar]
- 21.Toro-Roman A., Mack T. R., Stock A. M. (2005) J. Mol. Biol. 349, 11–26 [DOI] [PMC free article] [PubMed] [Google Scholar]
- 22.Toro-Roman A., Wu T., Stock A. M. (2005) Protein Sci. 14, 3077–3088 [DOI] [PMC free article] [PubMed] [Google Scholar]
- 23.Bachhawat P., Swapna G. V., Montelione G. T., Stock A. M. (2005) Structure 13, 1353–1363 [DOI] [PMC free article] [PubMed] [Google Scholar]
- 24.Bachhawat P., Stock A. M. (2007) J. Bacteriol. 189, 5987–5995 [DOI] [PMC free article] [PubMed] [Google Scholar]
- 25.Hong E., Lee H. M., Ko H., Kim D. U., Jeon B. Y., Jung J., Shin J., Lee S. A., Kim Y., Jeon Y. H., Cheong C., Cho H. S., Lee W. (2007) J. Biol. Chem. 282, 20667–20675 [DOI] [PubMed] [Google Scholar]
- 26.Buckler D. R., Stock A. M. (2000) Anal. Biochem. 283, 222–227 [DOI] [PubMed] [Google Scholar]
- 27.Otwinowski Z., Minor W. (1997) Methods Enzymol. 276, 307–326 [DOI] [PubMed] [Google Scholar]
- 28.Brünger A. T., Adams P. D., Clore G. M., DeLano W. L., Gros P., Grosse-Kunstleve R. W., Jiang J. S., Kuszewski J., Nilges M., Pannu N. S., Read R. J., Rice L. M., Simonson T., Warren G. L. (1998) Acta Crystallogr. D Biol. Crystallogr. 54, 905–921 [DOI] [PubMed] [Google Scholar]
- 29.Emsley P., Cowtan K. (2004) Acta Crystallogr. D Biol. Crystallogr. 60, 2126–2132 [DOI] [PubMed] [Google Scholar]
- 30.Laskowski R. A., McArthur M. W., Moss D. S., Thornton J. M. (1993) J. Appl. Crystallogr. 26, 282–291 [Google Scholar]
- 31.McCoy A. J., Grosse-Kunstleve R. W., Adams P. D., Winn M. D., Storoni L. C., Read R. J. (2007) J. Appl. Crystallogr. 40, 658–674 [DOI] [PMC free article] [PubMed] [Google Scholar]
- 32.Adams P. D., Gopal K., Grosse-Kunstleve R. W., Hung L. W., Ioerger T. R., McCoy A. J., Moriarty N. W., Pai R. K., Read R. J., Romo T. D., Sacchettini J. C., Sauter N. K., Storoni L. C., Terwilliger T. C. (2004) J. Synchrotron Radiat. 11, 53–55 [DOI] [PubMed] [Google Scholar]
- 33.Davis I. W., Leaver-Fay A., Chen V. B., Block J. N., Kapral G. J., Wang X., Murray L. W., Arendall W. B., 3rd, Snoeyink J., Richardson J. S., Richardson D. C. (2007) Nucleic Acids Res. 35, W375–W383 [DOI] [PMC free article] [PubMed] [Google Scholar]
- 34.Lukat G. S., McCleary W. R., Stock A. M., Stock J. B. (1992) Proc. Natl. Acad. Sci. U.S.A. 89, 718–722 [DOI] [PMC free article] [PubMed] [Google Scholar]
- 35.Head C. G., Tardy A., Kenney L. J. (1998) J. Mol. Biol. 281, 857–870 [DOI] [PubMed] [Google Scholar]
- 36.Barbieri C. M., Stock A. M. (2008) Anal. Biochem. 376, 73–82 [DOI] [PMC free article] [PubMed] [Google Scholar]
- 37.Wemmer D. E., Kern D. (2005) J. Bacteriol. 187, 8229–8230 [DOI] [PMC free article] [PubMed] [Google Scholar]
- 38.Zhao H., Heroux A., Sequeira R. D., Tang L. (2009) Acta Crystallogr. D Biol. Crystallogr. 65, 719–722 [DOI] [PMC free article] [PubMed] [Google Scholar]
- 39.Jones S., Marin A., Thornton J. M. (2000) Protein Eng. 13, 77–82 [DOI] [PubMed] [Google Scholar]
- 40.Bachhawat P. (2005) Regulation in the OmpR/PhoB Family of Response Regulators: Different Inactive States Lead to a Common Active State. Ph.D. dissertation, University of Medicine and Dentistry of New Jersey Graduate School of Biomedical Sciences, Piscataway, NJ [Google Scholar]
- 41.Da Re S. S., Deville-Bonne D., Tolstykh T., Véron M., Stock J. B. (1999) FEBS Lett. 457, 323–326 [DOI] [PubMed] [Google Scholar]
- 42.McCleary W. R., Stock J. B., Ninfa A. J. (1993) J. Bacteriol. 175, 2793–2798 [DOI] [PMC free article] [PubMed] [Google Scholar]
- 43.Wanner B. L. (1993) J. Cell. Biochem. 51, 47–54 [DOI] [PubMed] [Google Scholar]
- 44.McCleary W. R., Stock J. B. (1994) J. Biol. Chem. 269, 31567–31572 [PubMed] [Google Scholar]
- 45.Wolfe A. J. (2005) Microbiol. Mol. Biol. Rev. 69, 12–50 [DOI] [PMC free article] [PubMed] [Google Scholar]
- 46.Kern D., Volkman B. F., Luginbuhl P., Nohaile M. J., Kustu S., Wemmer D. E. (1999) Nature 40, 894–898 [DOI] [PubMed] [Google Scholar]
- 47.Gardino A. K., Volkman B. F., Cho H. S., Lee S. Y., Wemmer D. E., Kern D. (2003) J. Mol. Biol. 331, 245–254 [DOI] [PubMed] [Google Scholar]
- 48.Gardino A. K., Kern D. (2007) Methods Enzymol. 423, 149–165 [DOI] [PubMed] [Google Scholar]
- 49.Ames S. K., Frankema N., Kenney L. J. (1999) Proc. Natl. Acad. Sci. U.S.A. 96, 11792–11797 [DOI] [PMC free article] [PubMed] [Google Scholar]
- 50.Schär J., Sickmann A., Beier D. (2005) J. Bacteriol. 187, 3100–3109 [DOI] [PMC free article] [PubMed] [Google Scholar]
- 51.Fraser J. S., Merlie J. P., Jr., Echols N., Weisfield S. R., Mignot T., Wemmer D. E., Zusman D. R., Alber T. (2007) Mol. Microbiol. 65, 319–332 [DOI] [PMC free article] [PubMed] [Google Scholar]
- 52.Ruiz D., Salinas P., Lopez-Redondo M. L., Cayuela M. L., Marina A., Contreras A. (2008) Microbiology 154, 3002–3015 [DOI] [PubMed] [Google Scholar]
- 53.Kato H., Chibazakura T., Yoshikawa H. (2008) Biosci. Biotechnol. Biochem. 72, 1072–1079 [DOI] [PubMed] [Google Scholar]
- 54.Gao R., Stock A. M. (2010) Curr. Opin. Microbiol. 13, 160–167 [DOI] [PMC free article] [PubMed] [Google Scholar]
- 55.Casino P., Rubio V., Marina A. (2009) Cell 139, 325–336 [DOI] [PubMed] [Google Scholar]
- 56.James L. C., Tawfik D. S. (2003) Trends Biochem. Sci. 28, 361–368 [DOI] [PubMed] [Google Scholar]
- 57.Benkovic S. J., Hammes-Schiffer S. (2003) Science 301, 1196–1202 [DOI] [PubMed] [Google Scholar]
- 58.Boehr D. D., Nussinov R., Wright P. E. (2009) Nat. Chem. Biol. 5, 789–796 [DOI] [PMC free article] [PubMed] [Google Scholar]
- 59.Klein A. H., Shulla A., Reimann S. A., Keating D. H., Wolfe A. J. (2007) J. Bacteriol. 189, 5574–5581 [DOI] [PMC free article] [PubMed] [Google Scholar]
- 60.Bouché S., Klauck E., Fischer D., Lucassen M., Jung K., Hengge-Aronis R. (1998) Mol. Microbiol. 27, 787–795 [DOI] [PubMed] [Google Scholar]
- 61.Fredericks C. E., Shibata S., Aizawa S., Reimann S. A., Wolfe A. J. (2006) Mol. Microbiol. 61, 734–747 [DOI] [PubMed] [Google Scholar]
- 62.Collaborative Computational Project (1994) Acta Crystallogr. D Biol. Crystallogr. 50, 760–76315299374 [Google Scholar]