Abstract
GATA transcription factors have been implicated in controlling adipogenesis in Drosophila and in mammals. In mammals, both GATA2 and GATA3 have been shown to be present in preadipocytes, and their silencing allows the onset of adipogenesis. Overexpression of GATA proteins blocks adipogenesis in cellular assays. GATA factors have been found to operate through recruiting cofactors of the Friend of GATA (FOG) family. FOG proteins, in turn, recruit co-regulators, including C-terminal binding proteins (CTBPs). We have investigated whether FOGs and CTBPs influence adipogenesis. We found that both FOG1 and FOG2 are expressed in cells prior to adipogenesis but are down-regulated as adipogenesis proceeds. Overexpression of FOG1 or FOG2 interferes with adipogenesis. Mutant versions of FOG2 unable to bind CTBP or GATA proteins are impaired in their inability to inhibit adipogenesis. Finally, a mutant version of GATA2, unable to associate with FOGs, also displays abnormal activity and causes enhanced cell proliferation. These results implicate FOGs and CTBPs as partners of GATA proteins in the control of adipocyte proliferation and differentiation.
Keywords: Adipocyte, Cell Differentiation, Coregulator Transcription, Gene Regulation, Transcription Factors, CTBP, FOG, GATA
Introduction
The molecular processes that control the development of adipose tissue are being intensively investigated. In particular, interest has focused on the chain of transcriptional events that occurs during the differentiation of preadipocytes to mature adipocytes. After preadipocytes receive a stimulus to differentiate, two members of the CCAAT/enhancer-binding protein family of transcription factors, C/EBPβ and C/EBPδ, are activated. They in turn activate the expression of C/EBPα and the nuclear receptor peroxisome proliferator-activated receptor γ (PPARγ) (1). PPARγ and C/EBPα activate each other's expression and regulate the expression of multiple target genes to establish and maintain the mature adipocyte phenotype (2).
Recent studies have sought to identify the factors that regulate the early events in the commitment of the preadipocyte to differentiate. Members of the GATA family of transcription factors have been found to serve as negative regulators of preadipocyte differentiation (i.e. their overexpression effectively blocks adipogenesis in cell culture systems, such as 3T3-L1 cells) (3). GATA transcription factors contain a highly conserved zinc finger DNA binding domain that recognizes (A/T)GATA(A/G) motifs in the promoters and enhancers of GATA target genes (4). GATA proteins play key roles in the development of numerous cell lineages. Initial studies in Drosophila revealed that the GATA family member Serpent was necessary for fat cell development (5, 6). In mammals, both GATA2 and GATA3 were found to be highly expressed in preadipocytes, their levels declined as adipogenesis began, and their overexpression inhibited adipocyte differentiation (3).
GATA transcription factors rely on the actions of partner proteins to effect changes in chromatin structure and thereby modulate gene expression. The Friend of GATA (FOG)3 proteins have been shown to be important cofactors in multiple tissues. In mammals, there are two FOG proteins, FOG1 and FOG2, which both interact with the N-terminal zinc finger of GATA proteins (7). FOG1 is expressed highly in hematopoietic tissues and is also expressed in the liver and testis of adult mice. The interaction between GATA1 and FOG1 is essential for hematopoietic development. Mice with a mutation rendering GATA1 unable to interact with Fog1 die in utero from a failure of erythropoiesis (8, 9). FOG2 is expressed highly in the heart, brain, and testis (10). During heart development, FOG2 interacts with GATA4 in multiple cell types that give rise to the adult heart. Fog2−/− animals die midgestation from heart defects (11). Gata4ki/ki animals that express a mutant form of GATA4 that cannot bind to FOG2 die at the same embryonic stage, also due to a failure of heart development (12). The roles of FOG proteins in adipogenesis have not been explored, in part due to the early death of knock-out animals, and also because of the potential redundancy between FOG1 and FOG2 in situations where they are co-expressed (10, 13).
FOG proteins can recruit co-repressors, such as C-terminal binding proteins (CTBPs), to repress target genes. The CTBP proteins CTBP1 and CTBP2 bind to a Pro-Ile-Asp-Leu-Ser (PIDLS) motif between FOG zinc fingers 6 and 7 (14, 15). CTBPs recruit a number of histone-modifying enzymes, including deacetylases and methyltransferases, and thereby functionally contribute to gene silencing (16).
Interestingly, CTBP proteins can bind to NADH and to a lesser extent to NAD+ dinucleotides (17). It has been proposed that their ability to respond to differing NAD+/NADH ratios equips them to function as metabolic sensors and alter gene transcription in response to changes in the metabolic state of the cell (17, 18). CTBPs have recently been identified as key regulators in the development of brown adipose tissue. Together with the transcription factor PRDM16, CTBP1 and CTBP2 repress transcription of multiple genes associated with the white adipocyte phenotype. This enables the developing adipocyte to be directed to form a mature brown adipocyte (19). Analysis of the in vivo role of CTBP proteins has been complicated by early in utero death of knock-out animals and apparent redundancy between the two proteins (20).
Here we have investigated the role of GATA, FOG, and CTBP proteins in adipogenesis. We have found that whereas CTBP is present throughout adipogenesis, FOG1 and FOG2, like GATA proteins, are down-regulated as adipogenesis proceeds. Overexpression of FOG1 or FOG2 inhibits the differentiation of 3T3-L1 cells into lipid-containing cells, and the interaction with CTBP proteins plays a role in the inhibition. Furthermore, abolishing the interaction between GATA and FOG via a mutation in the N-terminal zinc finger of GATA2 also leads to an impairment of adipocyte differentiation, in this case associated with an unexpected cellular proliferation phenotype.
MATERIALS AND METHODS
Cell Culture
3T3-L1 cells were maintained at 37 °C with 5% CO2. Cells were cultured in a standard medium of high glucose (HG) DMEM supplemented with 10% (v/v) heat-inactivated fetal calf serum (FCS) and 1% (v/v) penicillin, streptomycin, and glutamine (PSG) (Invitrogen). Differentiation was induced 2 days after the cells reached confluence (designated day 0). At day 0, the medium was replaced with differentiation medium (HG DMEM, 10% FCS, 1% PSG, 2 mg/ml insulin, 1 mm dexamethasone, 0.5 mm 3-isobutyl-1-methylxanthine). At 3 days postinduction, the medium was replaced with postdifferentiation medium (HG DMEM, 10% FCS, 1% PSG, 2 mg/ml insulin). From 6 days postinduction, cells were maintained in standard medium. EcopackTM2-293 retroviral packaging cells (Clontech) and HEK-293 cells were maintained in standard medium. Cells were imaged by light microscopy.
Mouse Preadipocyte and Adipocyte Isolation
Epididymal white adipose tissue from six 13-week-old male mice was provided by Helen Williams (School of Molecular Bioscience, University of Sydney). Samples were pooled and digested with 1 mg/ml collagenase in serum-free DMEM at 37 °C for 1 h. The cells were passed through a 425-μm filter and centrifuged at 250 × g for 8 min. The supernatant adipocyte layer was harvested and washed in fresh medium (HG DMEM, 10% FCS, 1% PSG). The stromal vascular pellet containing preadipocytes was harvested. The cells were washed in fresh medium (HG DMEM, 10% FCS, 1% PSG), and red blood cells were lysed with 0.15 mm NH4Cl, 10 mm KHCO3, 0.1 mm EDTA. Preadipocytes were then passed through a 20-μm filter and collected by centrifugation at 500 × g for 5 min.
Real-time PCR
Cells were harvested at the specified times during differentiation as described under “Results.” Total RNA was prepared using the RNeasy lipid tissue minikit (Qiagen, Valencia, CA). The purified RNA was used to synthesize cDNA by use of the SuperScript® VILOTM cDNA synthesis kit (Invitrogen). Real-time PCR was performed as described previously (21). Sequences of the forward and reverse primers used are available upon request. Statistical significance was established using Student's t test.
Western Blotting
Cells were harvested at 2 days postconfluence, nuclear extracts were prepared, and Western blotting was carried out as described previously (22). Antibodies used in the analysis were as follows: FOG1 (rabbit polyclonal antibody against an N-terminal fragment of FOG1), FOG2 (M-247, Santa Cruz Biotechnology, Inc., Santa Cruz, CA), GATA2 (ab22849, Abcam, Cambridge, UK), CTBP1 (612042, BD Biosciences), CTBP2 (612044, BD Biosciences), GAPDH (ab9485, Abcam), secondary antibodies (NA931V and NA934V, GE Life Sciences). Positive controls for Western blots were generated by transfecting HEK-293 cells with Fog1, Fog2, Ctbp1, and Ctbp2 in the pcDNA3 vector. Details of vectors are available upon request. Cells were harvested after 48 h, and nuclear extracts were prepared.
Retroviral Vectors
Retroviral vectors were created by inserting the full-length cDNA for human Gata2 (23), murine Gata3 (24), murine Fog1 (25), and human Fog2 (14) into the multiple cloning site of the pMXspuro vector (generously supplied by Toshio Kitamura, University of Tokyo, Tokyo, Japan). The Gata2-V296M and Fog2-ΔDL mutations were created by site-directed mutagenesis of the wild type retroviral construct. The Fog2-Gatamut sequence was synthesized by Epoch Biolabs (Sugar Land, TX) and inserted into the pMXspuro vector. The cDNA for full-length murine Ctbp2 (26) was inserted into the retroviral pMSCVpuro vector (27).
Retroviral Infection
To generate retroviruses, EcopackTM2-293 cells were transfected with 5 μg of plasmid DNA using FuGENE6 transfection reagent (Roche Applied Science). Twelve hours prior to infection, 3T3-L1 cells were plated out at 1.5 × 10⁵ cells/60-mm dish. At 48 h after transfection, the medium was harvested from the EcopackTM2-293 cells, filtered (pore size 45 μm), and transferred to the 3T3-L1 cells. The cells were incubated with 8 μg/ml Polybrene (Sigma) for 24 h. Transduced cells were selected with puromycin (2.5 μg/ml). Differentiation of transduced cells was carried out as described above.
shRNA Knockdown of Fog2
shRNA constructs against Fog2 and a scrambled shRNA control were obtained from SA Biosciences (KM03538N). 3T3-L1 cells were transfected with 5 μg of plasmid DNA using FuGENE6 transfection reagent (Roche Applied Science). Transfected cells were selected with 1 mg/ml G418. Cells were grown to 2 days postconfluence and harvested for real-time PCR and Western blot analysis. Cells were induced to differentiate as described above.
Oil Red O Staining and Quantification
Cells were stained with Oil Red O as described previously (28). Stained plates were imaged by scanning. After the cells were dried by incubation at 37 °C, Oil Red O stain was extracted with agitation in 100% isopropyl alcohol for 5 min. The stain was quantified by spectrophotometry at 510 nm. Results are expressed relative to control samples.
Cell Counting Assay
At the indicated points during differentiation, cells were harvested and stained with trypan blue (0.4%; Sigma), and viable cells were counted with the use of a hemocytometer. Statistical significance was established using Student's t test.
RESULTS
Expression of Friend of Gata Genes Is Regulated during Adipogenesis
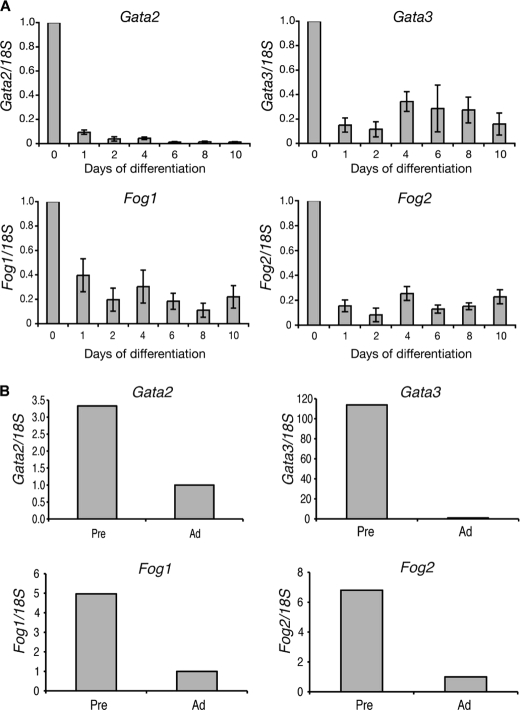
We first investigated whether Fog1 and Fog2 mRNA were present in 3T3-L1 cells and whether their levels were dynamically regulated during differentiation. The cells were induced to differentiate, and RNA was isolated at regular intervals over a 10-day period. The levels of Fog1 and Fog2 mRNA were assessed by real-time PCR and compared with the expression pattern observed for Gata2 and Gata3 (Fig. 1A). As described in previous studies (3), Gata2 and Gata3 are expressed robustly in undifferentiated 3T3-L1 cells, and their expression is down-regulated during cell differentiation. Both Fog1 and Fog2 display a similar expression pattern. The mRNA for both genes is observed in undifferentiated 3T3-L1 cells, and this expression is down-regulated within 24 h of the induction of differentiation. This down-regulation is maintained throughout the 10-day differentiation time course (Fig. 1A).
FIGURE 1.
Fog1 and Fog2 are expressed in 3T3-L1 cells and murine preadipocytes. A, real-time PCR analysis of Fog expression during adipogenesis. 3T3-L1 cells were induced to differentiate over 10 days. Samples were collected at the times indicated and analyzed. Expression of Gata2, Gata3, Fog1, and Fog2 was normalized with 18S and expressed relative to the Day 0 level. Error bars, S.E. (n = 3). B, epidydymal white adipose tissue from six 13-week-old male mice was pooled and digested with collagenase. Preadipocytes (Pre) and adipocytes (Ad) were separated by centrifugation and used for real-time PCR analysis. Expression of Gata2, Gata3, Fog1, and Fog2 were normalized with 18S and expressed relative to the level in adipocytes.
The results obtained for 3T3-L1 cells were compared with expression in murine preadipocytes and mature adipocytes. White adipose tissue was harvested from 13-week-old male mice. The tissue was digested with collagenase, and the preadipocytes and mature adipocytes were separated by centrifugation. The levels of Gata and Fog mRNAs were assessed by real-time PCR. Gata2, Gata3, Fog1, and Fog2 are all expressed in murine preadipocytes, and all four genes display reduced expression in mature white adipocytes (Fig. 1B). This result supports the changes in expression observed during 3T3-L1 cell differentiation.
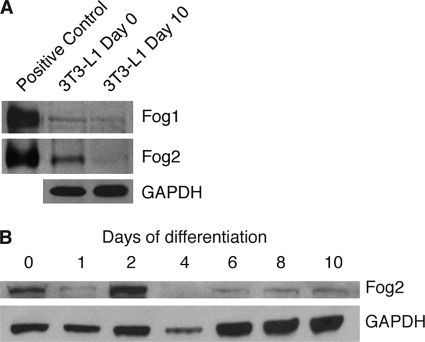
The levels of FOG1 and FOG2 proteins were also examined. Undifferentiated cells and cells that had been differentiated for 10 days were used in Western blotting experiments. Both proteins were detected in undifferentiated 3T3-L1 cells, and a reduction in protein levels after 10 days of differentiation was observed (Fig. 2A). The down-regulation was particularly evident for FOG2, which also showed a more robust initial level of expression in preadipocytes. The down-regulation of FOG1 protein did not appear as marked as the changes observed in Fog1 mRNA. This may be indicative of post-transcriptional regulation, such as through differences in the rate of translation of the remaining mRNA or through a reduction in FOG1 protein turnover. The levels of FOG2 protein were further investigated by including multiple time points throughout 3T3-L1 cell differentiation. We observed an elevated level of FOG2 at day 2 of differentiation (Fig. 2B). The protein was then down-regulated by day 4, and levels remained low through to day 10. This suggests a role for FOG2 in undifferentiated preadipocytes and in the early stages of preadipocyte differentiation. It is possible that FOG2 is down-regulated at day 1 as a part of the mitotic clonal expansion process. The initial presence and coordinated shutdown of both GATA and FOG expression during adipogenesis supports the hypothesis that the proteins work together and inhibit differentiation.
FIGURE 2.
FOG protein levels are reduced during adipogenesis. A, Western blot of 3T3-L1 cells at day 0 and day 10 of differentiation. Cells were harvested, and nuclear extracts were prepared. Positive controls of FOG1 and FOG2 overexpressed in HEK-239 cells were included. Western blotting was performed with FOG1 and FOG2 antibodies. Blotting with GAPDH antibody was included as a loading control. B, Western blot of 3T3-L1 cells at day 0, 1, 2, 4, 6, 8, and 10 of differentiation. Cells were harvested, and nuclear extracts were prepared. Western blotting was performed with a FOG2 antibody, and GAPDH antibody was included as a loading control.
Overexpression of FOG1 or FOG2 Inhibits Differentiation
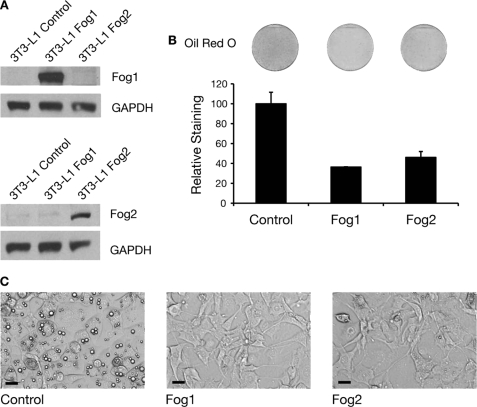
Both GATA2 and GATA3 are negative regulators of adipogenesis. Overexpression of either gene in 3T3-L1 cells inhibits differentiation (3). We similarly tested whether overexpression of Fog genes also inhibits differentiation. We used retroviral gene delivery to express Fog1 and Fog2 genes in 3T3-L1 cells. The level of FOG1 and FOG2 protein expression achieved was assessed by Western blotting of extracts from undifferentiated cells grown to 2 days postconfluence. Both genes were effectively expressed (Fig. 3A). Cells expressing either Fog1 or Fog2 were then induced to differentiate for 5 days, and their ability to accumulate lipid was assessed by Oil Red O lipid staining. The extent of staining was quantified and is depicted graphically. Staining was reduced in cells expressing either Fog1 or Fog2 (Fig. 3B). Microscopic examination of the cells similarly revealed a reduction in the proportion of cells with observable cytoplasmic lipid droplets (Fig. 3C). The extent of the inhibition of differentiation induced by expression of Fog1 and Fog2 is comparable with that produced by overexpression of Gata2 and Gata3 in our experiments (see Fig. 9) (data not shown).
FIGURE 3.
Overexpression of FOG blocks adipogenesis. A, Western blot of FOG overexpression in 3T3-L1 cells. Retroviral delivery was used to express FOG1 and FOG2 in 3T3-L1 cells. The cells were grown to 2 days postconfluence, and nuclear extracts were prepared. Western blotting was performed with FOG1 and FOG2 antibodies. Blotting with GAPDH antibody was included as a loading control. B, Oil Red O staining of 3T3-L1 cells expressing FOG1 and FOG2 after 5 days of differentiation. Cells were stained with Oil Red O and imaged by scanning. The stain was extracted and quantified by spectrophotometry. Results are expressed as staining relative to control. Error bars, S.E. (n = 3). C, images of 3T3-L1 cells expressing FOG after 5 days of differentiation. Cells expressing FOG1, FOG2, or an empty vector control were induced to differentiate for 5 days. Cells were imaged using light microscopy. Scale bars, 20 μm.
FIGURE 9.
Real-time PCR analysis of adipogenic markers in 3T3-L1 cells expressing GATA that cannot bind FOG. 3T3-L1 cells expressing GATA2, GATA2-V296M, or an empty vector control were induced to differentiate for 5 days. Total RNA was isolated at day 5 and used for cDNA synthesis and real-time PCR analysis. Expression of C/ebpα, Adiponectin, and aP2 were normalized to 18S and expressed relative to the lowest sample level. Error bars, S.E. (n = 3). Student's t test results are shown as follows: *, p < 0.05; **, p < 0.005; ***, p < 0.0005.
As an additional confirmation, several 3T3-L1 cell lines expressing either an empty vector control or various levels of FOG2 were generated, and their ability to differentiate was tested. The results indicate that differing levels of ectopic FOG2 expression do not alter the ability of FOG2 to repress (supplemental Fig. 1). Importantly, in sample F2, the level of ectopic sustained expression of FOG2 that blocks adipocyte differentiation is equivalent to the initial endogenous level of FOG2. Taken together with the coordinated shutdown of both GATA and FOG expression during adipogenesis, the results provide further support for the view that the proteins work together to inhibit the onset of adipogenesis.
Knockdown of Fog2 Expression Impairs Preadipocyte Function
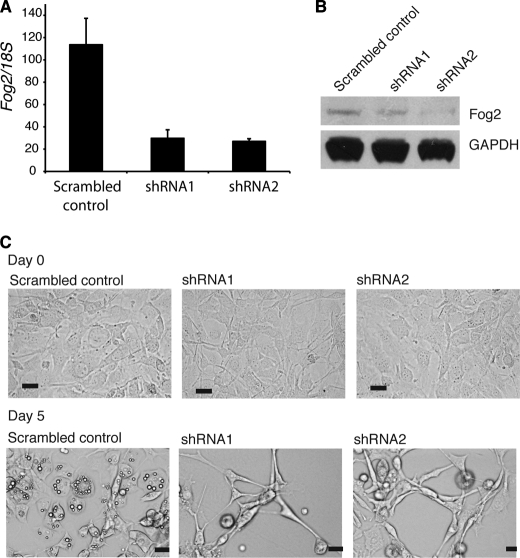
To further investigate the role of FOG2 in adipogenesis, we used shRNA constructs to knock down Fog2 expression in 3T3-L1 preadipocytes. Two different shRNAs targeting Fog2 were transfected into 3T3-L1 cells together with a scrambled shRNA negative control. The extent of knockdown was determined by real-time PCR and Western blotting (Fig. 4, A and B). The cells were induced to differentiate, and microscopic images were obtained at day 0 and day 5 of differentiation. Prior to the induction of differentiation, the knockdown of Fog2 had no observable effect on the growth and morphology of the preadipocytes (Fig. 4C). After 5 days of differentiation, the control cell population had begun to form observable cytoplasmic lipid droplets. In contrast, the cells with Fog2 knockdown had failed to differentiate, and a large proportion of the cells had died. This was evident in both lines, including the line for shRNA1, where a less extensive knockdown of FOG2 was observed. The remaining cells displayed an altered morphology that may indicate cell stress or cell death (Fig. 4C). The extreme phenotype is difficult to interpret but does indicate that FOG2 function is required for correct progression of preadipocyte differentiation. Although knockdown in undifferentiated cells is tolerated, the premature knockdown of Fog2, followed by the induction of differentiation, leads to cell death rather than adipogenesis. This loss of function experiment is consistent with the view that FOG2 plays a role in the regulation of early adipogenesis.
FIGURE 4.
Fog2 knockdown impairs adipogenesis. 3T3-L1 cells were transfected with either shRNA constructs targeting Fog2 (shRNA1 and shRNA2) or a scrambled shRNA or subjected to mock transfection. A, cells were harvested at 2 days postconfluence, and the level of Fog2 mRNA was assessed by real-time PCR. Expression of Fog2 was normalized with 18S and expressed relative to the mock transfected level. Error bars, S.E. (n = 3). B, Western blot of FOG2 knockdown. Cells were harvested prior to differentiation, and nuclear extracts were prepared. Western blotting was performed with a FOG2 antibody, and GAPDH antibody was included as a loading control. C, images of 3T3-L1 cells transfected with shRNA constructs at day 0 and day 5 of differentiation. Cells were imaged using light microscopy. Scale bars, 20 μm.
The FOG Partner Protein CTBP Is Present throughout Adipogenesis
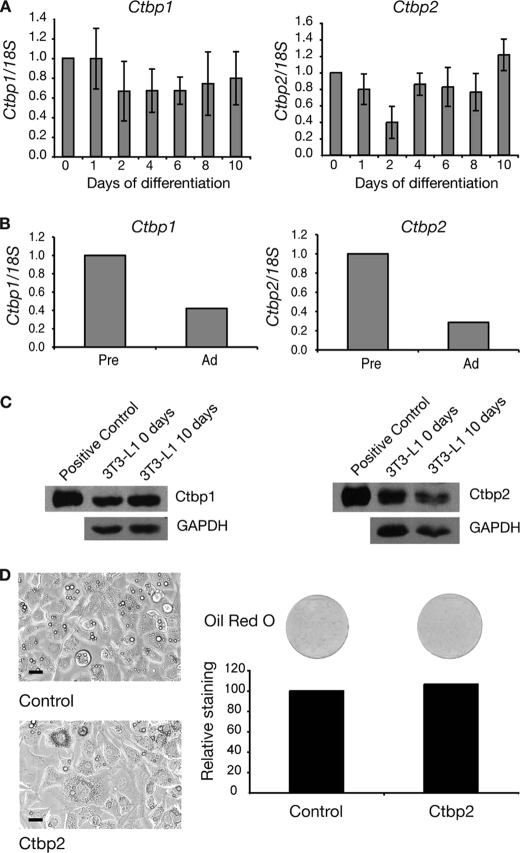
FOG proteins can form repression complexes with a number of partner proteins. One of the key co-repressors that interacts with FOGs is CTBP. We investigated the expression of Ctbp RNA during the differentiation of 3T3-L1 preadipocytes. Real-time PCR analysis of Ctbp1 and Ctbp2 RNA levels indicated that both Ctbp genes are expressed throughout 3T3-L1 differentiation (Fig. 5A). We compared this with the expression pattern of CTBP proteins in murine preadipocytes and adipocytes using real-time PCR. Both Ctbp1 and Ctbp2 genes were expressed in preadipocytes, and this expression was sustained but reduced in mature white adipocytes (Fig. 5B). We also investigated the levels of CTBP proteins in 3T3-L1 cells before and after differentiation. Western blotting for CTBP1 and CTBP2 showed equal levels of expression in undifferentiated and differentiated cells (Fig. 5C).
FIGURE 5.
Ctbp1 and Ctbp2 are expressed throughout 3T3-L1 differentiation. A, real-time PCR analysis of Ctbp expression during adipogenesis. 3T3-L1 cells were induced to differentiate over 10 days. Samples were collected at the times indicated and analyzed. Expression of Ctbp1 and Ctbp2 were normalized with 18S and expressed relative to the Day 0 level. Error bars, S.E. (n = 3). B, expression of Ctbp1 and Ctbp2 in mouse preadipocytes. Epididymal white adipose tissue from six 13-week-old male mice was pooled and digested with collagenase. Preadipocytes (Pre) and adipocytes (Ad) were separated by centrifugation and used for real-time PCR analysis. Expression of Ctbp1 and Ctbp2 was normalized with 18S and expressed relative to the level in adipocytes. C, Western blot of 3T3-L1 cells at day 0 and day 10 of differentiation. Cells were harvested, and nuclear extracts were prepared. Positive controls of CTBP1 and CTBP2 overexpressed in HEK-239 cells were included. Western blotting was performed with CTBP1 and CTBP2 antibodies. Blotting with GAPDH antibody was included as a loading control. C, images of 3T3-L1 cells expressing CTBP2 at 5 days of differentiation. Cells expressing CTBP2 or an empty vector control were induced to differentiate for 5 days. Cells were imaged by light microscopy. Scale bars, 20 μm. D, Oil Red O staining of 3T3-L1 cells expressing CTBP2 after 5 days of differentiation. Cells were stained with Oil Red O and imaged by scanning. The stain was extracted and quantified by spectrophotometry. Results are expressed as staining relative to control.
The expression pattern of Ctbp1 and Ctbp2 is different in 3T3-L1 cells and mouse adipocytes. Both genes were expressed at approximately equal levels in 3T3-L1 preadipocytes and differentiated 3T3-L1 cells but displayed reduced expression in mature mouse adipocytes. The differences in the expression levels between mouse preadipocytes and adipocytes may be due to contamination of the preadipocytes with other cell types present in the stromal vascular fraction. Alternatively, the difference in RNA levels may not result in different CTBP protein levels, or there may simply be differences between Ctbp expression in 3T3-L1 cells and in vivo. Nevertheless, in all cases, Ctbp was readily detectable throughout adipogenesis.
Importantly, in both primary cells and the 3T3-L1 cell line, there is robust expression of Ctbp in the preadipocytes, coinciding with high expression of Gata and Fog. To test the effect of increased Ctbp levels, we used retroviral delivery to force expression of Ctbp2 in 3T3-L1 preadipocytes. Cells expressing Ctbp2 were induced to differentiate for 5 days. The extent of differentiation was assessed by microscopy and Oil Red O staining. Overexpression of Ctbp2 had no effect on the ability of 3T3-L1 cells to differentiate. The Ctbp2-expressing cells showed the same capacity to form lipid droplets as control cells (Fig. 5D). Quantitation of Oil Red O stain indicated equivalent levels of lipid staining in control and Ctbp2-expressing cells (Fig. 5D). Taken together, the data suggest that the control of adipogenesis reflects primarily changes in GATA and/or FOG levels rather than changes in CTBP availability because CTBP is present throughout adipogenesis, and overexpression had no discernible effect.
FOG2 Contact with CTBP Is Implicated in the Repression of Adipogenesis
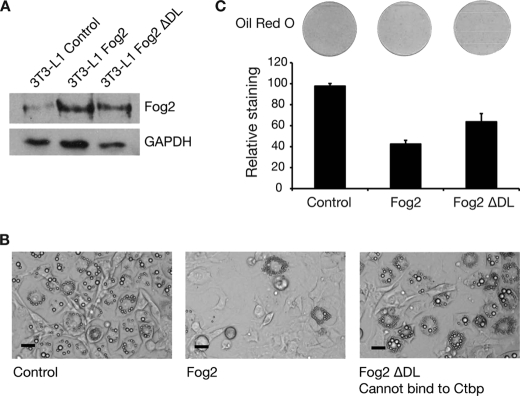
We next tested whether it was necessary for FOG2 to contact CTBP proteins in order to repress adipogenesis. To investigate this, we generated a mutant version of FOG2 with a DL to AS amino acid substitution within the FOG2 PXDLS (CTBP interaction) motif, termed FOG2-ΔDL. This type of mutation has previously been shown to impair the interaction between CTBPs and their binding partners, including FOG proteins (15, 26, 29). Wild type FOG2 and FOG2-ΔDL were expressed in 3T3-L1 preadipocytes using retroviral gene transfer. Levels of expression prior to differentiation were confirmed by Western blotting (Fig. 6A). The cells were induced to differentiate for 5 days. As previously, cells expressing wild type FOG2 did not readily accumulate lipid, but the mutant FOG2-ΔDL-containing cells did accumulate lipid, as assessed by microscopic analysis and Oil Red O staining (Fig. 6, B and C). The FOG2-ΔDL construct did not display full adipogenesis-inhibiting activity (i.e. the proportion of lipid-accumulating cells was intermediate between control and wild type FOG2-expressing cells). This suggests that the FOG2-ΔDL mutant retains some ability to repress adipogenesis. It may retain some ability to bind CTBP or may function through other FOG co-repressors, such as the NuRD complex (30). Nevertheless, the ΔDL mutation that impairs CTBP binding also diminishes the ability of FOG2 to block adipogenesis. This result suggests that FOG2 requires contact with CTBP for its full adipogenesis-inhibiting activity.
FIGURE 6.
Mutation of the FOG CTBP binding site impairs FOG repression of adipogenesis. A, Western blot of FOG2 and FOG2-ΔDL overexpression in 3T3-L1 cells. Retroviral delivery was used to express FOG2 and FOG2-ΔDL in 3T3-L1 preadipocytes. Cells were grown to 2 days postconfluence, and nuclear extracts were prepared. Western blotting was performed with a FOG2 antibody. Blotting with GAPDH antibody was included as a loading control. B, images of 3T3-L1 cells expressing FOG2 and FOG2-ΔDL after 5 days of differentiation. Cells expressing FOG2, FOG2-ΔDL, or an empty vector control were induced to differentiate for 5 days. Cells were imaged using light microscopy. Scale bars, 20 μm. C, Oil Red O staining of 3T3-L1 cells expressing FOG2 and FOG2-ΔDL after 5 days of differentiation. Cells were stained with Oil Red O and imaged by scanning. The stain was extracted and quantified by spectrophotometry. Results are expressed as staining relative to control. Error bars, S.E. (n = 3).
Is GATA Contact Required for FOG-mediated Inhibition of Adipogenesis?
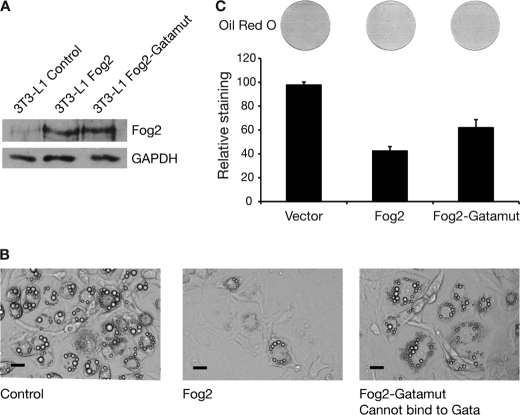
We also sought to establish whether the interaction between GATA and FOG proteins is necessary for the repression of adipocyte differentiation by GATA and FOG factors. To test the importance of the GATA-FOG interaction in FOG-mediated repression of adipogenesis, we created a second mutant form of FOG2. This FOG2 mutant is unable to bind to GATA proteins because it carries tyrosine to alanine substitutions in zinc fingers 1, 5, 6, and 8 (15, 31) and is termed FOG2-Gatamut. 3T3-L1 preadipocytes were transduced with retroviruses containing Fog2 or Fog2-Gatamut. The levels of FOG2 protein were assessed by Western blotting of extracts from cells prior to differentiation, and the wild type and mutant constructs were found to be expressed to a similar level (Fig. 7A). The cells were then differentiated for 5 days, and the extent of lipid accumulation was assessed. The wild type FOG2 effectively prevented lipid accumulation and Oil Red O staining as previously, but the mutant form of FOG2 only partially repressed adipogenesis (Fig. 7, B and C). Again the mutant form of FOG2 retained some repression activity but less than the wild type protein. This result indicates that FOG contact with GATA proteins is important for inhibiting adipogenesis.
FIGURE 7.
Abrogation of GATA binding activity in FOG impairs FOG repression of adipogenesis. A, Western blot of FOG2 and FOG2-Gatamut overexpression in 3T3-L1 cells. Retroviral delivery was used to express FOG2 and FOG2-Gatamut in 3T3-L1 cells. The cells were grown to 2 days postconfluence, and nuclear extracts were prepared. Western blotting was performed with a FOG2 antibody. Blotting with GAPDH antibody was included as a loading control. B, images of 3T3-L1 cells expressing FOG2 and FOG2-Gatamut after 5 days of differentiation. Cells expressing FOG2, FOG2-Gatamut, or an empty vector control were induced to differentiate for 5 days. Cells were imaged using light microscopy. Scale bars, 20 μm. C, Oil Red O staining of 3T3-L1 cells expressing FOG2 and FOG2-Gatamut after 5 days of differentiation. Cells were stained with Oil Red O and imaged by scanning. The stain was extracted and quantified by spectrophotometry. Results are expressed as staining relative to control. Error bars, S.E. (n = 3).
A Mutant Form of GATA2, Impaired in FOG Contact, Causes Cellular Proliferation
We next tested a mutant form of GATA2 that is impaired in its ability to contact FOG co-factors. This mutant carries a valine to methionine amino acid substitution in its N-terminal zinc finger and is termed GATA2-V296M. This mutation lies within the region through which the GATA zinc finger contacts the FOG zinc fingers and corresponds to a naturally occurring mutation that has been described in GATA1 and which has been shown to significantly interfere with the interaction between GATA1 and FOG1 (32). Analogous mutations in GATA4 have also been shown to impair its interaction with FOG2 (12).
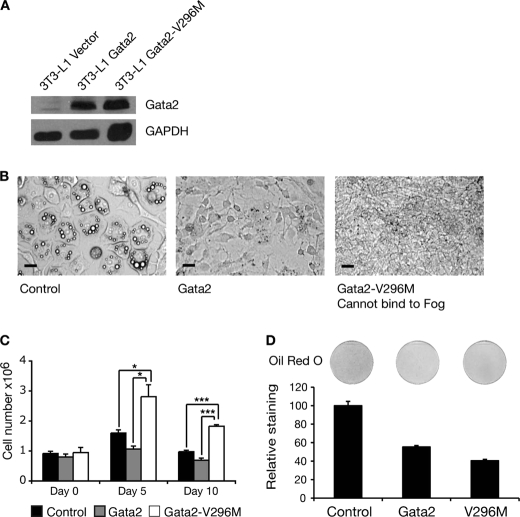
Both wild type GATA2 and GATA2-V296M were expressed in 3T3-L1 cells by retroviral transfer. Levels of expression were monitored prior to differentiation by Western blotting, which confirmed that both proteins were properly expressed (Fig. 8A). The cells were induced to differentiate for 5 days. As expected, the wild type GATA2 effectively inhibited lipid accumulation (Fig. 8B). A strikingly different phenotype was observed with GATA2-V296M. The cells did not differentiate and accumulate lipid; nor did they resemble the GATA2-transfected cells that were maintained in the preadipocyte state. Instead, the GATA2-V296M-containing cells proliferated rapidly (Fig. 8B). This difference in numbers is marked, and at this point in differentiation, it is difficult to discern the boundaries of individual cells on the plate. In comparison, cells transduced with either empty vector or GATA2 are confluent, with individual cells clearly defined.
FIGURE 8.
Abolition of FOG binding activity in GATA2 impairs GATA2 function in 3T3-L1 cells. A, Western blot of GATA2 and GATA2-V296M overexpression in 3T3-L1 cells. Retroviral delivery was used to express GATA2 and GATA2-V296M in 3T3-L1 cells. The cells were grown to 2 days postconfluence, and nuclear extracts were prepared. Western blotting was performed with a GATA2 antibody. Blotting with GAPDH antibody was included as a loading control. B, images of 3T3-L1 cells expressing GATA2 and GATA2-V296M after 5 days of differentiation. Cells expressing GATA2, GATA2-V296M, or an empty vector control were induced to differentiate for 5 days. Cells were imaged using light microscopy. Scale bars, 20 μm. C, 3T3-L1 cells expressing GATA2, GATA2-V296M, or an empty vector control were induced to differentiate over 10 days. Cells were harvested at the indicated times, and the number of cells was determined by counting. Error bars, S.E. (n = 3). Student's t test results are shown as follows: *, p < 0.05; **, p < 0.005; ***, p < 0.0005. D, Oil Red O staining of 3T3-L1 cells expressing GATA2 and GATA2-V296M after 5 days of differentiation. Cells were stained with Oil Red O and imaged by scanning. The stain was extracted and quantified by spectrophotometry. Results are expressed as staining relative to control. Error bars, S.E. (n = 3).
To confirm these observations and to assess whether increased cellular proliferation was occurring, cell numbers were counted at days 0, 5, and 10 of differentiation. At day 0, there were no significant differences between the cell populations. By day 5, the GATA2-V296M cultures contained approximately twice as many cells as control and wild type cultures, and this difference is maintained at day 10 of differentiation (Fig. 8C). The GATA2 and GATA2-V296M cells both display reduced Oil Red O staining compared with control cells (Fig. 8D). The result demonstrates that the GATA2 mutant that cannot contact FOG appears to drive proliferation rather than coordinating the withdrawal from the cell cycle and subsequent differentiation associated with normal adipogenesis.
GATA2 Regulates Key Adipogenic Markers
In order to assess at a molecular level whether the mutant form of GATA2 was influencing adipogenesis, we examined the expression of known markers of adipogenesis, C/ebpα, Adiponectin, and aP2 (Fabp4). 3T3-L1 preadipocytes expressing either empty vector, GATA2, or GATA2-V296M were induced to differentiate for 5 days. RNA was extracted, and real-time PCR was used to assess mRNA levels. Expression of all three adipogenic marker genes was suppressed in the presence of wild type GATA2, as expected, and was also inhibited and to a greater extent in the GATA2-V296M-containing cells (Fig. 9). In other words, the GATA2-V296M mutant has generated a proliferation phenotype and terminal differentiation, and adipogenesis has been abrogated. This result suggests that contact with FOG proteins is required for GATA2 to coordinate the withdrawal from the cell cycle and terminal differentiation that accompanies adipogenesis in 3T3-L1 cells.
DISCUSSION
GATA proteins have been clearly implicated in maintaining cells in a preadipocyte state (3). In addition to controlling the entry into the adipocyte program, there is recent evidence that overexpression of GATA2, in combination with the suppression of Pparγ, can even revert adipocytes to a preadipocyte-like phenotype (33). The mechanism by which GATA proteins repress gene expression in adipocytes has not previously been investigated. There is, however, extensive evidence that in other tissue types, the function of GATA factors is reliant in part on FOG partner proteins. The interaction between GATA1 and FOG1 is critical for the development of both erythroid and megakaryocytic cell lineages (25, 34). The correct development of the heart and coronary vasculature depends on the interaction between GATA4 and FOG2 (12). In Drosophila, the interaction between GATA protein Pannier and the FOG homologue U-shaped is necessary for correct development of both the heart and the eye (13).
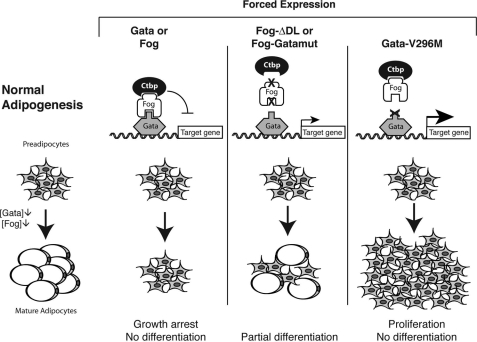
The analysis of the biological roles of FOGs in mammalian adipogenesis has been complicated by the fact that both FOG1 and FOG2 knock-out mice die in utero (11, 34, 35). Thus, we have primarily used 3T3-L1 cells to investigate the functional role of FOG proteins in adipogenesis. The results from these experiments are summarized in Fig. 10. We have shown that FOG1 and FOG2 are both expressed in 3T3-L1 cells and down-regulated during adipocyte differentiation. Overexpression of FOGs blocks differentiation, as measured by Oil-Red-O staining, to a level comparable with the effect observed previously for GATA2 and GATA3 (3). We measured cytoxicity (using the Cytotox 96® assay from Promega) in the presence of overexpressed GATA2 and FOG2 and also monitored cell death by visual inspection. Both GATA2- and FOG2-overexpressing cells showed similar levels of cytoxicity and no significant increase in cell death as compared with controls. We also combined overexpression of GATA2 or FOG2 and hydroxyurea (2.5 and 10 mm) and again observed no increase in cytoxicity or cell death compared with normal cells (data not shown). We conclude that the mechanisms through which GATA2 and FOG2 inhibit adipocyte differentiation are not primarily based on cytoxicity.
FIGURE 10.
Manipulation of GATA2 and FOG2 results in disruption of preadipocyte differentiation. Shown is a schematic diagram summarizing the results of all GATA2 and FOG2 overexpression experiments.
To test the importance of the GATA-FOG interaction, we created mutants of both proteins that were unable to bind to each other. In both cases, the mutations interfered with the normal activity of the proteins. The mutant FOG displayed a reduced inhibition activity, and the expression of the mutant GATA generated an abnormal cell proliferative phenotype in addition to blocking adipogenesis.
The situation, however, is complex. Although the mutant FOG that is unable to bind GATA, FOG-Gatamut, was impaired in its function, it nevertheless retained some activity. It is possible that it is generally less potent as an inhibitor of adipogenesis or that it now can alter the expression of some key adipogenic genes but not others. The FOG mutant unable to bind GATA may retain some residual binding (directly or indirectly to GATA-dependent promoters, perhaps via CTBP or NuRD), or possibly FOG is recruited by a different transcription factor or perhaps by direct DNA binding at some target genes. It appears most likely that at different genes, different mechanisms of FOG recruitment may occur.
Alternatively, recent results raise the possibility that FOG2 may also be operating not by binding GATA but through protein-protein interactions in the cytoplasm. The Drosophila FOG2 homologue, U-shaped, has recently been identified as a regulator of insulin signaling in the fat body (36). In cells of this body, U-shaped binds directly to phosphoinositide 3-kinase and prevents phosphorylation of Akt. U-shaped levels are regulated by the microRNA miR-8, and animals lacking miR-8 display reduced body size. This function of FOG is distinct from its function as a nuclear coregulator for GATA transcription factors and may contribute to the partial activity observed for the FOG mutant unable to bind GATA.
The GATA mutant that is unable to bind FOG, GATA V296M, was also impaired in function, but again the situation is complex. An almost total abrogation of the adipogenic program was observed. It is possible that the GATA V296M mutant is severely compromised in function and hence adipogenesis does not occur, or alternatively, an extension of the proliferative stage and failure to exit the cell cycle may preclude all adipogenic gene expression. Thus, rather than the GATA mutant being superactive as an inhibitor of adipogenesis, it is possible that the disregulation of key genes involved in withdrawal of the cell cycle prevents the cells advancing along the adipogenic pathway.
We also investigated the role of CTBP proteins in the GATA-FOG-mediated suppression of adipogenesis. CTBPs are implicated in both the repression and the promotion of white adipocyte development. The transcription factor Klf3 recruits CTBP to repress the differentiation of preadipocytes (28). When acting with the transcription factor PRDM16, CTBPs contribute to the repression of white adipocyte genes, including resistin and angiotensinogen, to allow the activation of brown adipocyte-specific genes (19). Our work also suggests that CTBPs play a role in white adipocyte formation through interaction with FOG. CTBPs have also been shown to facilitate white fat formation by associating with RIP140 and repressing the brown fat gene Ucp1 (37, 38). Accordingly, it seems unlikely that CTBP is a general inhibitor or activator of adipogenesis, but it appears to play a role as a co-repressor for several of the key transcription factors that guide this process.
CTBPs have also been implicated in metabolic and life span regulation. In the nematode worm Caenorhabditis elegans, the CTBP protein CTBP-1 has been shown to have a role in the regulation of life span. Worms possessing a mutant form of ctbp-1 display an extension of life span, which can be suppressed by the reintroduction of ctbp-1. The function of ctbp-1 in life span control in C. elegans is dependent on its NAD+/NADH binding activity (39). CTBP proteins can bind to NAD+/NADH dinucleotides at concentrations comparable with those present within the cell (17). They have been proposed as metabolic sensors, able to detect altered NAD+/NADH balances and to respond by altering gene expression (18). CTBP proteins are also negative regulators of SIRT1, the mammalian homologue of yeast Sir2, another protein that binds NAD+ and that has been linked to life span regulation and aging (40). This further supports the role of NAD+/NADH in modulating metabolic function through interaction with multiple regulatory proteins.
Interestingly, GATA and CTBP proteins have also been linked to fat body formation in the mosquito, Aedes aegypti. Here the GATA protein, AaGATAr, directly recruits CTBP through its own PXDLS-like motif, rather than via a FOG co-factor, and functions in the repression of fat body formation (41). This link, together with the observation that the GATA factor Serpent controls fat formation in Drosophila suggests that GATA and CTBPs have a long evolutionary history of controlling fat production. The relationship between FOG proteins and CTBPs has, however, been less clear. The Drosophila FOG homologue, U-shaped, contains a PXDLS binding site and can associate with Drosophila CTBP, and both mammalian FOG proteins, FOG1 and FOG2, contain PIDLS motifs. Nevertheless, a knock-in mouse line, homozygous for a mutant form of FOG1 lacking the PIDLS motif, was viable and exhibited normal hematopoiesis (29). This suggests that the PIDLS motif is not required for hematopoietic function and raises the question of why this motif had been conserved during evolution. Our finding that the PIDLS motif is important for the ability of FOG2 to inhibit adipogenesis provides functional evidence that this motif is important in fat, despite the fact that it may be dispensable in hematopoietic tissues.
Our experiments have implicated the combination of GATA, FOG, and CTBP proteins in controlling entry into adipocyte differentiation. This is an important demonstration that FOG plays a role in adipogenesis and extends the evidence that GATA proteins work together with FOG partners for full biological activity outside the well studied hematopoietic lineages. The full range of target genes on which GATA, FOG, and CTBP proteins act remains to be defined. Nevertheless, the fact that CTBP appears to generally function as a repressor (42), together with the fact that the GATA mutant cells presented with a cell proliferation phenotype, suggests that these proteins may work together to prevent exit from the cell cycle and to suppress the adipogenic differentiation.
Supplementary Material
This work was supported by grant funding from the Australian Research Council and the National Health and Medical Research Council (to M. C.).

The on-line version of this article (available at http://www.jbc.org) contains supplemental Fig. 1.
- FOG
- Friend of GATA
- CTBP
- C-terminal binding protein
- HG
- high glucose
- PSG
- penicillin/streptomycin/glutamine.
REFERENCES
- 1.Rosen E. D. (2005) Prostaglandins Leukot. Essent. Fatty Acids 73, 31–34 [DOI] [PubMed] [Google Scholar]
- 2.Farmer S. R. (2006) Cell. Metab. 4, 263–273 [DOI] [PMC free article] [PubMed] [Google Scholar]
- 3.Tong Q., Dalgin G., Xu H., Ting C. N., Leiden J. M., Hotamisligil G. S. (2000) Science 290, 134–138 [DOI] [PubMed] [Google Scholar]
- 4.Patient R. K., McGhee J. D. (2002) Curr. Opin. Genet. Dev. 12, 416–422 [DOI] [PubMed] [Google Scholar]
- 5.Hayes S. A., Miller J. M., Hoshizaki D. K. (2001) Development 128, 1193–1200 [DOI] [PubMed] [Google Scholar]
- 6.Sam S., Leise W., Hoshizaki D. K. (1996) Mech. Dev. 60, 197–205 [DOI] [PubMed] [Google Scholar]
- 7.Cantor A. B., Orkin S. H. (2005) Semin. Cell. Dev. Biol. 16, 117–128 [DOI] [PubMed] [Google Scholar]
- 8.Fujiwara Y., Browne C. P., Cunniff K., Goff S. C., Orkin S. H. (1996) Proc. Natl. Acad. Sci. U.S.A. 93, 12355–12358 [DOI] [PMC free article] [PubMed] [Google Scholar]
- 9.Chang A. N., Cantor A. B., Fujiwara Y., Lodish M. B., Droho S., Crispino J. D., Orkin S. H. (2002) Proc. Natl. Acad. Sci. U.S.A. 99, 9237–9242 [DOI] [PMC free article] [PubMed] [Google Scholar]
- 10.Tevosian S. G., Deconinck A. E., Cantor A. B., Rieff H. I., Fujiwara Y., Corfas G., Orkin S. H. (1999) Proc. Natl. Acad. Sci. U.S.A. 96, 950–955 [DOI] [PMC free article] [PubMed] [Google Scholar]
- 11.Tevosian S. G., Deconinck A. E., Tanaka M., Schinke M., Litovsky S. H., Izumo S., Fujiwara Y., Orkin S. H. (2000) Cell 101, 729–739 [DOI] [PubMed] [Google Scholar]
- 12.Crispino J. D., Lodish M. B., Thurberg B. L., Litovsky S. H., Collins T., Molkentin J. D., Orkin S. H. (2001) Genes Dev. 15, 839–844 [DOI] [PMC free article] [PubMed] [Google Scholar]
- 13.Fossett N., Tevosian S. G., Gajewski K., Zhang Q., Orkin S. H., Schulz R. A. (2001) Proc. Natl. Acad. Sci. U.S.A. 98, 7342–7347 [DOI] [PMC free article] [PubMed] [Google Scholar]
- 14.Holmes M., Turner J., Fox A., Chisholm O., Crossley M., Chong B. (1999) J. Biol. Chem. 274, 23491–23498 [DOI] [PubMed] [Google Scholar]
- 15.Fox A. H., Liew C., Holmes M., Kowalski K., Mackay J., Crossley M. (1999) EMBO J. 18, 2812–2822 [DOI] [PMC free article] [PubMed] [Google Scholar]
- 16.Shi Y., Sawada J., Sui G., Affar el B., Whetstine J. R., Lan F., Ogawa H., Luke M. P., Nakatani Y., Shi Y. (2003) Nature 422, 735–738 [DOI] [PubMed] [Google Scholar]
- 17.Zhang Q., Piston D. W., Goodman R. H. (2002) Science 295, 1895–1897 [DOI] [PubMed] [Google Scholar]
- 18.Fjeld C. C., Birdsong W. T., Goodman R. H. (2003) Proc. Natl. Acad. Sci. U.S.A. 100, 9202–9207 [DOI] [PMC free article] [PubMed] [Google Scholar]
- 19.Kajimura S., Seale P., Tomaru T., Erdjument-Bromage H., Cooper M. P., Ruas J. L., Chin S., Tempst P., Lazar M. A., Spiegelman B. M. (2008) Genes. Dev. 22, 1397–1409 [DOI] [PMC free article] [PubMed] [Google Scholar]
- 20.Hildebrand J. D., Soriano P. (2002) Mol. Cell. Biol. 22, 5296–5307 [DOI] [PMC free article] [PubMed] [Google Scholar]
- 21.Funnell A. P., Maloney C. A., Thompson L. J., Keys J., Tallack M., Perkins A. C., Crossley M. (2007) Mol. Cell. Biol. 27, 2777–2790 [DOI] [PMC free article] [PubMed] [Google Scholar]
- 22.Perdomo J., Verger A., Turner J., Crossley M. (2005) Mol. Cell. Biol. 25, 1549–1559 [DOI] [PMC free article] [PubMed] [Google Scholar]
- 23.Lee M. E., Temizer D. H., Clifford J. A., Quertermous T. (1991) J. Biol. Chem. 266, 16188–16192 [PubMed] [Google Scholar]
- 24.Ko L. J., Yamamoto M., Leonard M. W., George K. M., Ting P., Engel J. D. (1991) Mol. Cell. Biol. 11, 2778–2784 [DOI] [PMC free article] [PubMed] [Google Scholar]
- 25.Tsang A. P., Visvader J. E., Turner C. A., Fujiwara Y., Yu C., Weiss M. J., Crossley M., Orkin S. H. (1997) Cell 90, 109–119 [DOI] [PubMed] [Google Scholar]
- 26.Turner J., Crossley M. (1998) EMBO J. 17, 5129–5140 [DOI] [PMC free article] [PubMed] [Google Scholar]
- 27.Eaton S. A., Funnell A. P., Sue N., Nicholas H., Pearson R. C., Crossley M. (2008) J. Biol. Chem. 283, 26937–26947 [DOI] [PMC free article] [PubMed] [Google Scholar]
- 28.Sue N., Jack B. H., Eaton S. A., Pearson R. C., Funnell A. P., Turner J., Czolij R., Denyer G., Bao S., Molero-Navajas J. C., Perkins A., Fujiwara Y., Orkin S. H., Bell-Anderson K., Crossley M. (2008) Mol. Cell. Biol. 28, 3967–3978 [DOI] [PMC free article] [PubMed] [Google Scholar]
- 29.Katz S. G., Cantor A. B., Orkin S. H. (2002) Mol. Cell. Biol. 22, 3121–3128 [DOI] [PMC free article] [PubMed] [Google Scholar]
- 30.Hong W., Nakazawa M., Chen Y. Y., Kori R., Vakoc C. R., Rakowski C., Blobel G. A. (2005) EMBO J. 24, 2367–2378 [DOI] [PMC free article] [PubMed] [Google Scholar]
- 31.Matthews J. M., Kowalski K., Liew C. K., Sharpe B. K., Fox A. H., Crossley M., MacKay J. P. (2000) Eur. J. Biochem. 267, 1030–1038 [DOI] [PubMed] [Google Scholar]
- 32.Nichols K. E., Crispino J. D., Poncz M., White J. G., Orkin S. H., Maris J. M., Weiss M. J. (2000) Nat. Genet. 24, 266–270 [DOI] [PMC free article] [PubMed] [Google Scholar]
- 33.Schupp M., Cristancho A. G., Lefterova M. I., Hanniman E. A., Briggs E. R., Steger D. J., Qatanani M., Curtin J. C., Schug J., Ochsner S. A., McKenna N. J., Lazar M. A. (2009) J. Biol. Chem. 284, 9458–9464 [DOI] [PMC free article] [PubMed] [Google Scholar]
- 34.Tsang A. P., Fujiwara Y., Hom D. B., Orkin S. H. (1998) Genes Dev. 12, 1176–1188 [DOI] [PMC free article] [PubMed] [Google Scholar]
- 35.Svensson E. C., Huggins G. S., Lin H., Clendenin C., Jiang F., Tufts R., Dardik F. B., Leiden J. M. (2000) Nat. Genet. 25, 353–356 [DOI] [PubMed] [Google Scholar]
- 36.Hyun S., Lee J. H., Jin H., Nam J., Namkoong B., Lee G., Chung J., Kim V. N. (2009) Cell 139, 1096–1108 [DOI] [PubMed] [Google Scholar]
- 37.Leonardsson G., Steel J. H., Christian M., Pocock V., Milligan S., Bell J., So P. W., Medina-Gomez G., Vidal-Puig A., White R., Parker M. G. (2004) Proc. Natl. Acad. Sci. U.S.A. 101, 8437–8442 [DOI] [PMC free article] [PubMed] [Google Scholar]
- 38.Vo N., Fjeld C., Goodman R. H. (2001) Mol. Cell. Biol. 21, 6181–6188 [DOI] [PMC free article] [PubMed] [Google Scholar]
- 39.Chen S., Whetstine J. R., Ghosh S., Hanover J. A., Gali R. R., Grosu P., Shi Y. (2009) Proc. Natl. Acad. Sci. U.S.A. 106, 1496–1501 [DOI] [PMC free article] [PubMed] [Google Scholar]
- 40.Zhang Q., Wang S. Y., Fleuriel C., Leprince D., Rocheleau J. V., Piston D. W., Goodman R. H. (2007) Proc. Natl. Acad. Sci. U.S.A. 104, 829–833 [DOI] [PMC free article] [PubMed] [Google Scholar] [Retracted]
- 41.Martín D., Piulachs M. D., Raikhel A. S. (2001) Mol. Cell. Biol. 21, 164–174 [DOI] [PMC free article] [PubMed] [Google Scholar]
- 42.Chinnadurai G. (2007) Int. J. Biochem. Cell. Biol. 39, 1593–1607 [DOI] [PubMed] [Google Scholar]
Associated Data
This section collects any data citations, data availability statements, or supplementary materials included in this article.


