Abstract
Botryococcus braunii, B race is a unique green microalga that produces large amounts of liquid hydrocarbons known as botryococcenes that can be used as a fuel for internal combustion engines. The simplest botryococcene (C30) is metabolized by methylation to give intermediates of C31, C32, C33, and C34, with C34 being the predominant botryococcene in some strains. In the present work we have used Raman spectroscopy to characterize the structure of botryococcenes in an attempt to identify and localize botryococcenes within B. braunii cells. The spectral region from 1600–1700 cm−1 showed ν(C=C) stretching bands specific for botryococcenes. Distinct botryococcene Raman bands at 1640 and 1647 cm−1 were assigned to the stretching of the C=C bond in the botryococcene branch and the exomethylene C=C bonds produced by the methylations, respectively. A Raman band at 1670 cm−1 was assigned to the backbone C=C bond stretching. Density function theory calculations were used to determine the Raman spectra of all botryococcenes to compare computed theoretical values with those observed. The analysis showed that the ν(C=C) stretching bands at 1647 and 1670 cm−1 are actually composed of several closely spaced bands arising from the six individual C=C bonds in the molecule. We also used confocal Raman microspectroscopy to map the presence and location of methylated botryococcenes within a colony of B. braunii cells based on the methylation-specific 1647 cm−1 botryococcene Raman shift.
Keywords: Cell Compartmentation, Computation, Lipid Structure, Plant, Raman Spectroscopy, Botryococcus braunii, Biofuel, Green Algae, Hydrocarbons
Introduction
In recent years, interest in the use of green algae as a source of biofuels has increased due to the need to reduce greenhouse gas emissions and because of depletion of world petroleum reserves (1). For algae to produce enough oil to meet fuel demands, large scale culturing of algae and monitoring of oil production will be required (2, 3). Current analysis methods for monitoring algal oil production are complicated, time consuming, and destructive (4). Thus, a simple and nondestructive method for analyzing algal oil composition is required. Raman spectroscopy is such a technique and has been used to detect various molecular compounds in algae, both to detect algae in aqueous samples and differentiate algal strains, as well as analyze cellular triglycerides, the most common oil used to produce biofuels (4–15). Thus, Raman spectroscopy has great potential to be used as an in vivo detection method for monitoring algal oil production.
The green colonial microalgae Botryococcus braunii is a prodigious producer of liquid hydrocarbon oils, which are mainly (90–95%) stored in the colony extracellular matrix with the remaining found inside the cells (16–20). There are three races of B. braunii, which are classified based on the type of hydrocarbons they produce. The A race produces fatty acid-derived alkadienes and alkatrienes (21–24); the L race produces the tetraterpene lycopadiene (25, 26); and the B race, the focus of this study, produces triterpenes known as botryococcenes (19, 22, 27). Hydrocarbons from all three races of B. braunii can be converted into fuels suitable for combustion engines and have been found as major constituents of currently used petroleum and coal deposits (18, 28–39). These attributes have made B. braunii an attractive source of renewable biofuels, especially the B race because botryococcenes can be converted into high octane gasoline, kerosene, and diesel fuels (18).
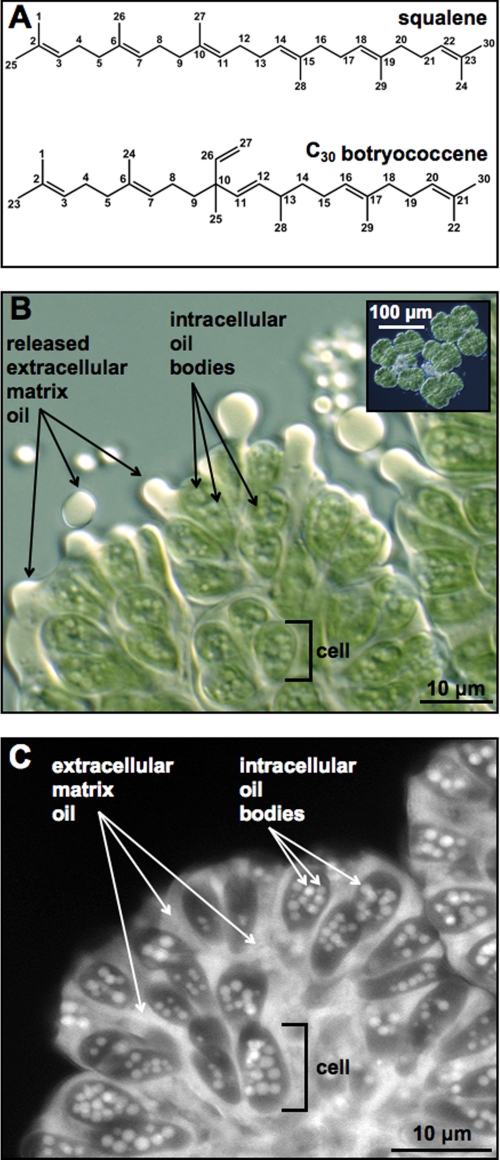
Botryococcenes are biosynthesized through the isoprenoid pathway and are similar in structure to another common triterpene, squalene (40, 41). Both botryococcene and squalene are C30 compounds produced by the condensation of two molecules of C15 farnesyl diphosphate. However, they differ in how the farnesyl molecules are connected; squalene has a connection of carbon 1′ of one farnesyl molecule to carbon 1 of the second farnesyl molecule (1′–1 connection), whereas C30 botryococcene has a 1′–3 connection of the two farnesyl molecules (40, 42). This bonding pattern for botryococcenes produces a central branch with C=C bonds at C-11 and C-26 of C30 botryococcene that are not found in squalene (Fig. 1A). Once produced, C30 botryococcene is further metabolized by methylation at carbons 3, 7, 16, and 20 to produce C31, C32, C33, and C34 botryococcenes (19, 43, 44), and even further methylated to C36 and C37 botryococcenes in some B race strains (22, 45). In C34 botryococcene-producing strains such as the Berkeley (Showa) strain, the majority (>99%) of the C34 botryococcenes exist in the extracellular matrix whereas the intracellular oil comprises predominantly the lower carbon number botryococcenes (19, 20). These botryococcenes are excreted to the extracellular matrix as they mature to C34 botryococcene (19, 20). The intracellular botryococcenes are presumed to be located in the numerous intracellular oil bodies found within B. braunii cells (16–18). However, there has been no evidence reported to indicate that these intracellular oil bodies actually contain botryococcenes or any other classes of lipids such as triglycerides. Moreover, if these oil bodies are actually composed of botryococcenes, there is no information as to what kinds of botryococcene homologs exist in the droplets.
FIGURE 1.
Microscopy and Nile red fluorescent imaging of B. braunii cells. A, structure of squalene and C30 botryococcene. B, transmitted light microscope image of a partial B. braunii colony showing pressure-released extracellular oil and intracellular oil bodies. A B. braunii colony was subjected to pressure by gently pressing on the microscope slide coverslip to expel extracellular oil. Inset shows full B. braunii colony for perspective. C, colony of B. braunii treated with Nile red and viewed by fluorescent microscopy to visualize the Nile red-stained extracellular matrix oil and intracellular oil bodies.
Spectroscopic characterization, other than NMR, of B. braunii hydrocarbons is extremely limited (13, 46). A characteristic absorbance spectroscopy peak for botryococcenes has been identified and used to quantitate extracted botryococcenes (46). Raman spectroscopy has been used on the A race of B. braunii to determine that the intracellular oils were similar in nature to the extracellular oils and that these oils were composed of long chain unsaturated hydrocarbons (13). Specific characterization by Raman spectroscopy for any hydrocarbon from any race of B. braunii has not been reported. There are several C=C bonds in botryococcenes that offer unique Raman spectroscopic parameters. For example, the methylation of C30–C33 botryococcenes causes C=C bond migration from the backbone endo positions to exo positions at carbons 2, 6, 17, and 21 to create exomethylene groups (Fig. 1A). Additionally, the C-26 branch C=C bond is specific to botryococcenes. In our present work we report characterization of botryococcenes from the B race of B. braunii by Raman spectroscopy and density function theory (DFT)2 calculations. Additionally, an identified Raman signature specific to methylated botryococcenes is used to map in vivo the presence of methylated botryococcenes in the extracellular matrix and intracellular oil bodies of live B. braunii cells.
EXPERIMENTAL PROCEDURES
Algal Culturing
B. braunii, Berkeley (Showa), B race (47) were grown in modified Chu 13 media (48) using 13-W compact fluorescent 65 K lighting at a distance of 7.62 cm, which produced a light intensity of 280 μmol photons · m−2 · s−1. Lighting was on a cycle of 12-h light:12-h dark at 22.5 °C. The cultures were continuously aerated with filter-sterilized, enriched air containing 2.5% CO2. Fifty ml of culture was used to inoculate 750 ml of subsequent subcultures every 4 weeks. The remaining culture volume was harvested by vacuum filtration using 35 μm nylon mesh (Aquatic Ecosystems, Inc., Apopka, FL). The accumulated colonies were rinsed with sterilized dH2O, frozen in liquid nitrogen, and stored at −80 °C.
Purification and Structural Determination of B. braunii Botryococcenes
Botryococcenes were purified from freeze-dried B. braunii samples as described previously (49, 50). In brief, 10 g of freeze-dried B. braunii cells was extracted in n-hexane to remove extracellular hydrocarbons followed by a chloroform:methanol (2:1) extraction to remove intracellular hydrocarbons. Both extracts were evaporated to dryness, resuspended in n-hexane, combined, applied to an n-hexane gravity-fed silica column, and a total hydrocarbon fraction was collected as the eluate prior to the pigment front. The total hydrocarbon fraction was evaporated to dryness, resuspended in 0.5 volume of acetone, and separated by HPLC using a 20 × 250-mm Cosomil 5C18-AR-II column with 100% MeOH mobile phase at a flow rate of 9 ml/min, detection at 210 nm. Botryococcenes eluted as follows: C30 botryococcene (∼27 min), C32 and C33 in one peak (∼30 min). To separate impurities from C30 botryococcene and to separate C32 and C33 botryococcenes, samples were applied sequentially to a 20 × 250-mm Develosil 60 silica, 3-μm HPLC column with 100% n-hexane mobile phase at a flow rate of 8 ml/min, detection at 210 nm. Botryococcenes eluted as follows: C30 botryococcene (∼32 min), C32 (∼27 min), and C33 (∼25 min). Purity of the isolated botryococcenes was analyzed with a Shimadzu GC-2014 with a 60-m DB-1 column (J & W Science), 0.25-mm inner diameter, 0.25-μm film, helium carrier gas, 250-kPa head pressure, 250 °C injection temperature, FID detector at 260 °C, and a temperature program of 50 °C for 1 min, raised to 220 °C at 10 °C/min, raised to 260 °C at 2 °C/min, hold at 260 °C for 40 min. Botryococcenes retention times as follows: C30 botryococcene (∼42 min), C32 (∼46 min), and C33 (∼48 min). A C34 botryococcene was obtained from a previous analysis (50). The molecular mass of all purified botryococcenes was confirmed by fast atom bombardment-mass spectroscopy using m-nitrobenzyl alcohol as a matrix on a JEOL SX 102 mass spectrometer, and their plane structures were confirmed by measuring 1H and 13C NMR spectra in CDCl3 using a JEOL alpha 600 NMR spectrometer at 600 MHz and 150 MHz, respectively. The NMR data were compared with those for known botryococcenes (41, 49).
Raman Spectroscopy
Raman spectra of squalene (Sigma), total hydrocarbon extract, and purified botryococcenes (all in n-hexane in a cuvette) were obtained at Horiba Scientific (Edison, NJ) using a Horiba LabRam HR 800 confocal Raman microscope. The Raman spectrometer was coupled with an Olympus BXFM microscope and a liquid nitrogen-cooled CCD detector. The excitation source was a Melles-Griot laser operating at 532 nm with a 50-mW output. A singlet lens with a focal length of 40 mm was used.
Raman spectra of squalene and total hydrocarbon extract contained in vials without solvent were also recorded with a Jobin Yvon U-1000 double monochromator equipped with a liquid nitrogen-cooled CCD detector. A Coherent Verdi-V10 laser operating at 532 nm was utilized as the excitation source. A laser power of 2 W was typically used.
In vivo mapping by confocal Raman spectroscopy was performed at the Texas A&M Materials Characterization Facility using a Horiba Jobin Yvon LabRam IR system with an Olympus BX 41 microscope, a computer-controlled motorized XYZ microscope stage, and a liquid nitrogen-cooled CCD detector. Excitation was achieved with a laser wave length of 785 nm at an output power of 20 mW. The spectral maps were recorded with a spectral resolution of 0.16 cm−1 and pixel size of 275 nm with an UPLSAPO 100×/1.4 oil immersion objective. Cell photobleaching was performed using a 785-nm laser at a power output of 500 mW for at least 20 min. Exact treatment times varied as colony cell density varied across the z axis. Photobleaching was considered complete once the high, consistent Raman intensities across 200–3600 cm−1 sufficiently decreased to allow detection of individual Raman peaks and remained static for at least 2 min.
All Raman spectra were collected in 60-cm−1 segments with accumulation times of 1000 s for each segment. Spectra were analyzed for peak wavenumbers using the LabSpec program version 5.58.25.
DFT Calculations
DFT computations used the GAUSSIAN 03 package (51) to obtain the calculated vibrational frequencies and produce the computed Raman spectra. The B3LYP/cc-pvtz basis set was utilized. A scaling factor of 0.969 was applied for all frequencies. This value was selected to match the observed and calculated ν(C=C) stretching frequencies for squalene. The computed spectra were produced using the GaussView 4.1.2 program.
Microscopy and Nile Red Staining
Microscopy imaging of B. braunii colonies was performed at the Texas A&M University Microscopy and Imaging Center. For visualization of botryococcenes using Nile red (Sigma), 1 ml of B. braunii colonies in medium at stationary phase density were treated with 2.5 μl of a stock solution of Nile red dissolved in acetone (0.15 mg/ml) so that the final concentrations of Nile red and acetone were 0.375 μg/ml and 0.25%, respectively. Samples were kept in the dark and incubated at room temperature for 15 min. Fluorescence microscopy visualization was performed with a Zeiss Axiophot microscope equipped with a GFP filter set (excitation, 450–490 nm; emission, 500–550 nm), Plan Neofluar 100×/1.3 oil immersion objective, and a Coolsnap CF monochrome CCD camera (Photometrics, Tucson, AZ) controlled by MetaView version 5.2 software (Molecular Devices, Downingtown, PA). For transmitted light imaging, differential interference contrast optics and a Nikon DXM1200C (Nikon Instruments, Melville, NY) color CCD camera were used on the same microscope.
RESULTS AND DISCUSSION
B. braunii System Description–Most of the botryococcene oils in B. braunii, B race, localize to the colony extracellular matrix and can be released with pressure (Fig. 1B). It is well known that B. braunii cells also have many intracellular oil bodies (16–18) (Fig. 1B). Both these intracellular oil bodies and extracellular oil can be visualized using the fluorescent neutral lipid-binding stain Nile red, which has been used to accurately estimate B. braunii oil content in high-throughput screens (52–54). Therefore, we used fluorescence microscopy and Nile red to show the dramatic accumulation of lipids in the extracellular matrix and in intracellular oil bodies (Fig. 1C). Lipids detected by Nile red fluorescence (white to gray signal) show that each cell of the colony contains many individual oil bodies (Fig. 1C). As mentioned above, the lipid composition of these intracellular oil bodies is not known; i.e. do they contain botryococcenes? If so, do all oil bodies consist of one molecular species of botryococcene, or are they a mixture of all botryococcenes? Because Nile red is a bulk lipid-binding molecule it does not differentiate among the different botryococcenes species and cannot be used to address these questions. Thus, the ultimate goal of our research is to use Raman microspectroscopy to detect specific botryococcenes within both the extracellular matrix and intracellular oil drops to begin to address the questions about oil body botryococcene composition. The use of a confocal Raman microscope for the investigation of intracellular oil drops has the potential to eliminate the out-of-focus signal and suppress the inherently high autofluorescence background from the large chloroplast sheet enveloping the cell.
Experimental Raman Spectra for Botryococcenes
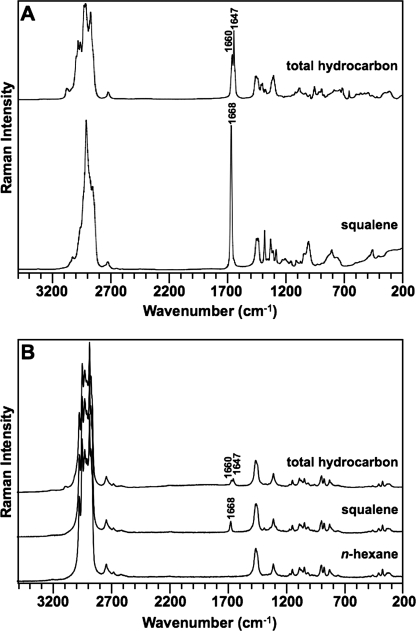
To identify spectral regions that contain specificity for botryococcenes, Raman spectroscopy was applied to squalene and a total hydrocarbon extract from B. braunii, B race. Because a total hydrocarbon extract from some strains of the B race of B. braunii, for example the Berkeley strain, is predominantly C34 botryococcene (41, 49, 50) and GC analysis of our total hydrocarbon extract shows C34 botryococcene as the primary constituent (see supplemental Fig. S1), comparison of the two spectra should indicate regions unique to botryococcenes. Analysis of the two spectra indicates similarity across the spectra (Fig. 2A). However, we chose to focus on the 1600–1700 cm−1 region for ν(C=C) stretching vibration because the main structural differences between squalene and botryococcenes are in the C=C bond positions. Within this spectral region, squalene generated a single band at 1668 cm−1, and the total hydrocarbon fraction generated two bands at 1647 and 1660 cm−1 (Fig. 2A). Because the subsequent analysis of purified botryococcenes was performed in n-hexane (see below), the Raman spectra of squalene and total hydrocarbons dissolved in n-hexane were analyzed to ensure that the difference in the ν(C=C) stretching region could still be detected in the presence of n-hexane. As shown in Fig. 2B, the 1600–1700 cm−1 ν(C=C) stretching region of the spectra of squalene and total hydrocarbons in n-hexane shows the same bands seen without n-hexane. However, the absolute intensity was reduced (compare Fig. 2, A and B). The n-hexane sample alone did not show these bands (Fig. 2B).
FIGURE 2.
Raman spectra of squalene and total B. braunii hydrocarbons. A, total hydrocarbon extract from B. braunii and a pure, commercially acquired squalene sample were analyzed by Raman spectroscopy without solvent. B, B. braunii total hydrocarbon extract and squalene samples from A were solubilized in n-hexane and analyzed by Raman spectroscopy. Analysis was performed on n-hexane alone to determine background Raman spectra.
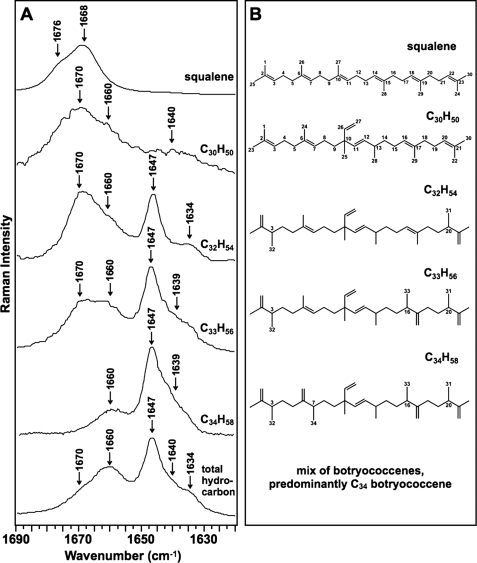
Next, Raman spectroscopy was applied to individual botryococcenes in n-hexane and analyzed in the ν(C=C) stretching region to identify bands specific to the botryococcene structure. Pure C30, C32, C33, and C34 botryococcenes were obtained by HPLC, purity was confirmed by GC, molecular weights were confirmed by fast atom bombardment-mass spectroscopy, and structures were confirmed by NMR as described previously (41, 49, 50). We were unable to purify sufficient quantities of C31 botryococcene to analyze by Raman spectroscopy at this time and obtained a minimal amount of C30 botryococcene (3 mg) to obtain a workable spectrum. Analysis of all bands identified in the 1600–1700 cm−1 ν(C=C) stretching region of the spectra reveals that several of the bands can be assigned to specific bonds in botryococcenes. The band at 1647 cm−1 is seen in all botryococcenes except for C30 botryococcene (Fig. 3A). Because C30 botryococcene lacks methylation (Fig. 3B), this suggests that the 1647 cm−1 band originates from the exomethylene groups generated by the methylation events. The band at 1670 cm−1 is seen in all botryococcenes except C34 botryococcene (Fig. 3A), suggesting that it is due to the backbone C=C bonds because C34 botryococcene lacks these bonds with the exception of the C=C bond at C-11 (Fig. 3B). Moreover, squalene, which possesses only backbone C=C bonds, has its maximum Raman intensity at 1668 cm−1. The bands at 1639 and 1660 cm−1 are more difficult to assign but appear to be specific to botryococcenes compared with squalene (Fig. 3A). These bands may be assigned to the branch C=C bond at C-26 and the backbone C=C bond at C-11 that are found in all botryococcenes (Fig. 3B). This is supported by the spectrum for C34 botryococcene (Fig. 3A), which has three major bands: 1647 cm−1 attributed to the exomethylene groups and 1639 and 1660 cm−1, which should be attributable to the C-26 and C-11 C=C bonds because they are the only other C=C bonds in C34 botryococcene (Fig. 3B). However, with these data it is difficult to assign these bands specifically to the C-26 or C-11 C=C bonds. A band at 1634 cm−1 is also seen in C32 botryococcene which cannot be assigned at this time.
FIGURE 3.
Raman spectra for the ν(C=C) stretching region of botryococcenes. A, indicated botryococcenes were purified from B. braunii by HPLC, dissolved in n-hexane, analyzed by Raman spectroscopy within the ν(C=C) stretching region, and compared with that for the total hydrocarbon extract and pure squalene. B, structures of squalene and individual botryococcenes analyzed in A.
These Raman spectra indicate that the Raman bands of 1639, 1647, 1660, and 1670 cm−1 are specific for botryococcenes. Thus, these bands could be used as diagnostic signatures for the presence of botryococcenes. The 1647 cm−1 band is specifically due to botryococcene methylation and may offer the best signature for Raman spectroscopy identification of botryococcenes. This is supported by the Raman spectrum of the total hydrocarbon fraction, which shows the four main botryococcene-specific bands of 1639, 1647, 1660, and 1670 cm−1 (Fig. 3A). Additionally, the band of 1634 cm−1 was detected in the total hydrocarbon fraction that was seen for C32 botryococcene and cannot be assigned at this time (Fig. 3A). It should be noted that the increasing methylation of botryococcenes is correlated with a shift of bands in the Raman spectra from the 1670 cm−1 region toward the 1647 cm−1 region (Fig. 3A).
Computational Analysis
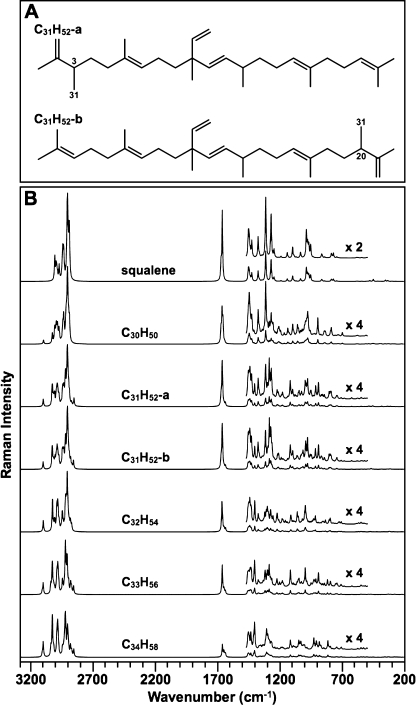
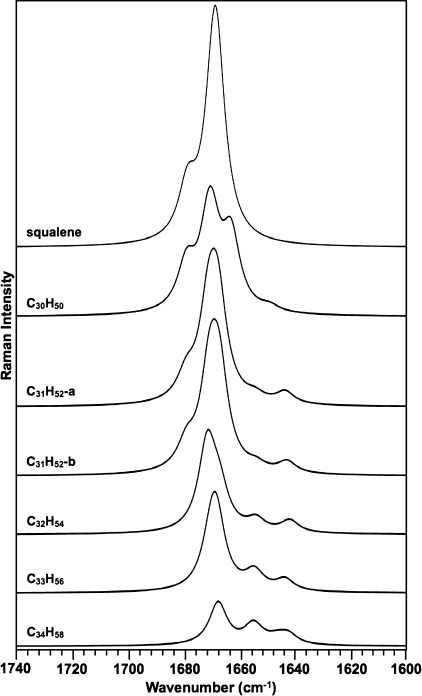
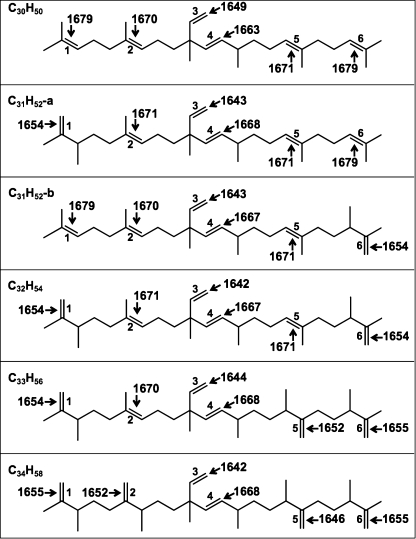
Because we could not obtain sufficient quantities of C31 botryococcene for Raman spectroscopy and could not specifically assign the 1639 and 1660 cm−1 bands (Fig. 3A), DFT calculations were used to address these problems as well as support our experimental spectra interpretation. There are two isomers of C31 botryococcene (Fig. 4A) that have been identified in B. braunii by methylation of C30 botryococcene at C-3 or C-20 (49, 50, 55) (Fig. 4A). The full Raman spectra from the calculations indicate that the major differences among all the botryococcenes analyzed are in the ν(C=C) stretching region as seen in the experimental spectra (Fig. 4B). Analysis of the 1600–1700 cm−1 region for ν(C=C) stretching shows strong similarities to our experimental spectra (Fig. 5). Fig. 5 shows the computed spectra for this region, and Table 1 lists the calculated wavenumber values and compares them with those observed experimentally. It should be noted that each molecule has six independent ν(C=C) stretching frequencies, but these may overlap to produce only two or three Raman bands depending on the type (backbone, exomethylene, or branch) of C=C bond present. Fig. 6 shows the individual stretching frequency calculated for each specific C=C bond for each of the molecules. Remarkably, the stretching vibration of each individual C=C bond is shown by the calculations to be almost totally independent and uncoupled to any of the other ν(C=C) stretching motions or to any other vibration. What is clearly evident from Figs. 5 and 6 and Table 1 is that the three types of ν(C=C) stretching vibrations fall into distinct spectral regions. The backbone ν(C=C) stretching wavenumbers are calculated to be between 1663 and 1679 cm−1 for all the molecules and are observed in the 1660–1670 cm−1 region. The exomethylene stretches are calculated to be between 1646 and 1655 cm−1 and are all observed at 1647 cm−1. The branch C=C stretches are computed to be in the 1642–1649 cm−1 range and are experimentally observed at 1639–1640 cm−1.
FIGURE 4.
DFT-calculated Raman spectra for botryococcenes. A, structure of the two forms of C31 botryococcene identified in B. braunii. B, DFT-calculated Raman spectra for squalene and the indicated botryococcenes. DFT calculations were performed using the GAUSSIAN 03 package, and the computed spectra were assembled using the GaussView 4.1.2 program.
FIGURE 5.
DFT-calculated Raman spectra for squalene and all botryococcenes in the ν(C=C) stretching region. All calculations and spectra were generated as in Fig. 4.
TABLE 1.
Comparison of observed and calculated Raman bands for botryococcenes
| Molecule | C=C type | Bond number (as shown in Fig. 6) | Frequency range |
|
|---|---|---|---|---|
| Observed | Calculated | |||
| cm−1 | cm−1 | |||
| C30H50 | Backbone | 1, 2, 4, 5, 6 | 1670 | 1663–1679 |
| Exomethylene | NPa | NP | NP | |
| Branch | 3 | 1640 | 1649 | |
| C31H52-a | Backbone | 2, 4, 5, 6 | NDb | 1668–1679 |
| Exomethylene | 1 | ND | 1654 | |
| Branch | 3 | ND | 1643 | |
| C31H52-b | Backbone | 1, 2, 4, 5 | ND | 1667–1679 |
| Exomethylene | 6 | ND | 1654 | |
| Branch | 3 | ND | 1643 | |
| C32H54 | Backbone | 2, 4, 5 | 1670 | 1667–1671 |
| Exomethylene | 1, 6 | 1647 | 1654 | |
| Branch | 3 | 1639 | 1642 | |
| C33H56 | Backbone | 2, 4 | 1670 | 1668–1670 |
| Exomethylene | 1, 5, 6 | 1647 | 1652–1655 | |
| Branch | 3 | 1639 | 1644 | |
| C34H58 | Backbone | 4 | 1660 | 1668 |
| Exomethylene | 1, 2, 5, 6 | 1647 | 1646–1655 | |
| Branch | 3 | 1639 | 1642 | |
a Not present in this structure.
b Not determined.
FIGURE 6.
Calculated Raman wavenumbers for each C=C bond of individual botryococcenes. Numbers 1–6 indicate bond number for reference in Table 1.
Because the calculated Raman spectra were determined for fixed bonds of a linear botryococcene structure, we analyzed how different conformations of the botryococcene structure would affect the Raman spectra. The spectra for three different conformers of C30 botryococcene were calculated based on rotation of the bond at C-18, C-15, or C-5 (supplemental Fig. S2A). The full Raman spectra of these conformers appear to be very similar to that of the experimental and calculated spectra for linear botryococcenes (supplemental Fig. S2A). However, analysis of the 1600–1700 cm−1 ν(C=C) stretching region shows that the spectra of the C30 botryococcene conformers have three bands similar to the linear C30 botryococcene, but the intensity of the bands varies depending on the conformation (supplemental Fig. S2B). This would indicate that different conformers of C30 and other botryococcenes may not be easily identifiable by Raman spectroscopy in a cell sample with a complex mixture of botryococcenes.
It should be noted that each of these molecules has a large number of vibrations (3N – 6 where N = number of atoms), and all of these are Raman-active. Thus, for example, C34H58 has 270 vibrations. These include 58 C–H stretching modes between 2800 and 3200 cm−1 and 33 skeletal stretching vibrations, including the ν(C=C) stretching modes. The remainder are various types of angle bending, twisting, wagging, rocking, etc. motions, and all are below 1500 cm−1. In our present work we focus on the ν(C=C) stretching vibrations (1600–1700 cm−1) because these are well separated from all other modes and provide the means for discriminating between the different botryococcenes and their three types of C=C double bonds (backbone, exomethylene, and branch).
In Vivo Raman Spectroscopy Mapping of Botryococcenes
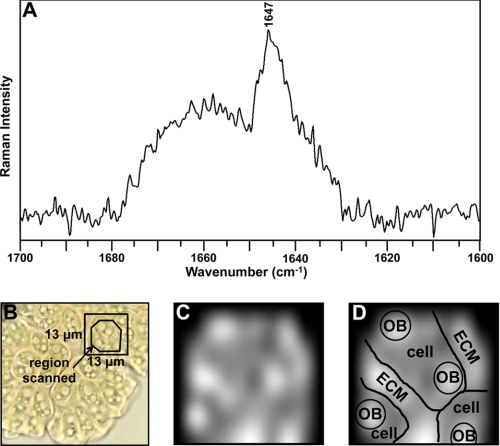
The Raman spectroscopy analysis presented here indicates that specific Raman bands can be used as markers for the presence of botryococcenes in live B. braunii cells and/or colonies. This is especially true for the 1647 cm−1 band that is specific for indicating the presence of methylated botryococcenes (Fig. 3A). Thus, Raman microspectroscopy was applied to a colony of B. braunii to map the presence of botryococcenes in the extracellular matrix and intracellular oil bodies. A roughly circular region within a 13 × 13-μm area of a B. braunii colony was scanned as shown in Fig. 7B. Raman spectroscopy required photobleaching the cells because chlorophyll autofluorescence caused high background that interfered with detection of botryococcene-specific Raman bands (supplemental Fig. S3). Spectroscopy was implemented after photobleaching, and the Raman spectrum in the 1700–1600 cm−1 region is shown in Fig. 7A. Detection of the botryococcene methylation-specific 1647 cm−1 band was evident and was the most prominent band in the spectrum (Fig. 7A). The high level of background within this spectrum prevented us from defining other botryococcene-specific bands.
FIGURE 7.
Mapping of methylated botryococcenes in a B. braunii colony. A, in vivo Raman spectrum of a B. braunii colony. The laser of the confocal Raman microscope was focused on a 13 × 13-μm region of a colony of B. braunii, as shown in B, and the Raman spectrum of the region recorded. B, light microscope image of the B. braunii colony before photobleaching for Raman spectroscopy. Boxed region indicates region used for analysis in A. C, mapping of the 1647 cm−1-specific botryococcene Raman band in the B. braunii colony. D, graphical representation of colony structure in C. OB, oil body; ECM, extracellular matrix.
Next, we mapped the detection of the botryococcene methylation-specific 1647 cm−1 band at 54 points yielding a spectral map of the scanned region of the B. braunii colony. The presence of the 1647 cm−1 band was assigned a white color with diminishing detection levels of the 1647 cm−1 band scaled to gray. Because our cells were photobleached prior to Raman analysis, the cells and extracellular matrix could not be distinguished by a microscopy image. Thus, Fig. 7D shows a graphical representation of the colony and cell structure. The results show, as expected and reported (19, 43, 44), that the extracellular matrix has high amounts of methylated botryococcenes (Fig. 7, C and D), likely C34 botryococcene because it is mostly found in the extracellular matrix (16–20). The intracellular oil bodies also contained methylated botryococcenes as determined by detection of the 1647 cm−1 band (Fig. 7, C and D). Unfortunately, we were not able to determine the specific botryococcene makeup of the individual oil bodies beyond the presence of methylated botryococcenes because we were not able to assign and map additional Raman bands due to the high background in our analysis and sample degradation from prolonged interrogation (Fig. 7A).
B. braunii also produces squalene-based hydrocarbons that contain exomethylene groups similar to that found in botryococcenes. Tetramethylsqualene is produced by methylation at C-3, -7, -18, and -22 of squalene, which produces exomethylene groups at C-1, -26, and -29, and -24 (49, 56, 57). Tetramethylsqualene can also be combined with long chain polyaldehydes and carotenoids to produce polyacetals and botryoxanthins, respectively (58–60). Because of the exomethylene similarities between methylated botryococcenes and tetramethylsqualene, it is possible that our detection of the 1647 cm−1 band in the B. braunii colony (Fig. 7A) is partially attributable to tetramethylsqualene and its derivatives. However, the levels of free tetramethylsqualene and botryoxanthins in B. braunii colonies are minute (0.009–0.033% dry weight) (49, 56, 58–60) and thus, unlikely to be detected by our Raman system. However, one strain of B. braunii, race B, contains levels of methylated squalenes up to 4.5% dry weight (57). Levels of tetramethylsqualene polyacetals are much higher and can comprise up to 10% of algal dry weight (58). This suggests that in vivo Raman microspectroscopy detection may be possible and that these compounds may contribute to the detection and mapping of the 1647 cm−1 band in Fig. 7. But, it should be noted that tetramethylsqualene polyacetals are found predominantly within the B. braunii cell walls and not in oil bodies or the extracellular matrix (58). Exact wavenumber assignment to the C=C bonds in tetramethylsqualene and its derivatives will require isolation of pure compounds and Raman spectroscopy analysis. Given the difficulty in isolating milligram quantities of these compounds, DFT calculations may offer the best approach for estimating wavenumber assignments.
These studies have identified specific Raman spectroscopic characteristics for botryococcenes of B. braunii, B race. Additionally, a botryococcene methylation-specific Raman signature can be detected in living B. braunii cells, indicating that Raman spectroscopy is a powerful tool that can be applied to advancing studies on botryococcene biosynthesis. A goal for future studies is to refine the Raman microspectroscopy using instrumentation appropriate to very small photosynthetic cells to fine-map the presence of the different botryococcene homologs in a colony of B. braunii. Of particular interest will be the location of the different botryococcenes within the cells to determine whether there is a biosynthetic, or composition difference among the many intracellular oil bodies. Additionally, Raman spectroscopy could be applied to analyze botryococcenes levels and quality during the development of a B. braunii culture to determine when oil levels are of both maximal quantity and quality for cell harvesting.
Supplementary Material
Acknowledgments
We thank Dr. Amanda Young of the Texas A&M Materials Characterization Facility and Eunah Lee at Horiba Scientific for assistance with Raman spectroscopy.
This work was supported in part by Texas A&M University Department of Biochemistry and Biophysics start-up funds (to T. P. D.), Japan Society for the Promotion of Science Research Fellowship S-09103 (to T. P. D.), Robert A. Welch Foundation Grant A-0396 (to J. L.), and National Science Foundation Grant BES-0421409 (to A. H.).

The on-line version of this article (available at http://www.jbc.org) contains supplemental Figs. S1–S3.
- DFT
- density function theory.
REFERENCES
- 1.Hu Q., Sommerfeld M., Jarvis E., Ghirardi M., Posewitz M., Seibert M., Darzins A. (2008) Plant J. 54, 621–639 [DOI] [PubMed] [Google Scholar]
- 2.Chisti Y. (2008) Trends Biotechnol. 26, 126–131 [DOI] [PubMed] [Google Scholar]
- 3.Chisti Y. (2007) Biotechnol. Adv. 25, 294–306 [DOI] [PubMed] [Google Scholar]
- 4.Huang Y. Y., Beal C. M., Cai W. W., Ruoff R. S., Terentjev E. M. (2010) Biotechnol. Bioeng. 105, 889–898 [DOI] [PubMed] [Google Scholar]
- 5.Wood B. R., Heraud P., Stojkovic S., Morrison D., Beardall J., McNaughton D. (2005) Anal. Chem. 77, 4955–4961 [DOI] [PubMed] [Google Scholar]
- 6.Wagner W. D., Waidelich W. (1986) Appl. Spectrosc. 40, 191–196 [Google Scholar]
- 7.Wu Q., Nelson W. H., Hargraves P., Zhang J., Brown C. W., Seelenbinder J. A. (1998) Anal. Chem. 70, 1782–1787 [DOI] [PubMed] [Google Scholar]
- 8.Brahma S. K., Hargraves P. E., Howard W. F., Nelson W. H. (1983) Appl. Spectrosc. 37, 55–58 [Google Scholar]
- 9.Chen M., Zeng H., Larkum A. W., Cai Z. L. (2004) Spectrochim. Acta A. Mol. Biomol. Spectrosc. 60, 527–534 [DOI] [PubMed] [Google Scholar]
- 10.Kubo Y., Ikeda T., Yang S.-Y., Tsuboi M. (2000) Appl. Spectrosc. 54, 1114–1119 [Google Scholar]
- 11.Li B., Mao D., Liu Y., Li L., Kuang T. (2005) Photosynth. Res. 83, 297–305 [DOI] [PubMed] [Google Scholar]
- 12.Edwards H. G. M., de Oliveira L. F. C., Cockell C. S., Ellis-Evans J. C., Wynn-Williams D. D. (2004) Int. J. Astrobiol. 3, 125–129 [Google Scholar]
- 13.Largeau C., Casadevall E., Berkaloff C., Dhamelincourt P. (1980) Phytochemistry 19, 1043–1051 [Google Scholar]
- 14.Heraud P., Wood B. R., Beardall J., McNaughton D. (2006) J. Chemometrics 20, 193–197 [Google Scholar]
- 15.Heraud P., Beardall J., McNaughton D., Wood B. R. (2007) FEMS Microbiol. Lett. 275, 24–30 [DOI] [PubMed] [Google Scholar]
- 16.Maxwell J. R., Douglas A. G., Eglinton G., McCormick A. (1968) Phytochemistry 7, 2157–2171 [Google Scholar]
- 17.Knights B. A., Brown A. C., Conway E., Middleditch B. S. (1970) Phytochemistry 9, 1317–1324 [Google Scholar]
- 18.Banerjee A., Sharma R., Chisti Y., Banerjee U. C. (2002) Crit. Rev. Biotechnol. 22, 245–279 [DOI] [PubMed] [Google Scholar]
- 19.Metzger P., David M., Casadevall E. (1987) Phytochemistry 26, 129–134 [Google Scholar]
- 20.Wolf F. R., Nonomura A. M., Bassham J. A. (1985) J. Phycol. 21, 388–396 [Google Scholar]
- 21.Templier J., Largeau C., Casadevall E. (1984) Phytochemistry 23, 1017–1028 [Google Scholar]
- 22.Metzger P., Casadevall E., Pouet M. J., Pouet Y. (1985) Phytochemistry 24, 2995–3002 [Google Scholar]
- 23.Metzger P., Templier J., Largeau C., Casadevall E. (1986) Phytochemistry 25, 1869–1872 [Google Scholar]
- 24.Templier J., Largeau C., Casadevall E. (1991) Phytochemistry 30, 2209–2215 [Google Scholar]
- 25.Metzger P., Casadevall E. (1987) Tetrahedron Lett. 28, 3911–3934 [Google Scholar]
- 26.Metzger P., Allard B., Casadevall E., Berkaloff C., Couté A. (1990) J. Phycol. 26, 258–266 [Google Scholar]
- 27.Metzger P., Casadevall E., Couté A. (1988) Phytochemistry 27, 1383–1388 [Google Scholar]
- 28.Traverse A. (1955) Micropaleontology 1, 343–348 [Google Scholar]
- 29.Cane R. F. (1977) Trans. R. Soc. S. Aust. 101, 153–154 [Google Scholar]
- 30.Moldowan J. M., Seifert W. K. (1980) J. C. S. Chem. Commun. 19, 912–914 [Google Scholar]
- 31.Brassell S. C., Eglinton G., Mo F. J. (1986) Org. Geochem. 10, 927–941 [Google Scholar]
- 32.McKirdy D. M., Cox R. E., Volkman J. K., Howell V. J. (1986) Nature 320, 57–59 [Google Scholar]
- 33.Glikson M., Lindsay K., Saxby J. (1989) Org. Geochem. 14, 595–608 [Google Scholar]
- 34.Mastalerz M., Hower J. C. (1996) Org. Geochem. 24, 301–308 [Google Scholar]
- 35.Stasiuk L. D. (1999) Org. Geochem. 30, 1021–1026 [Google Scholar]
- 36.Testa M., Gerbaudo S., Andri E. (2001) Proc. Ocean Drilling Program, Scientific Results 180, 1–6 [Google Scholar]
- 37.Audino M., Grice K., Alexander R., Kagi R. I. (2002) Org. Geochem. 33, 979–984 [Google Scholar]
- 38.Summons R. E., Metzger P., Largeau C., Murray A. P., Hope J. M. (2002) Org. Geochem. 33, 99–109 [Google Scholar]
- 39.Adam P., Schaeffer P., Albrecht P. (2006) Org. Geochem. 37, 584–596 [Google Scholar]
- 40.Okada S., Devarenne T. P., Murakami M., Abe H., Chappell J. (2004) Arch. Biochem. Biophys. 422, 110–118 [DOI] [PubMed] [Google Scholar]
- 41.Sato Y., Ito Y., Okada S., Murakami M., Abe H. (2003) Tetrahedron Lett. 44, 7035–7037 [Google Scholar]
- 42.Huang Z., Poulter C. D. (1989) J. Am. Chem. Soc. 111, 2713–2715 [Google Scholar]
- 43.Casadevall E., Metzger P., Puech M. P. (1984) Tetrahedron Lett. 25, 4123–4126 [Google Scholar]
- 44.Wolf F. R., Nemethy E. K., Blanding J. H., Bassham J. A. (1985) Phytochemistry 24, 733–737 [Google Scholar]
- 45.Galbraith M. N., Hillen L. W., Wake L. V. (1983) Phytochemistry 22, 1441–1443 [Google Scholar]
- 46.Eroglu E., Melis A. (2010) Bioresource Technol. 101, 2359–2366 [DOI] [PubMed] [Google Scholar]
- 47.Nonomura A. M. (1988) Jpn. J. Phycol. 36, 285–291 [Google Scholar]
- 48.Grung M., Metzger P., Liaaen-Jensen S. (1989) Biochem. Syst. Ecol. 17, 263–269 [Google Scholar]
- 49.Okada S., Murakami M., Yamaguchi K. (1995) J. Appl. Phycol. 7, 555–559 [Google Scholar]
- 50.Okada S., Murakami M., Yamaguchi K. (1997) Phytochem. Anal. 8, 198–203 [Google Scholar]
- 51.Frisch M. J., Trucks G. W., Schlegel H. B., Scuseria G. E., Robb M. A., Cheeseman J. R., Montgomery J., Vreven T., Kudin K. N., Burant J. C., Millam J. M., Iyengar S. S., Tomasi J., Barone V., Mennucci B., Cossi M., Scalmani G., Rega N., Petersson G. A., Nakatsuji H., Hada M., Ehara M., Toyota K., Fukuda R., Hasegawa J., Ishida M., Nakajima T., Honda Y., Kitao O., Nakai H., Klene M., Li X., Knox J. E., Hratchian H. P., Cross J. B., Bakken V., Adamo C., Jaramillo J., Gomperts R., Stratmann R. E., Yazyev O., Austin A. J., Cammi R., Pomelli C., Ochterski J. W., Ayala P. Y., Morokuma K., Voth G. A., Salvador P., Dannenberg J. J., Zakrzewski V. G., Dapprich S., Daniels A. D., Strain M. C., Farkas O., Malick D. K., Rabuck A. D., Raghavachari K., Foresman J. B., Ortiz J. V., Cui Q., Baboul A. G., Clifford S., Cioslowski J., Stefanov B. B., Liu G., Liashenko A., Piskorz P., Komaromi I., Martin R. L., Fox D. J., Keith T., Al-Laham M. A., Peng C. Y., Nanayakkara A., Challacombe M., Gill P. M. W., Johnson B., Chen W., Wong M. W., Gonzalez C., Pople J. A. (2004) GAUSSIAN, Version 0.3, Gaussian, Inc., Wallingford CT [Google Scholar]
- 52.Elsey D., Jameson D., Raleigh B., Cooney M. J. (2007) J. Microbiol. Methods 68, 639–642 [DOI] [PubMed] [Google Scholar]
- 53.Lee S. J., Yoon B.-D., Oh H.-M. (1998) Biotech. Tech. 12, 553–556 [Google Scholar]
- 54.Cooksey K. E., Guckert J. B., Williams S. A., Callis P. R. (1987) J. Microbial. Methods 6, 333–345 [Google Scholar]
- 55.Huang Z., Poulter C. D. (1989) Phytochemistry 28, 3034–3046 [Google Scholar]
- 56.Huang Z., Poulter C. D. (1989) Phytochemistry 28, 1467–1470 [Google Scholar]
- 57.Achitouv E., Metzger P., Rager M-N., Largeau C. (2004) Phytochemistry 65, 3159–3165 [DOI] [PubMed] [Google Scholar]
- 58.Metzger P., Rager M. N., Largeau C. (2007) Org. Geochem. 38, 566–581 [Google Scholar]
- 59.Okada S., Matsuda H., Murakami M., Yamaguchi K. (1996) Tetrahedron Lett. 37, 1065–1068 [Google Scholar]
- 60.Okada S., Tonegawa I., Matsuda H., Murakami M., Yamaguchi K. (1998) Phytochemistry 47, 1111–1115 [Google Scholar]
Associated Data
This section collects any data citations, data availability statements, or supplementary materials included in this article.


