It can hardly be argued that cardiac imaging methodologies targeting small-animal models have been crucial for rapidly transitioning therapies from bench to bedside. The adaptation of ultrasound for imaging murine hearts, for example, has allowed characterization of the developing and adult rodent heart, making it an essential tool for the study of developmental biology and cardiovascular disease. Nevertheless, additional imaging tools may prove useful adjuncts and/or alternatives to such established traditional modalities.
Ideally, a cardiovascular imaging modality should provide structural–functional quantitation and be noninvasive, fast, cost effective, precise, and accurate. Although the combination of echocardiography and small-animal cardiac magnetic resonance has been proven to meet several of these criteria, there is certainly room for other modalities to be used as well. At our institution, experimentation with a micro–computed tomography (CT) scanner eventually produced contrast-enhanced, high-resolution 3-dimensional imaging of the murine heart and associated structures. Indeed, early success with CT imaging of murine hearts has also been described in limited detail by other investigators (1,2), but, to our knowledge, a validation of this technique by direct comparison with multiple established methodologies has not been described. Hence, we present the first study aimed to directly compare this novel imaging modality with both conventional echocardiography and conductance catheter (CC) measurement techniques using an established murine model of ischemic heart disease. Spe-cifically, we have tested the hypothesis that micro-CT can provide reliable information about ventricular structure and function after surgical left anterior descending artery (LAD) ligation–induced myocardial infarction (MI) in mice.
We randomized adult (8 to 10 weeks old) female FVB mice (n = 19) to surgical LAD ligation or sham procedure. Dual cardiac and respiratory–gated, intravenous contrast–enhanced (20 μl/g Fenestra VC, ART Inc., Montreal, Canada) CT scans were performed pre-operatively and at 4, 8, and 12 weeks post-procedure using the eXplore Locus RS150 MicroCT (GE Healthcare, Fairfield, Connecticut). Scans were performed with a 70-kVp, 40-mAmp X-ray source, acquiring 286 views over 200°, averaging 2 frames per view, 4 × 4 binning on the charge-coupled device detector. The heart was centered in a 46.25-mm axial field of view (84.7 mm transaxial field of view), and subregions of the scanned data were reconstructed at an isotropic resolution of 97.3 μm. End-diastolic and end-systolic images were prospectively acquired with a temporal resolution of 15 ms by gating on electrocardiographic P- and S′-waves, respectively (see Online Figs. 1A and 1B for animal setup and gating reference). Continual imaging of the cardiac cycle (at 10- to 15-ms intervals) was also conducted for a representative animal at each time point (Online Fig. 2 shows continuous imaging of a control animal). Post-acquisition analysis was performed using GE image analysis software (Online Figs. 1C to 1F). All operators obtaining and analyzing the CT scans were able to obtain measurements with minimal variability (±0.5% to 4.0%, data not shown). Echocardiography was performed by obtaining 3 independent 2-dimensional transversal-targeted M-mode traces at the level of the papillary muscles using a 14.7-MHz transducer on a Sequoia C512 echocardiography system (Siemens, Malvern, Pennsylvania). Using the Siemens proprietary software, left ventricular end-diastolic and end-systolic posterior and anterior dimensions were measured and processed to calculate left ventricular fractional shortening. Invasive, steady-state hemodynamic measurements were conducted by closed-chest pressure–volume loop analysis using a 1.4-F conductance catheter (Millar Instruments, Houston, Texas) at week 12. These data were analyzed using PVAN 3.4 software (Millar Instruments) and Chart/Scope software (AD Instruments, Colorado Springs, Colorado).
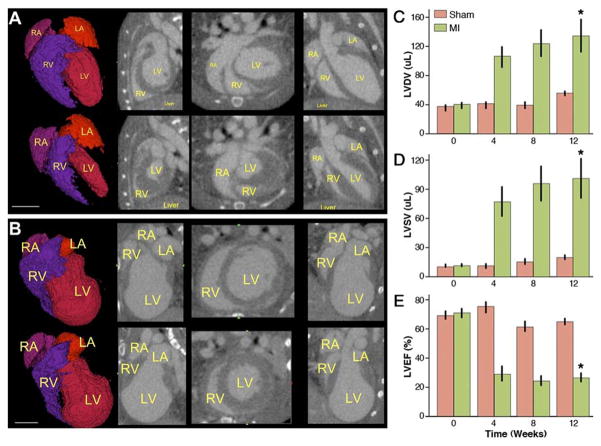
Mean left ventricular diastolic and systolic volumes were not significantly different between the sham and MI groups at baseline (37.2 ± 2.0 μl vs. 39.7 ± 1.8 μl in diastole and 11.2 ± 0.6 μl vs. 11.4 ± 0.8 μl in systole, respectively, p = NS). However, these volumes gradually increased in the MI group, finally reaching a mean diastolic value of 133.2 ± 21.2 μl, compared with 55.4 ± 1.0 μl in the sham-operated group at 12 weeks post-operation (p = 0.002) (Figs. 1A to 1C). Similarly, left systolic volumes increased to 100.1 ± 19.6 μl as compared with 19.9 ± 1.2 μl in the sham group (p = 0.002) (Fig. 1D). This MI-induced increase in volumes mirrored functional failure, with deteriorating left ventricular ejection fraction from an initial 70.6 ± 2.5% to 26.2 ± 2.8% after 12 weeks. By contrast, left ventricular ejection fraction in the sham group remained around baseline (68.6 ± 2.6%, p < 0.0005) (Fig. 1E).
Figure 1. Gated Micro-CT Provides Insight Into MI–Induced Cardiac Remodeling.
(A) End-diastolic (top row) and end-systolic (bottom row) images of a normal mouse heart with chambers labeled in yellow. From left to right: rendered surface of blood volume, sagittal, axial, and coronal views. (B) Similar series of images from the same animal 12 weeks after left anterior descending artery (LAD) ligation (scale bar = 5 mm in both panels), showing clear signs of negative remodeling. (C) Graphic representation of increasing left ventricular (LV) diastolic volume (LVDV) over time after myocardial infarction (MI) as compared with relatively stable volumes in the sham-operated group. (D) Similarly, left ventricular systolic volume (LVSV) increased due to loss of cardiac muscle after infarction. (E) MI led to dilated cardiomyopathy with a significant loss of left ventricular ejection fraction (LVEF) as early as 1 month after LAD ligation (bars represent mean ± SE. *p < 0.05 compared with sham group by repeated-measures of analysis of variance). CT = computed tomography; LA = left atrium; MI = myocardial infarction; RA = right artrium; RV = right ventricle.
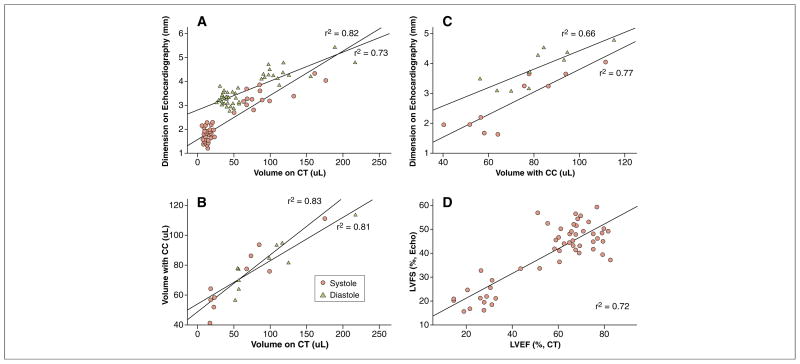
As shown in Figure 2, volumes measured by micro-CT correlated well with dimensions acquired from echocardiography in both diastole (r2 = 0.73) and systole (r2 = 0.82). Similarly, volumes derived from the CC-based approach showed a correlative trend with those from the micro-CT (r2 = 0.83 in systole and r2 = 0.81 in diastole). When volumes and dimensions were processed to calculate functional measurements of ventricular contraction, micro-CT proved to correlate well with echocardiography (r2 = 0.72) (Fig. 2D). These observations suggest that micro-CT imaging can provide reliable volumetric assessment of cardiac chambers and ventricular function. For detailed echocardiography, CC, histological results, and representative images, please refer to Online Figures 3 to 5.
Figure 2. Micro-CT Findings Correlate Robustly With Established Methods of Measuring Murine Cardiac Function.
(A and B) Volumes derived from micro-CT image analysis correlate well with dimensions measured using echocardiography and volumes assessed with the conductance catheter (CC) in both systole and diastole. (C) Echocardiography measurements of chamber length correlated well with volumes derived from CC measurements. (D) In vivo functional measurements from micro-CT and echocardiography correlated well with a r2 value of 0.72. LVFS = left ventricular fractional shortening; other abbreviations as in Figure 1.
Over the past decade, cardiac CT has become an important clinical imaging modality for the characterization of cardiac structure and function, as well as coronary artery pathology (3,4). However, cardiac CT imaging has long been inapplicable to pre-clinical small-animal models due to the high spatial and temporal resolution required to visualize mouse hearts with rates of over 400 beats/min. Recent advances in technology have allowed adaptation of CT imaging to the small-animal laboratory, adding a valuable asset to the pre-clinical research tool chest. As shown in the present study, micro-CT can provide accurate and precise measurements of the murine heart, and can serve as a useful adjunct to established measurements of cardiac function. Further refinements of this emerging technology are ongoing, and we predict that micro-CT scanning will continue to be used in the small-animal laboratory with increasing frequency.
Supplementary Material
Acknowledgments
This study was funded by National Institutes of Health grants F32-HL-084982 (Dr. Sheikh), HL099117 (Dr. Wu), HL089027 (Dr. Wu), HL095571 (Dr. Wu), and HL093172 (Dr. Wu).
Footnotes
APPENDIX
For supplementary figures and their legends, please see the online version of this article.
References
- 1.Nahrendorf M, Badea C, Hedlund LW, et al. High-resolution imaging of murine myocardial infarction with delayed-enhancement cine micro-CT. Am J Physiol Heart Circ Physiol. 2007;292:H3172–8. doi: 10.1152/ajpheart.01307.2006. [DOI] [PMC free article] [PubMed] [Google Scholar]
- 2.Detombe SA, Ford NL, Xiang F, Lu X, Feng Q, Drangova M. Longitudinal follow-up of cardiac structure and functional changes in an infarct mouse model using retrospectively gated micro-computed tomography. Invest Radiol. 2008;43:520–9. doi: 10.1097/RLI.0b013e3181727519. [DOI] [PubMed] [Google Scholar]
- 3.Pouleur AC, le Polain de Waroux JB, Kefer J, Pasquet A, Vanoverschelde JL, Gerber BL. Direct comparison of whole-heart navigator-gated magnetic resonance coronary angiography and 40- and 64-slice multidetector row computed tomography to detect the coronary artery stenosis in patients scheduled for conventional coronary angiography. Circ Cardiovasc Imaging. 2008;1:114–21. doi: 10.1161/CIRCIMAGING.107.756304. [DOI] [PubMed] [Google Scholar]
- 4.Ruzsics B, Lee H, Powers ER, Flohr TG, Costello P, Schoepf UJ. Images in cardiovascular medicine. Myocardial ischemia diagnosed by dual-energy computed tomography: correlation with single-photon emission computed tomography. Circulation. 2008;117:1244–5. doi: 10.1161/CIRCULATIONAHA.107.745711. [DOI] [PubMed] [Google Scholar]
Associated Data
This section collects any data citations, data availability statements, or supplementary materials included in this article.


