

Abstract
An improved ultra performance liquid chromatography-tandem mass spectrometry (UPLC/MS/MS) method was established for the simultaneous analysis of various bile acids (BA) and applied to investigate liver BA content in C57BL/6 mice fed 1% cholic acid (CA), 0.3% deoxycholic acid (DCA), 0.3% chenodeoxycholic acid (CDCA), 0.3% lithocholic acid (LCA), 3% ursodeoxycholic acid (UDCA), or 2% cholestyramine (resin). Results indicate that mice have a remarkable ability to maintain liver BA concentrations. The BA profiles in mouse livers were similar between CA and DCA feedings, as well as between CDCA and LCA feedings. The mRNA expression of Cytochrome P450 7a1 (Cyp7a1) was suppressed by all BA feedings, whereas Cyp7b1 was suppressed only by CA and UDCA feedings. Gender differences in liver BA composition were observed after feeding CA, DCA, CDCA, and LCA, but they were not prominent after feeding UDCA. Sulfation of CA and CDCA was found at the 7-OH position, and it was increased by feeding CA or CDCA more in male than female mice. In contrast, sulfation of LCA and taurolithocholic acid (TLCA) was female-predominant, and it was increased by feeding UDCA and LCA. In summary, the present systematic study on BA metabolism in mice will aid in interpreting BA-mediated gene regulation and hepatotoxicity.
Keywords: gender difference, ultra performance liquid chromatography-tandem mass spectrometry, bile acid-synthetic enzymes
Bile acids (BA) are synthesized from cholesterol in livers via two major pathways, namely, the classic and alternative pathways (1). BA structures are shown in Fig. 1. Cyp7a1 is the rate-limiting enzyme in the classic pathway, which results in the formation of cholic acid (CA) and chenodeoxycholic acid (CDCA). The alternative pathway is initiated by mitochondrial Cyp27a1 and followed by Cyp7b1 to produce chenodeoxycholic acid (CDCA). Both CA and CDCA are primary BAs in humans and rodents. Rodent livers can hydroxylate CDCA at the 6β-position to form α-muricholic acid (αMCA), which can be further converted to βMCA by epimerization of its 7α-OH to 7β-OH (2). Therefore, α- and β-MCA are also primary BAs in rodents.
Fig. 1.

Chemical structure of bile acids.
BAs are subject to multiple biotransformations during their enterohepatic circulation (3). In liver, BAs undergo conjugation with taurine, glycine, and glucuronic acid on the side chain and conjugation with sulfate, glucuronic acid, and N-acetylglucosamine on the hydroxyl groups of the steroid nucleus (4, 5). In the intestine, bacterial enzymes are capable of deconjugation, dehydroxylation at C-7, epimerization, and oxidation of BAs. Gender differences in BA metabolism have been reported in several species. For example, male rat livers have a relatively higher capacity to convert CDCA to βMCA (6). In contrast, isolated perfused livers of female rats convert more DCA to taurocholic acid (TCA) than male rats (7). Compared with male mice, female mice have a much higher capacity to sulfate lithocholic acid (LCA) in their livers (8).
Recently, various BA-supplemented diets have been fed to rodents to investigate hepatic gene regulation, BA hepatotoxicity, and the potential therapeutic use of BAs (9–12). Individual BAs vary markedly in their pathological and physiological responses in vivo. Therefore, it is important to know the effect of feeding BAs on individual BA composition and concentrations. This lab has developed a liquid chromatography-tandem mass spectrometry (LC-MS/MS) method to quantify the major BAs in mice (13). In the present study, the LC-MS/MS method was improved so that it can simultaneously quantify various hydroxy-oxo-BAs. This method was applied to quantify individual BA concentrations in livers of male and female C57BL/6 mice subjected to a diet containing either a primary BA (CA or CDCA), a secondary BA (DCA or LCA), a therapeutic BA (UDCA), or a BA binding resin (cholestyramine). The purpose of this study is to investigate BA metabolism and synthesis, along with potential gender differences in mice fed various BA-supplemented diets.
EXPERIMENTAL PROCEDURE
Chemicals and reagents
In the present study, the BAs were named according to previous literature (4, 14). Tauromurideoxycholic acid (TMDCA) and 7α-dihydroxy-3-oxo-5β–cholan-24-oic acid (3-dehydroCDCA) were kind gifts from Dr. Alan F. Hofmann (University of California, San Diego). Glycochenodeoxycholic-2,2,4,4-d4 acid (2H4-GCDCA) and chenodeoxycholic-2,2,4,4-d4 acid (2H4-CDCA) were purchased from C/D/N Isotopes, Inc. (Pointe-Claire, Quebec, Canada). Lithocholic acid (LCA), sodium taurolithocholate, lithocholic acid sulfate (LCAS) disodium salt hydrate, taurolithocholic acid sulfate (TLCAS) disodium salt, cholic acid (CA), glycocholic acid (GCA), deoxycholic acid (DCA), sodium glycodeoxycholate, sodium taurodeoxycholate hydrate, ursodeoxycholic acid (UDCA), sodium tauroursodeoxycholate, chenodeoxycholic acid (CDCA), sodium glycochenodeoxycholate, sodium taurochenodeoxycholate and cholestyramine (resin) were purchased from Sigma-Aldrich (St. Louis, MO). Glycoursodeoxycholic acid (GUDCA), glycolithocholic acid (GLCA), hyodeoxycholic acid (HDCA), glycohyodeoxycholic acid (GHDCA), taurohyodeoxycholic acid (THDCA), taurocholic acid (TCA), 3α,12α-dihydroxy-7-oxo-5β–cholan-24-oic acid (7-oxoDCA), 3-oxo-5β–cholan-24-oic acid (dehydroLCA), α-muricholic acid (αMCA), tauro-α-muricholic acid (TαMCA), β-muricholic acid (βMCA), tauro-β-muricholic acid (TβMCA), hyocholic (HCA), tauro-hyocholic acid (THCA), murideoxycholic acid (MDCA), 3β,12α-dihydroxy-5β–cholan-24-oic acid (isoDCA), 7α,12α-dihydroxy-5β–cholan-24-oic acid (3-DCA), 3β-hydroxy-5β–cholan-24-oic acid (isoLCA), 3α-hydroxy-5α–cholan-24-oic acid (alloLCA), 3α-hydroxy-6-oxo-5α–cholan-24-oic acid (6-oxo-alloLCA), 3α-hydroxy-6-oxo-5β–cholan-24-oic acid (6-oxoLCA), 3α-hydroxy-7-oxo-5β–cholan-24-oic acid (7-oxoLCA), 3α-hydroxy-12-oxo-5β–cholan-24-oic acid (12-oxoLCA), 7α,12α-dihydroxy-3-oxo-5β–cholan-24-oic acid (3-dehydroCA), and 3α,7α-dihydroxy-12-oxo-5β–cholan-24-oic acid (12-oxoCDCA) were purchased from Steraloids, Inc. (Newport, RI). CDCA-3-glucuronide and CDCA-24-glucuronide, CA-24-glucuronide, LCA-3-glucuronide, LCA-24-glucuronide, DCA-3-glucuronide, HDCA-6-glucuronide, and HDCA-24-glucuronide were kindly provided by Dr. Oliver Barbier (Laval University, Québec, Canada). All other chemicals, unless indicated, were purchased from Sigma-Aldrich (St. Louis, MO). Tauro-ω-muricholic acid (TωMCA), cholic acid 3-sulfate (CA3S), cholic acid 7-sulfate (CA7S), cholic acid 12-sulfate (CA12S), taurocholic acid 3-sulfate (TCA3S), chenodeoxycholic acid 3-sulfate (CDCA3S), tauro- or glyco-chenodeoxycholic acid 3-sulfate (TCDCA3S, GCDCA3S), deoxycholic acid 3-sulfate (DCA3S), tauro- or glyco-deoxycholic acid 3-sulfate (TDCA3S, GDCA3S), and glycolithocholic acid sulfate (GLCAS) were synthesized according to previous methods with small modifications (supplementary information).
Liver BA extraction
2H4-GCDCA (40 µg/ml) and 2H4-CDCA (20 µg/ml) were used as internal standards (IS). Approximately 120 mg of liver was homogenized in 5 vol of H2O. An amount of 600 µl of liver homogenate was spiked with 10 µl of ISs, mixed, and equilibrated on ice for 10 min. An amount of 3 ml of ice-cold alkaline acetonitrile (5% ammonia in acetonitrile) was added to the homogenate, which was then vortexed vigorously and shaken continuously for 1 h at room temperature. The mixture was centrifuged at 12,000 g for 10 min, and the supernatant was collected. The pellet was resuspended in 1 ml of methanol, sonicated for 5 min, and centrifuged at 12,000 g for 10 min. The two supernatants obtained were combined, evaporated under vacuum, and reconstituted in 100 µl of 50% methanol. The suspension was transferred into a 0.2 µm Costar Spin-X HPLC microcentrifuge filter (purchased from Corning Inc., Corning, NY), and centrifuged at 20,000 g for 10 min. The supernatant was then ready for injection.
BA quantification
Liquid chromatographic and mass spectrometric conditions are described in the supplementary information (supplementary Table I and Fig. I). For preparation of standard stock solutions, 10 mg/ml BAs and ISs were dissolved in methanol. Because BA sulfates were synthesized without further purification, their stock solutions were prepared separately. IS stock solution was diluted with 50% MeOH to a final concentration of 40 µg/ml for 2H4-GCDCA and 20 µg/ml for 2H4-CDCA. BA stock solutions were diluted with 50% MeOH and spiked with 10 µl of ISs to construct standard curves between 5 and 50,000 ng/ml. The final concentration of 2H4-G-CDCA and 2H4-CDCA was 4 and 2 µg/ml, respectively. The assignment of target BAs in the UPLC profile was conducted by comparing their retention behavior and molecular mass spectra with the available BA reference standards. Quantification was performed via peak area ratios (analyte versus IS) by linear-weighted (1/x2) least-squares calibration curves within a range of working standard concentrations. As insufficient TωMCA and ωMCA were available, they were quantified relatively by referring to TαMCA and αMCA, respectively.
Animals and treatments
Eight-week-old adult male and female C57BL/6 mice were purchased from Charles River Laboratories (Wilmington, MA). All mice were fed Teklad Rodent Diet #8604 (Harlan Laboratories, Madison, WI) ad libitum and housed according to American Animal Association laboratory animal care guidance. The control diet was prepared by grinding Harlan Teklad Rodent Diet #8064 (Harlan Laboratories). To prepare BA-supplemented diets, BAs were first ground with a small amount of control diet using a mortar and pestle, and then mixed with a large amount of control diet in a Hobart food mixer (Hobart Corporation, Troy, OH). Cholestyramine-supplemented diet (2% resin by weight of diet) was prepared using the same method as BA-supplemented diets. During a preliminary study, mice were fed diets supplemented with different concentrations (0.01%, 0.1%, 0.3%, and 3% by weight of diet) of individual BAs. Concentrations that were nonlethal were selected for the present study. Individually housed C57BL/6 mice (n = 5/gender/group) were fed a control diet or a diet supplemented with 1% CA, 0.3% DCA, 0.3% CDCA, 0.3% LCA, 3% UDCA, or 2% resin for seven days. Mice were anesthetized between 8:00 AM and 12:00 AM on day 7, and gallbladders were carefully removed. Livers were then harvested, washed, frozen in liquid nitrogen, and stored at −80°C until analysis.
Total RNA isolation
Total RNA was isolated using RNA-Bee reagent (Tel-Test Inc., Friendswood, TX) according to the manufacturer's protocol. Total RNA concentrations were quantified spectrophotometrically at 260 nm. One microgram per microliter solutions were prepared from the stock RNA solutions by dilution in diethyl pyrocarbonate-treated deionized water. Integrity of RNA samples was determined by formaldehyde-agarose gel electrophoresis with visualization by ethidium bromide fluorescence under UV light.
Multiplex suspension array
Liver mRNA was quantified by multiplex suspension array (Panomics-Affymetrix, Inc., Fremont, CA). Individual gene accession numbers can be accessed at www.panomics.com. Glyceraldehyde-3-phosphate dehydrogenase (Gapdh) was used as the loading control. The detailed method was described previously (15). The mRNA data are presented as relative light units (RLU) normalized to Gapdh mRNA.
Statistical analysis
Bars represent Mean ± SEM (n = 5). Differences between mean values were tested for statistical significance (P < 0.05) by the two-tailed Student's t-test.
RESULTS
Extraction of BAs from mouse livers
During preliminary experiments, different BA extraction methods were compared. In previous BA analyses, livers were either homogenized in 50% methanol (13) or ground as frozen tissue (14). In the present study, livers were homogenized in five vol of water to obtain a homogenate that was easily transferred with a pipette. To optimize BA extraction, liver homogenates were divided into small portions, each of which was spiked with or without a mixture of ISs and BA standards. BAs were then extracted with various solvents (ethanol, methanol, and acetonitrile) at various temperatures (25°C, 37°C, 60°C, and 100°C) and pHs (7, 9, 11, and 12). The extraction recoveries were determined by the ratio of the peak area of recovered BAs compared with the corresponding peak area of BA standards in neat solution (50% methanol). Finally, a two-step extraction using a combination of alkaline acetonitrile and methanol was found to be sufficient for maximum recovery of the BAs. BA standards (unconjugated BAs, oxo-BAs, taurine-, glycine-, and sulfate-conjugated BAs) were stable during this extraction procedure. The recovery ratios of the exogenous standards calculated from each raw peak area were from 75% to 90%. The recovery ratios of two ISs were from 75% to 85%. The recovery extent of BA standards and the ISs was consistent and reproducible.
Validation of BA quantification
To optimize the chromatographic conditions, we compared the method used by Alnouti et al. (13) with that by Hagio et al. (14). The Hagio method resulted in a better separation between ω-, α-, and β-MCA, whereas the signal intensity was only about 50% of the Alnouti method. Compared with the Alnouti method, more peaks were found in the chromatograph window for CDCA using the Hagio method (data not shown). Therefore, chromatographic conditions similar to Hagio's (14) were used in the present study to separate all BA standards in less than 28 min. The intraday and interday accuracy and precision were determined according to a previous method (13); their relative standard deviations were below 15% for all BA standards (data not shown). All standard curves were constructed using a 1/concentration2 weighted quadratic regression, and the correlation coefficient (r2) for all BAs was above 0.99. The limit of detection (signal/noise ratio = 3) for the various BAs was in the range of 5–10 ng/ml.
Concentrations of BAs in livers of mice fed BAs
Using this method, 36 BAs were quantified in the livers of mice fed various BAs or BA sequestrants (Table 1 and supplementary figures). To simplify, we only list BA changes in livers of male mice after BA feedings. The predominant BAs in control mouse liver were TCA (86.1 ± 18.5 nmol/g) and CA (4.7 ± 0.9), TβMCA (34.2 ± 8.8) and βMCA (35.1 ± 5.0), and TωMCA (18.1 ± 4.5) and ωMCA (11.8 ± 2.1). The major oxo-BAs in control mouse liver were 7-oxoDCA (5.1 ± 1.0) and 12-oxoCDCA (12.1 ± 1.8). In livers of mice fed CA, DCA, CDCA, LCA, or UDCA, the taurine conjugates of the fed BAs became the predominant BAs. This indicates that the fed BAs were absorbed from the intestine and delivered in portal blood to the liver, where a majority of the BAs were conjugated with taurine. Various BA biotransformations occurred subsequent to BA feeding. For example, during CA feeding, TCA (86.1→298.5 nmol/g) and TDCA (7.7→38.4) became the major constituents of hepatic BAs, followed by increased DCA (0.4→5.2), GCA (0.1→0.5), GDCA (0.0→0.1), isoDCA (0.0→0.3), and 12-oxoLCA (0.3→1.2). Mice fed DCA displayed a marked increase in TDCA (7.7→57.2), GDCA (0.0→0.2), isoDCA (0.0→0.5), and 12-oxoLCA (0.3→1.0), with a tendency to increase TCA, GCA, and CA. However, both CA and DCA feeding significantly decreased most of other conjugated (TαMCA, TβMCA, TωMCA, THCA, TMDCA, TUDCA, THDCA, TCDCA, and TLCA) and unconjugated BAs (αMCA, βMCA, ωMCA, MDCA, UDCA, HDCA, CDCA, LCA, 7-oxoDCA, 12-oxoCDCA, 6-oxoLCA, and 7-oxoLCA) (supplementary Figs. VI, VII).
TABLE 1.
BA concentrations in livers of mice fed various BA-supplemented diets
| BA (nmol/g liver) | Control |
1% CA |
0.3% DCA |
0.3% CDCA |
0.3% LCA |
3% UDCA |
2% Resin |
|||||||
|---|---|---|---|---|---|---|---|---|---|---|---|---|---|---|
| M | F | M | F | M | F | M | F | M | F | M | F | M | F | |
| TαMCA | 6.9 ± 1.6 | 6.4 ± 1.0 | 2.0 ± 0.3a | 2.1 ± 0.5a | 2.8 ± 0.4a | 2.0 ± 0.3a | 31.8 ± 6.1a | 31.9 ± 4.5a | 20.0 ± 3.2a | 18.4 ± 3.2a | 2.5 ± 0.5a | 1.7 ± 0.3a | 2.4 ± 0.2a | 5.3 ± 1.0b |
| αMCA | 5.8 ± 0.8 | 3.0 ± 0.6b | 0.9 ± 0.1a | 0.3 ± 0.1ab | 0.5 ± 0.1a | 0.4 ± 0.0a | 30.5 ± 6.7a | 18.7 ± 2.4a | 7.6 ± 1.4 | 4.8 ± 0.8 | 16.6 ± 4.1 | 9.6 ± 2.6a | 2.1 ± 0.2a | 2.0 ± 0.2 |
| TβMCA | 34.2 ± 8.8 | 32.8 ± 7.3 | 2.7 ± 0.5a | 2.7 ± 0.3ab | 4.2 ± 0.9a | 5.3 ± 0.7a | 12.2 ± 2.3a | 19.0 ± 3.2 | 21.1 ± 7.8 | 24.2 ± 5.5 | 6.1 ± 1.1a | 6.9 ± 1.3a | 1.2 ± 0.2a | 3.0 ± 0.7ab |
| βMCA | 35.1 ± 5.0 | 21.9 ± 3.9 | 2.3 ± 0.4a | 0.8 ± 0.3a | 2.3 ± 0.8a | 2.7 ± 0.2a | 12.9 ± 1.8a | 14.4 ± 1.8 | 7.7 ± 2.7a | 7.0 ± 2.1a | 68.3 ± 18.3 | 66.0 ± 16.0a | 1.5 ± 0.3a | 1.4 ± 0.2a |
| TωMCA | 18.1 ± 4.5 | 11.3 ± 2.0 | 0.5 ± 0.1a | 0.5 ± 0.0a | 1.2 ± 0.3a | 1.6 ± 0.4a | 3.1 ± 0.3a | 3.6 ± 0.4a | 6.9 ± 2.9 | 8.8 ± 1.8 | 0.5 ± 0.1a | 0.5 ± 0.2a | 0.3 ± 0.1a | 0.6 ± 0.0ab |
| ωMCA | 11.8 ± 2.1 | 4.9 ± 0.8b | 0.4 ± 0.1a | 0.1 ± 0.0ab | 0.5 ± 0.1a | 0.5 ± 0.1a | 2.4 ± 0.4a | 1.7 ± 0.1a | 2.0 ± 0.9a | 1.8 ± 0.6a | 121.4 ± 39.7 | 95.6 ± 25.7a | 0.2 ± 0.0a | 0.2 ± 0.0a |
| THCA | 0.3 ± 0.1 | 0.3 ± 0.1 | 0.1 ± 0.0a | 0.1 ± 0.0a | 0.0 ± 0.0a | 0.1 ± 0.0a | 2.3 ± 0.1a | 1.9 ± 0.3a | 0.8 ± 0.2a | 1.0 ± 0.4a | 0.1 ± 0.0a | 0.0 ± 0.0a | 0.0 ± 0.0a | 0.1 ± 0.0ab |
| HCA | 0.1 ± 0.1 | 0.0 ± 0.0 | 0.1 ± 0.0 | 0.0 ± 0.0 | 0.0 ± 0.0 | 0.0 ± 0.0 | 1.0 ± 0.2 | 0.3 ± 0.1 | 0.0 ± 0.0 | 0.1 ± 0.1 | 0.4 ± 0.1 | 0.2 ± 0.0 | 0.0 ± 0.0 | 0.0 ± 0.0 |
| TCA | 86.1 ± 18.5 | 67.1 ± 11.5 | 298.5 ± 43.6a | 219.3 ± 32.3a | 122.5 ± 17.0 | 112.0 ± 21.8 | 6.0 ± 1.0a | 6.8 ± 0.8a | 29.1 ± 8.9a | 46.8 ± 10.1 | 1.8 ± 0.5a | 1.5 ± 0.4a | 49.4 ± 2.4 | 41.2 ± 4.6 |
| GCA | 0.1 ± 0.0 | 0.1 ± 0.1 | 0.5 ± 0.0a | 0.4 ± 0.1a | 0.2 ± 0.0 | 0.1 ± 0.0b | 0.0 ± 0.0a | 0.0 ± 0.0a | 0.0 ± 0.0 | 0.1 ± 0.0 | 0.0 ± 0.0a | 0.0 ± 0.0a | 0.1 ± 0.0 | 0.1 ± 0.0 |
| CA | 4.7 ± 0.9 | 2.7 ± 0.6 | 18.8 ± 1.3a | 3.6 ± 0.7b | 6.1 ± 1.0 | 3.8 ± 0.4 | 0.3 ± 0.1a | 0.2 ± 0.0a | 0.8 ± 0.3a | 0.7 ± 0.2a | 0.9 ± 0.3a | 0.7 ± 0.1a | 3.1 ± 0.6 | 1.2 ± 0.2ab |
| TDCA | 7.7 ± 1.6 | 7.0 ± 1.3 | 38.4 ± 3.3a | 36.7 ± 5.0a | 57.2 ± 7.9a | 31.8 ± 4.7ab | 2.1 ± 0.2a | 1.8 ± 0.1a | 7.6 ± 1.3 | 11.3 ± 4.2 | 0.9 ± 0.3a | 0.8 ± 0.3a | 7.3 ± 1.2 | 7.3 ± 0.4 |
| GDCA | 0.0 ± 0.0 | 0.0 ± 0.0 | 0.1 ± 0.0a | 0.1 ± 0.0a | 0.2 ± 0.0a | 0.1 ± 0.0ab | 0.0 ± 0.0 | 0.0 ± 0.0 | 0.0 ± 0.0a | 0.1 ± 0.1 | 0.0 ± 0.0 | 0.0 ± 0.0 | 0.0 ± 0.0 | 0.0 ± 0.0 |
| DCA | 0.4 ± 0.1 | 0.4 ± 0.1 | 5.2 ± 0.4a | 1.8 ± 0.4ab | 5.1 ± 1.5a | 1.3 ± 0.1ab | 0.2 ± 0.0 | 0.1 ± 0.0ab | 0.3 ± 0.0 | 0.3 ± 0.0 | 0.8 ± 0.2 | 0.6 ± 0.1 | 0.4 ± 0.1 | 0.3 ± 0.0 |
| isoDCA | 0.0 ± 0.0 | 0.0 ± 0.0 | 0.3 ± 0.0a | 0.2 ± 0.1ab | 0.5 ± 0.2a | 0.1 ± 0.0ab | 0.0 ± 0.0 | 0.0 ± 0.0 | 0.0 ± 0.0 | 0.0 ± 0.0 | 0.0 ± 0.0 | 0.4 ± 0.0 | 0.0 ± 0.0 | 0.0 ± 0.0 |
| 7-oxoDCA | 5.1 ± 1.0 | 1.7 ± 0.5b | 1.2 ± 0.3a | 0.1 ± 0.0ab | 1.0 ± 0.2a | 0.4 ± 0.0ab | 9.3 ± 1.6a | 3.7 ± 0.7ab | 1.8 ± 0.5a | 0.6 ± 0.1ab | 0.4 ± 0.1a | 0.1 ± 0.0a | 1.2 ± 0.4a | 0.4 ± 0.1ab |
| TCDCA | 3.0 ± 0.4 | 3.2 ± 0.3 | 1.6 ± 0.2a | 1.4 ± 0.2a | 1.4 ± 0.1a | 1.3 ± 0.2a | 43.1 ± 8.8a | 33.9 ± 6.8a | 22.7 ± 5.1a | 15.9 ± 3.8a | 7.9 ± 1.8a | 6.7 ± 1.4a | 4.0 ± 0.3 | 8.1 ± 1.3ab |
| GCDCA | 0.0 ± 0.0 | 0.0 ± 0.0 | 0.0 ± 0.0 | 0.0 ± 0.0 | 0.0 ± 0.0 | 0.0 ± 0.0 | 0.2 ± 0.0a | 0.1 ± 0.1a | 0.0 ± 0.0 | 0.1 ± 0.1 | 0.3 ± 0.1a | 0.2 ± 0.0a | 0.0 ± 0.0 | 0.0 ± 0.0 |
| CDCA | 1.6 ± 0.1 | 0.9 ± 0.1 | 0.5 ± 0.1a | 0.2 ± 0.0ab | 0.2 ± 0.0a | 0.2 ± 0.0a | 36.0 ± 10.1a | 14.1 ± 3.3ab | 6.6 ± 2.0a | 6.7 ± 4.2a | 19.6 ± 7.6a | 13.2 ± 2.3a | 2.0 ± 0.2 | 2.1 ± 0.3a |
| 12-oxoCDCA | 12.1 ± 1.8 | 7.4 ± 1.9 | 1.0 ± 0.3a | 0.3 ± 0.1ab | 1.1 ± 0.4a | 0.7 ± 0.1ab | 6.4 ± 1.4a | 3.2 ± 0.5ab | 3.7 ± 1.0a | 2.8 ± 0.5a | 4.8 ± 1.2 | 3.1 ± 1.3 | 0.5 ± 0.2a | 0.3 ± 0.0a |
| TUDCA | 3.0 ± 0.5 | 3.3 ± 0.6 | 0.9 ± 0.1a | 0.8 ± 0.2a | 0.6 ± 0.1a | 0.9 ± 0.1ab | 12.4 ± 1.6a | 13.0 ± 2.2a | 5.6 ± 0.8a | 5.1 ± 0.8 | 202.9 ± 21.4a | 223.3 ± 32.7a | 0.4 ± 0.1a | 0.8 ± 0.1ab |
| GUDCA | ND | ND | ND | ND | ND | ND | ND | ND | ND | ND | 16.5 ± 3.3a | 22.2 ± 3.7a | ND | ND |
| UDCA | 0.9 ± 0.1 | 0.8 ± 0.2 | 0.3 ± 0.1a | 0.1 ± 0.0ab | 0.1 ± 0.0a | 0.5 ± 0.3b | 6.7 ± 1.3a | 4.8 ± 0.8a | 0.9 ± 0.2 | 1.2 ± 0.3 | 875.4 ± 198.0a | 1038 ± 197.3a | 0.2 ± 0.0a | 0.4 ± 0.3 |
| TMDCA | 1.2 ± 0.4 | 1.4 ± 0.4 | 0.2 ± 0.0a | 0.5 ± 0.2b | 0.6 ± 0.1 | 0.4 ± 0.1a | 4.1 ± 0.6a | 5.0 ± 0.9a | 38.8 ± 10.7a | 17.1 ± 4.5a | 7.0 ± 2.2a | 6.9 ± 2.6a | 0.3 ± 0.1 | 1.2 ± 0.2b |
| MDCA | 1.1 ± 0.2 | 0.8 ± 0.2 | 0.2 ± 0.0a | 0.1 ± 0.0ab | 0.3 ± 0.0a | 0.2 ± 0.0a | 4.2 ± 0.5a | 3.3 ± 0.5a | 22.5 ± 5.3a | 13.4 ± 5.4a | 32.5 ± 9.9a | 23.5 ± 7.1a | 0.6 ± 0.1 | 0.8 ± 0.1 |
| THDCA | 1.7 ± 0.5 | 1.4 ± 0.3 | 0.1 ± 0.0a | 0.2 ± 0.0a | 0.6 ± 0.2 | 0.4 ± 0.1a | 2.3 ± 0.4 | 2.2 ± 0.4 | 10.6 ± 2.5a | 7.0 ± 1.9a | 0.1 ± 0.0a | 0.3 ± 0.1ab | ||
| HDCA | 1.1 ± 0.3 | 0.5 ± 0.2 | 0.1 ± 0.0a | 0.0 ± 0.0ab | 0.2 ± 0.0a | 0.1 ± 0.0a | 1.8 ± 0.2 | 1.1 ± 0.2a | 6.0 ± 2.1a | 4.2 ± 1.7a | 2.6 ± 1.1 | 2.1 ± 1.7 | 0.1 ± 0.0a | 0.1 ± 0.0ab |
| TLCA | 0.6 ± 0.1 | 0.4 ± 0.0 | 0.2 ± 0.0a | 0.2 ± 0.0a | 0.3 ± 0.0a | 0.3 ± 0.0a | 6.2 ± 0.7a | 4.5 ± 0.6a | 25.0 ± 6.2a | 9.6 ± 2.3a | 11.1 ± 3.8a | 16.5 ± 10.4a | 0.9 ± 0.1 | 2.6 ± 0.3ab |
| GLCA | ND | ND | ND | ND | ND | ND | ND | ND | ND | ND | 0.6 ± 0.3a | 0.4 ± 0.1a | ND | ND |
| LCA | 0.1 ± 0.0 | 0.0 ± 0.0 | 0.1 ± 0.0a | 0.0 ± 0.0 | 0.0 ± 0.0a | 0.0 ± 0.0 | 1.1 ± 0.2a | 0.4 ± 0.0ab | 3.1 ± 0.9a | 2.6 ± 1.8a | 47.5 ± 18.0a | 43.5 ± 17.8a | 0.1 ± 0.0 | 0.2 ± 0.0ab |
| 6-oxoLCA | 0.1 ± 0.0 | 0.0 ± 0.0 | 0.0 ± 0.0a | 0.0 ± 0.0 | 0.0 ± 0.0a | 0.0 ± 0.0 | 0.2 ± 0.0a | 0.1 ± 0.0ab | 0.7 ± 0.2a | 0.2 ± 0.1ab | 0.4 ± 0.1 | 0.1 ± 0.1 | 0.0 ± 0.0 | 0.0 ± 0.0 |
| 7-oxoLCA | 0.1 ± 0.0 | 0.0 ± 0.0b | 0.0 ± 0.0a | 0.0 ± 0.0 | 0.0 ± 0.0a | 0.0 ± 0.0 | 1.3 ± 0.4a | 0.2 ± 0.0ab | 0.2 ± 0.0a | 0.0 ± 0.0a | 2.4 ± 0.8a | 0.6 ± 0.1a | 0.1 ± 0.0 | 0.0 ± 0.0b |
| 12-oxoLCA | 0.3 ± 0.1 | 0.1 ± 0.1b | 1.2 ± 0.3a | 0.2 ± 0.1b | 1.0 ± 0.3a | 0.1 ± 0.0b | 0.1 ± 0.0a | 0.0 ± 0.0b | 0.2 ± 0.1 | 0.0 ± 0.0b | 0.0 ± 0.0a | 0.0 ± 0.0a | 0.2 ± 0.1 | 0.0 ± 0.0 |
| dehydroLCA | ND | ND | ND | ND | ND | ND | ND | ND | 0.1 ± 0.0a | 0.0 ± 0.0a | 1.3 ± 0.5a | 0.5 ± 0.2a | ND | ND |
| isoLCA | 0.0 ± 0.0 | 0.0 ± 0.0 | 0.0 ± 0.0 | 0.0 ± 0.0 | 0.0 ± 0.0 | 0.0 ± 0.0 | 0.1 ± 0.0a | 0.0 ± 0.0 | 0.2 ± 0.1a | 0.4 ± 0.4a | 2.5 ± 1.0a | 1.3 ± 0.8a | 0.0 ± 0.0 | 0.0 ± 0.0 |
Values are expressed as mean ± SEM for five mice in each group. BA, bile acid; BAG, bile acid glucuronide; CA, cholic acid; CDCA, chenodeoxycholic acid; DCA, deoxycholic acid; F, female; GCA, glycocholic acid; GCDCA, glycochenodeoxycholic acid; GDCA, glycodeoxycholic acid; GLCA, glycolithocholic acid; GUDCA, glycoursodeoxycholic acid; HCA, hyocholic acid; HDCA, hyodeoxycholic acid; isoLCA, iso-lithocholic acid; LCA, lithocholic acid; 7-oxoDCA, 3α,12α-dihydroxy-7-oxo-5β–cholan-24-oic acid; 6-oxoLCA, 3α-hydroxy-6-oxo-5β–cholan-24-oic acid; 7-oxoLCA, 3α-hydroxy-7-oxo-5β–cholan-24-oic acid; 12-oxoLCA, 3α-hydroxy-12-oxo-5β–cholan-24-oic acid; M, male; ωMCA, ω-muricholic acid; MDCA, murideoxycholic acid; ND, not detectable; TCA, taurocholic acid; TCDCA, taurochenodeoxycholic acid; THCA, taurohyocholic acid; TLCA, taurolithocholic acid; TαMCA, tauro-α-muricholic acid; TβMCA, tauro-β-muricholic acid; TωMCA, tauro-ω-muricholic acid; TMDCA, tauromurideoxycholic acid; TUDCA, tauroursodeoxycholic acid; UDCA, ursodeoxycholic acid.
Significant difference between the same gender of control and BA-fed groups (P < 0.05).
Significant difference between male and female mouse livers in the same group (P < 0.05).
Feeding CDCA markedly increased TCDCA (3.0→43.1), GCDCA (0.0→0.2), TLCA (0.6→6.2), LCA (0.1→1.1), TMDCA (1.2→4.1), MDCA (1.1→4.2), TUDCA (3.0→12.4), UDCA (0.9→6.7), TαMCA (6.9→31.8), αMCA (5.8→30.5), THCA (0.3→2.3), isoLCA (0.0→0.1), 7-oxoDCA (5.1→9.3), 6-oxoLCA (0.1→0.2), and 7-oxoLCA (0.1→1.3). Feeding LCA significantly increased TLCA (0.6→25.0), TCDCA (3.0→22.7), TUDCA (3.0→5.6), TαMCA (6.9→20.0), THCA (0.3→0.8), TMDCA (1.2→38.8), MDCA (1.1→22.5), THDCA (1.7→10.6), HDCA (1.1→6.0), isoLCA (0.0→0.2), 6-oxoLCA (0.1→0.7), 7-oxoLCA (0.1→0.2), and dehydroLCA (0.0→0.1). In contrast, both CDCA and LCA feeding decreased TCA, βMCA, ωMCA, and CA. In addition, feeding CDCA decreased TβMCA, TωMCA, TDCA, DCA, GCA, 12-oxoCDCA, and 12-oxoLCA (supplementary Figs. VIII and IX).
Mice fed UDCA displayed significant increase in TUDCA (3.0→202.9), GUDCA (0.0→16.5), TCDCA (3.0→7.9), GCDCA (0.0→0.3), CDCA (1.6→19.6), TLCA (0.6→11.1), GLCA (0.0→0.6), LCA (0.1→47.5), TMDCA (1.2→7.0), MDCA (1.1→32.5), isoLCA (0.0→2.5), 7-oxoLCA (0.1→2.4), and dehydroLCA (0.0→1.3) (Table 1 and supplementary Fig. X). However, TαMCA, TβMCA, TωMCA, THCA, TCA, GCA, CA, TDCA, 7-oxoDCA, and 12-oxoLCA were markedly decreased after UDCA feeding.
Concentrations of total BAs in livers of mice fed BAs
Total BAs in livers of mice are expressed as the sum of the values of each BA analyzed (Table 2 and supplementary Fig. XI). Feeding CA, DCA, CDCA, and LCA surprisingly had little effect on total BA concentration in mouse livers. In contrast, feeding UDCA markedly increased total BAs, which may be due to the higher dose of UDCA (3%) than those of other BAs (0.3-1%). Feeding CA increased conjugated BAs (162.9→346.0), but decreased unconjugated BAs (62.7→29.2). Feeding DCA also decreased unconjugated BAs (62.7→15.9). Compared with conjugated BAs (162.9→271.6), unconjugated BAs (62.7→1188.5) were increased much more in livers of mice fed UDCA.
TABLE 2.
Conjugated BAs, unconjugated BAs, and total BAs in livers of mice fed various BA-supplemented diets
| BA (nmol/g liver) | Total Conjugated BA |
Total Unconjugated BA |
Total BA |
|||
|---|---|---|---|---|---|---|
| M | F | M | F | M | F | |
| Control | 162.9 ± 35.5 | 134.8 ± 22.8 | 62.7 ± 7.9 | 35.9 ± 6.3b | 243.4 ± 44.8 | 179.9 ± 29.9 |
| 1% CA | 346.0 ± 46.4a | 266.2 ± 33.6a | 29.2 ± 2.2a | 7.2 ± 1.3a | 378.8 ± 45.9 | 274.1 ± 34.9 |
| 0.3% DCA | 191.7 ± 23.2 | 156.3 ± 27.7 | 15.9 ± 2.3a | 10.1 ± 0.7a | 210.8 ± 24.7 | 167.7 ± 28.3 |
| 0.3% CDCA | 125.8 ± 19.8 | 124.0 ± 17.4 | 96.5 ± 20.0 | 59.0 ± 8.4 | 240.0 ± 40.0 | 190.4 ± 25.6 |
| 0.3% LCA | 188.4 ± 28.9 | 290.4 ± 135.3 | 57.9 ± 9.3 | 43.3 ± 12.7 | 253.0 ± 36.8 | 338.6 ± 148.6 |
| 3% UDCA | 271.6 ± 30.0a | 303.8 ± 46.6a | 1189 ± 282.0a | 1294 ± 229.8a | 1470 ± 299.6a | 1603 ± 266.9a |
| 2% Resin | 66.6 ± 1.4a | 70.7 ± 6.9a | 10.3 ± 1.4a | 8.9 ± 1.0a | 78.9 ± 3.4a | 80.4 ± 7.3a |
Values are expressed as mean ± SEM for five mice in each group. BA, bile acid; CA, cholic acid; CDCA, chenodeoxycholic acid; DCA, deoxycholic acid; F, female; LCA, lithocholic acid; M, male; UDCA, ursodeoxycholic acid.
Significant difference between the same gender of control and BA-fed groups (P < 0.05).
Significant difference between male and female mouse livers in the same group (P < 0.05).
Concentrations of BAs in livers of mice fed 2% resin
The effect of BA sequestrant feeding on hepatic BA metabolism was investigated by feeding mice a 2% resin-supplemented diet for seven days. As shown in supplementary Fig. XII, feeding the resin had a more prominent effect in decreasing the muricholic acids than other BAs in mouse livers. Mice fed the resin displayed marked decreases in TαMCA (6.9→2.4), αMCA (5.8→2.1), TβMCA (34.2→1.2), βMCA (35.1→1.5), TωMCA (18.1→0.3), ωMCA (11.8→0.2), and THCA (0.3→0.0). In addition, feeding the resin also decreased TUDCA (3.0→0.4), UDCA (0.9→0.2), THDCA (1.7→0.1), HDCA (1.1→0.1), 7-oxoDCA (5.1→1.2), and 12-oxoCDCA (12.1→0.5) (Table 1). As a result, feeding the resin decreased both conjugated (162.9→66.6) and unconjugated BAs (62.7→10.3) in mouse livers (Table 2 and supplementary Fig. XI).
Sulfation of CA and CDCA in livers of mice fed BAs
By comparing the retention time and mass spectra with reference BA sulfates, CA and CDCA were found to be sulfated at 7-positions (supplementary Figs. II-IV). Due to the lack of pure standards, the peak areas of BA sulfates were normalized with those of internal standards to quantify their concentrations. As shown in Fig. 2, TCA7S, CA7S, and TCDCA7S were higher in control male than female mice. This indicates that sulfation of CA and CDCA is male-predominant in the liver. TCA7S and CA7S were increased by feeding CA, but markedly suppressed by feeding CDCA (Fig. 2A, B). TCDCA7S was markedly increased by feeding CDCA or LCA, but suppressed by feeding CA or DCA (Fig. 2C). In addition, feeding UDCA markedly suppressed TCA7S, CA7S, and TCDCA7S. Interestingly, feeding the resin increased both TCA7S and TCDCA7S in mice.
Fig. 2.
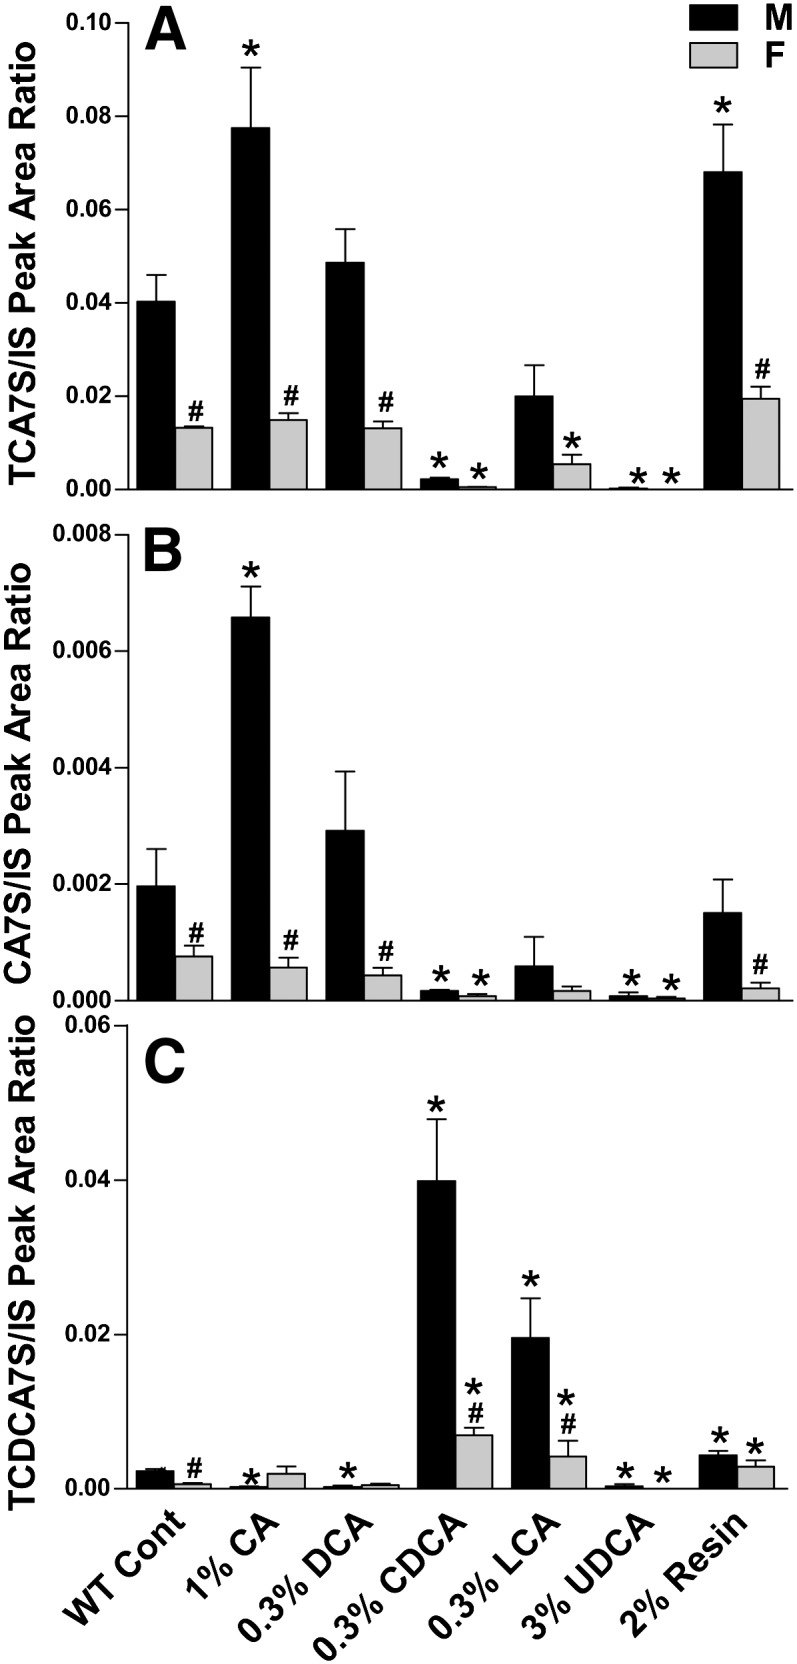
TCA7S (A), CA7S (B), and TCDCA7S (C) in livers of mice fed BAs and resin. The peak areas of TCA7S, TCDCA7S, and CA7S were normalized to that of G-CDCA-d4. The data are expressed as the mean ± SEM for five mice in each group. *Statistically significant difference between the same gender of control and BA-fed groups (P < 0.05). #Statistically significant difference between male and female mouse livers in the same group (P < 0.05). BA, bile acid; CA, cholic acid; CA7S, cholic acid 7-sulfate; Cont, control; CDCA, chenodeoxycholic acid; DCA, deoxycholic acid; LCA, lithocholic acid; TCA7S, taurocholic acid 7-sulfate; TCDCA, taurochenodeoxycholic acid; UDCA, ursodeoxycholic acid; WT, wild-type.
mRNA expression of BA-synthetic genes in livers of mice fed BAs
To investigate the effects of BA feedings on BA biosynthesis, mRNA levels of BA-synthetic enzymes, such as Cyp7a1, 8b1, 27a1, and 7b1, were quantified. As shown in Fig. 3, Cyp7a1 was decreased markedly by feeding CA (M by 92%; F by 85%), CDCA (M by 95%; F by 83%), DCA (M by 92%; F by 64%), and UDCA (M by 99%; F by 99%). Cyp8b1 was higher in livers of male than female control mice. Cyp8b1 was significantly decreased by feeding CA (M by 99%; F by 99%), CDCA (M by 50%; F by 77%), DCA (M by 98%; F by 98%), and UDCA (M by 99%; F by 94%). In addition, feeding LCA decreased Cyp8b1 in male mice (44%) but not female mice. Cyp27a1 was decreased by feeding CA (M by 27%; F by 23%) and UDCA (M by 54%; F by 63%). In addition, Cyp27a1 was decreased by feeding CDCA (22%) and DCA (27%) in male mice but not female mice. Control male mice have much higher Cyp7b1 mRNA expression than female mice. Cyp7b1 was markedly decreased by feeding UDCA (M by 85%; F by 64%). Moreover, feeding CA decreased Cyp7b1 in male mice (38%) but not female mice. Feeding the resin had little effect on Cyp27a1 or Cyp7b1, but markedly increased Cyp7a1 (M by 197%; F by 1650%) and Cyp8b1 (M by 92%; F by 177%).
Fig. 3.

The mRNA levels of BA synthetic genes in livers of mice fed BAs and resin. Total RNA from livers of control and BA-fed mice (n = 5/gender/group) were analyzed by multiplex suspension array. The mRNA level of each gene was normalized to GAPDH. All data are expressed as mean ± SEM. for five mice in each group. *Statistically significant difference between the same gender of control and BA-fed groups (P < 0.05). #Statistically significant difference between male and female mouse livers in the same group (P < 0.05). BA, bile acid; CA, cholic acid; Cont, control; CDCA, chenodeoxycholic acid; Cyp, Cytochrome P450; DCA, deoxycholic acid; LCA, lithocholic acid; UDCA, ursodeoxycholic acid; WT, wild-type.
DISCUSSION
To understand the effects of BA feedings on hepatic gene regulation and hepatotoxicity, it is important to know the changes of liver BA concentrations and composition after BA feeding. The data from the present study showed that mouse liver has a remarkable ability to maintain total BA concentrations during BA feedings. The liver BA concentration can be determined by relative rates of BA hepatic uptake and canalicular secretion, as well as BA biosynthesis and biotransformation. The purpose of the present study was to investigate the BA biotransformation in mice during various BA feedings.
BA sulfation and glucuronidation have been thought to be important pathways to detoxify and eliminate BAs (16, 17). The present study showed that BA glucuronidation is a minor BA metabolic pathway in mice. BA glucuronidation could be detected in mouse livers only after UDCA feeding (supplementary Fig. V), which is not surprising because the massive dose of UDCA (3%) may have overloaded the capacity of enzymes conjugating BA with amino acids (taurine or glycine). Dr. Alan F. Hofmann (18) has summarized the reasons why glucuronidation is not a major metabolic pathway for BAs. Conflicting data have been reported regarding the position of sulfate on the steroid nucleus of BAs. Raedsch et al. (19) reported that in the urine of patients with varying degrees of cholestasis, BAs were sulfated at either the 3-OH position (about two thirds) or the 7-OH position (about one third). However, Almé et al. (20) reported that monosulfates of BAs in human urine were sulfated at the 3-OH position. It was shown that monosulfates at the 7-OH position were the only BA sulfates detected in mouse feces (21). In the present study, both CA and CDCA are found to be sulfated at the 7-OH position in mouse livers. This sulfation is likely specific to the 7α-OH position, because DCA or UDCA feeding did not increase DCA or UDCA sulfates (data not shown). Sulfation is an important detoxification pathway of LCA in man, chimpanzee, and rodents (22). However, in the present study, LCAS could only be detected in female mice fed UDCA, whereas TLCAS could be detected in female mice fed LCA or UDCA. One likely reason for this finding is that feeding the high dose of UDCA markedly increased both LCA and TLCA, whereas feeding LCA only increased TLCA. Sulfation activity has been shown to be gender-dependent in rodents. For example, in germ-free rats, the percentage of BA sulfates was about 10-fold higher in female than male fecal contents (23). The female-predominant sulfation of LCA is likely due to Sult2a, which is predominantly expressed in female mouse livers but is essentially absent from male mouse livers (24). Unlike sulfation of LCA, sulfations of CA and CDCA are male-predominant in mouse liver. CA and CDCA feedings can suppress each other's sulfation, indicating that CA and CDCA are sulfated by the same enzyme. This enzyme activity could be inhibited by high concentrations of UDCA, because UDCA feeding markedly suppressed both CA and CDCA sulfations.
Based on the increased BAs in male mouse livers after BA feeding, metabolic schemes are proposed for each BA biotransformation in mice (Fig. 4–8). During CA feeding, the fed CA can be metabolized to its secondary BA (DCA) by intestinal bacteria (Fig. 4). Both CA and DCA are absorbed from the intestine and travel to the liver, where the majority of them are taken up and conjugated with taurine. Therefore, feeding CA markedly increased hepatic TCA and TDCA. Only a small fraction of CA and DCA were conjugated with glycine in mouse liver, because mouse BA CoA:amino acid N-acyltransferase is specific for taurine (25). IsoDCA is a possible product by DCA epimerization by intestinal bacteria, and 12-oxoLCA is a possible product of DCA oxidation in mouse livers. Both of them are minor metabolites during CA feeding. A previous study showed that incubation of CA with human liver microsomes produced 3-dehydroCA as the only metabolite (5). In the present study, 3-dehydroCA was not detected in livers of mice fed CA. Interestingly, feeding CA decreased most BAs in livers, especially the muricholic acids (>70%). This finding is consistent with the previous report that the percentage of TβMCA in hepatic bile was markedly decreased in mice fed CA and DCA for seven days (26). The decrease in liver BAs, other than the metabolites of the fed BA, may be due to their dilution, enhanced excretion, biotransformation, or suppressed biosynthesis. Feeding CA markedly inhibited the mRNA expression of BA-synthetic enzymes (Cyp7a1, 27a1, 8b1, and 7b1), which may partly contribute to the suppression of liver BAs in mice.
Fig. 4.

A scheme showing proposed metabolic pathways for CA in mice. The dark arrows indicate the major metabolic pathway. The number in the parenthesis indicates the average concentration of individual BAs in mouse livers. CA (4.7→18.8) means that CA was increased from 4.7 to 18.8 nmol/g in livers of male mice fed CA. TCA7S (92%↑) means that TCA7S was increased 92% in livers of male mice fed CA. BA, bile acid; CA, cholic acid; CA7S, cholic acid 7-sulfate; DCA, deoxycholic acid; GCA, glycocholic acid; GCDCA, glycochenodeoxycholic acid; LCA, lithocholic acid; TCA, taurocholic acid; TCA7S, taurocholic acid 7-sulfate; TDCA, taurodeoxycholic acid.
Fig. 5.

A scheme showing proposed metabolic pathways for DCA in mice. The dark arrows indicate the major metabolic pathway. The number in the parenthesis indicates the average concentration of individual BAs in mouse livers. DCA (0.4→5.1) means that DCA was increased from 0.4 to 5.1 nmol/g in livers of male mice fed DCA. BA, bile acid; CA, cholic acid; DCA, deoxycholic acid; GDCA, glycodeoxycholic acid; LCA, lithocholic acid; TCA, taurocholic acid; TDCA, taurodeoxycholic acid.
Fig. 6.

A scheme showing proposed metabolic pathways for CDCA in mice. The dark arrows indicate the major metabolic pathway. The number in the parenthesis indicates the average concentration of individual BAs in mouse livers. CDCA (1.6→36.0) means that CDCA was increased from 1.6 to 36.0 nmol/g in livers of male mice fed CDCA. BA, bile acid; CDCA, chenodeoxycholic acid; CDCA7S, chenodeoxycholic acid 7-sulfate; GCDCA, glycochenodeoxycholic acid; LCA, lithocholic acid; αMCA, α-muricholic acid; MDCA, murideoxycholic acid; TCDCA, taurochenodeoxycholic acid; TDCA, taurodeoxycholic acid; TDCA7S, taurodeoxycholic acid 7-sulfate; TαMCA, tauro-α-muricholic acid; THCA, taurohyocholic acid; TMDCA, tauromurideoxycholic acid; TUDCA, tauroursodeoxycholic acid; UDCA, ursodeoxycholic acid.
Fig. 7.

A scheme showing proposed metabolic pathways for LCA in mice. The dark arrows indicate the major metabolic pathway. The number in the parenthesis indicates the average concentration of individual BAs in mouse livers. LCA (0.1→3.1) means that LCA was increased from 0.1 to 3.1 nmol/g in livers of male mice fed LCA. BA, bile acid; CDCA, chenodeoxycholic acid; HDCA, hyodeoxycholic acid; LCA, lithocholic acid; MDCA, murideoxycholic acid; TCDCA, taurochenodeoxycholic acid; THCA, taurohyocholic acid; THDCA, taurohyodeoxycholic acid; TLCA, taurolithocholic acid; TLCAS, taurolithocholic acid sulfate; TαMCA, tauro-α-muricholic acid; TMDCA, tauromurideoxycholic acid.
Fig. 8.

A scheme showing proposed metabolic pathways for UDCA in mice. The dark arrows indicate the major metabolic pathway. The number in the parenthesis indicates the average concentration of individual BAs in mouse livers. UDCA (0.9→875.4) means that UDCA was increased from 0.9 to 875.4 nmol/g in livers of male mice fed UDCA. BA, bile acid; CA, cholic acid; CDCA, chenodeoxycholic acid; GLCA, glycolithocholic acid; GCDCA, glycochenodeoxycholic acid; GUDCA, glycoursodeoxycholic acid; LCA, lithocholic acid; MDCA, murideoxycholic acid; TCDCA, taurochenodeoxycholic acid; TLCA, taurolithocholic acid; TLCAS, taurolithocholic acid sulfate; TMDCA, tauromurideoxycholic acid; TUDCA, tauroursodeoxycholic acid; UDCA, ursodeoxycholic acid.
The concentrations of various BAs in mouse liver after DCA feeding changed similarly to that after CA feeding (Fig. 5). The majority of the fed DCA were conjugated with taurine in mouse liver. DCA feeding tended to increase hepatic TCA and CA, which was statistically significant when mice were fed a higher concentration of DCA (data not shown). Therefore, DCA and TDCA can be rehydroxylated to CA and TCA in mouse liver, a process known as BA “repair” (3). IsoDCA and 12-oxoDCA were minor metabolites during DCA feeding. DCA can undergo hepatic 3α-dehydrogenation to form 3-dehydroDCA in the guinea pig (27). In mice, 3-dehydroDCA is also a possible intermediate between DCA and isoDCA. However, due to lack of a standard, we did not quantify 3-dehydroDCA in the present study. Shefer et al. (28) showed that isoBAs can undergo hepatic transformation to their corresponding 3α-hydroxy epimers in the rat. Therefore, the DCA metabolite isoDCA could be converted back to DCA in mouse liver. Similar to feeding CA, feeding DCA also decreased most BAs in mouse livers, which may be partly due to the suppression of hepatic Cyp7a1, 8b1, and 27a1.
A scheme for CDCA biotransformation in mice is proposed in Fig. 6. The fed CDCA is metabolized to LCA and UDCA by intestinal bacteria. The majority of them are conjugated with taurine in mouse liver. During CDCA feeding, mouse liver can hydroxylate CDCA at the 6β-position to form αMCA, which can be further dehydroxlated to form MDCA in the intestine. Wang et al. (26) reported that CDCA feeding increased TβMCA in mouse hepatic bile. In the present study, CDCA feeding increased TαMCA but not TβMCA. This finding may be due to the difference of BA analytical methods, because it is difficult to separate αMCA from βMCA on the HPLC column. Incubation of CDCA with human hepatic microsomes suggests that 3-dehydroCDCA and HCA were major metabolites of CDCA, whereas 7-oxoLCA and CA were minor metabolites of CDCA (5). Our study suggests HCA is a minor metabolite of CDCA in mice, whereas liver CA was decreased by CDCA feeding. Two major peaks with the same mass spectra as 3-dehydroCDCA were found in livers of mice fed CDCA, whereas they were almost undetectable in livers of control mice (supplementary Fig. V). The mRNA expression of Cyp7a1 and Cyp8b1, two enzymes involved in the classic pathway of BA synthesis, were markedly suppressed by feeding CDCA. This finding may partly contribute to the decreased TCA, CA, TDCA, and DCA in mouse livers after CDCA feeding.
The BA profile in mouse livers after LCA feeding undergoes changes similar to those after CDCA feeding (Fig. 7). Hydroxylation and sulfation are major pathways to detoxify LCA (8, 22, 29). LCA can be hydroxylated to form HDCA, MDCA, and CDCA in human liver microsomes (30). Cyp3A has been suggested to mediate LCA hydroxylation in human, rat, and mouse (31–33). In the present study, LCA could be hydroxylated at its 6- or 7-position to produce MDCA, HDCA, or CDCA. The majority of them were conjugated with taurine in mouse liver. Among them, MDCA was increased more than other metabolites, suggesting that the 6β-position of LCA is more readily hydroxylated than other positions. Consistently, 6-oxoLCA was increased more than 7-oxoLCA after feeding LCA. In rat, MDCA, isoLCA, and dehydroLCA were the major LCA metabolites produced by rat liver microsomes, whereas 6-oxoLCA and UDCA were minor metabolites (34). In the present study, isoLCA and dehydroLCA were minor LCA metabolites in mice. Similar to CDCA feeding, LCA feeding increased TαMCA and THCA, but decreased CA in male mouse livers. This result may be partly due to the suppression of the classic pathway of BA-synthetic enzymes Cyp7a1 and Cyp8b1 after LCA feeding.
UDCA is a primary BA in some mammals (e.g., bear, beaver, and nutria) and has been used to treat cholesterol gallstones, primary biliary cirrhosis, and cholestasis of pregnancy (3, 35). The metabolic scheme for UDCA is proposed in Fig. 8. UDCA can be dehydroxylated to LCA by intestinal bacteria. The high dose of UDCA (3%) could saturate BA-conjugation enzymes, and the majority of UDCA and LCA were unconjugated in mouse livers. In mouse liver, LCA can be further hydroxylated at the 6β- and 7α-positions. UDCA feeding increased liver MDCA more than CDCA, which is consistent with the previous hypothesis that the 6β-position of LCA is more readily hydroxylated than the 7α-position. However, UDCA feeding had little effect on 6-oxoLCA, but it increased 7-oxoLCA. Therefore, 7-oxoLCA may be produced by UDCA instead of LCA oxidation. UDCA feeding markedly suppressed TαMCA, TβMCA, TωMCA, TCA, TDCA, and CA, which is consistent with the previous report by Wang et al. (26) that UDCA feeding decreased TβMCA and TCA in mouse hepatic bile. This suppression may be partly due to the marked inhibition of both classic (Cyp7a1 and Cyp8b1) and alternative (Cyp27a1 and Cyp7b1) pathways of BA synthesis in mice after UDCA feeding.
BA-binding resins (e.g., cholestyramine, colestipol, and colesevelam) are used to treat hypercholesterolemia and type 2 diabetes (36). Feeding the resin decreased most BAs in mouse livers. However, it tended to increase CDCA and LCA in male mice, and the increase was statistically significant in female mice. This result is consistent with a previous finding in rats that feeding resin markedly increased CDCA but decreased βMCA in bile (37). Feeding resin markedly decreased both conjugated and unconjugated BAs in mouse livers. As a feedback, the mRNA expression of liver Cyp7a1 and Cyp8b1 were markedly increased after feeding resin.
Male mice tend to have higher concentrations of BA metabolites than females during BA feedings (Table 3). Feeding CA increased hepatic CA and DCA more in male than female mice. Moreover, 12-oxoLCA was increased only in male mice after CA feeding. Feeding DCA increased TDCA, GDCA, DCA, and 12-oxoLCA more in male than female mice. During CDCA feeding, male mice had higher hepatic CDCA, LCA, 6-oxoLCA, and 7-oxoLCA than female mice. After LCA feeding, male mice had more TMDCA, TLCA, 7-oxoLCA, 12-oxoLCA, and dehydroLCA than female mice. Gender differences in BA metabolism may explain the gender-different response of the BA-synthetic enzymes following BA feedings. For example, feeding CA suppressed Cyp7b1 in male mice but not in female mice, and feeding DCA decreased Cyp7a1 more in male mice than female mice. The gender difference in hepatic BAs was not prominent during UDCA feeding, except that male mice tended to have higher oxo-BAs than female mice. During resin feeding, female mice expressed more hepatic Cyp7a1 and Cyp27a1 than male mice. This finding may be due to lower liver CA concentrations in female mice than male mice after resin feeding. Because Cyp27a1 initiates the alternative pathway of BA synthesis, the induction of Cyp27a1 may explain why CDCA and LCA were increased in livers of female mice fed resin.
TABLE 3.
Gender difference of hepatic BA and BA synthetic enzymes in mice fed various BA-supplemented diets
| Hepatic BA |
BA-synthetic Enzymes |
|||
|---|---|---|---|---|
| M > F | M < F | M > F | M < F | |
| Control | αMCA, ωMCA, CDCA, LCA,7-oxoDCA, 7-oxoLCA, 12-oxoLCA | Cyp8b1, Cyp7b1 | ||
| 1% CA | αMCA, βMCA, ωMCA, CA, MDCA, UDCA, HDCA, isoDCA, CDCA, DCA, 7-oxoDCA, 12-oxoCDCA, 12-oxoLCA | TMDCA | Cyp7b1 | Cyp27a1 |
| 0.3% DCA | TDCA, GDCA, DCA, GCA, isoDCA, 7-oxoDCA, 12-oxoLCA | TUDCA, UDCA | Cyp7b1 | Cyp7a1, Cyp27a1 |
| 0.3% CDCA | CDCA, DCA, LCA, 7-oxoDCA, 6-oxoLCA, 7-oxoLCA, 12-oxoLCA | Cyp8b1, Cyp7b1 | ||
| 0.3% LCA | 7-oxoDCA, 6-oxoLCA, 12-oxoLCA | Cyp7b1 | ||
| 3% UDCA | 7-oxoDCA | Cyp7b1 | Cyp8b1 | |
| 2% Resin | CA, 7-oxoDCA | TαMCA, TβMCA, TωMCA, THCA, TCDCA, TMDCA, TUDCA, THDCA, TLCA, HDCA, LCA | Cyp7b1 | Cyp7a1, Cyp27a1 |
BA, bile acid; CA, cholic acid; Cyp, cytochrome P450; CDCA, chenodeoxycholic acid; DCA, deoxycholic acid; F, female; GCA, glycocholic acid; GDCA, glycodeoxycholic acid; HDCA, hyodeoxycholic acid; LCA, lithocholic acid; M, male; αMCA, α-muricholic acid; βMCA, β-muricholic acid; ωMCA, ω-muricholic acid; MDCA, murideoxycholic acid; 12-oxoCDCA, 3α,7α-dihydroxy-12-oxo-5β–cholan-24-oic acid; 7-oxoDCA, 3α,12α-dihydroxy-7-oxo-5β–cholan-24-oic acid; 7-oxoLCA, 3α-hydroxy-7-oxo-5β–cholan-24-oic acid; 12-oxoLCA, 3α-hydroxy-12-oxo-5β–cholan-24-oic acid; TCDCA, taurochenodeoxycholic acid; TDCA, taurodeoxycholic acid; THCA, taurohyocholic acid; THDCA, taurohyodeoxycholic acid; TLCA, taurolithocholic acid; TαMCA, tauro-α-muricholic acid; TβMCA, tauro-β-muricholic acid; TωMCA, tauro-ω-muricholic acid; TMDCA, tauromurideoxycholic acid; TUDCA, tauroursodeoxycholic acid; UDCA, ursodeoxycholic acid.
In summary, the present study established an improved simple and sensitive UPLC/MS/MS method for the simultaneous analysis of hydroxy-oxo BAs, as well as BA-sulfates and BA-glucuronides in mouse livers. This method was validated and applied to investigate the BA metabolism in mice fed CA, CDCA, DCA, LCA, UDCA, or resin. Accordingly, the metabolic pathways of each BA in vivo are proposed and can be used to interpret BA-mediated gene regulation and hepatotoxicity.
Supplementary Material
Acknowledgments
The authors thank the members in Dr. Klaassen's lab for tissue collection and manuscript reviewing. Special thanks to Dr. Alan F. Hofmann (University of California, San Diego) for generously providing reference BAs. The authors also thank Dr. Ivan Csanaky for assistance in optimizing BA extraction and Dr. Scott Reisman for assistance in quantifying mRNA.
Footnotes
Abbreviations:
- alloLCA, allolithocholic acid
- 3α-hydroxy-5α–cholan-24-oic acid
- BA
- bile acid
- BAG
- bile acid glucuronide
- BAS
- bile acid sulfate
- CA, cholic acid
- 3α,7α,12α–trihydroxy-5β–cholan-24-oic acid
- CA3S
- cholic acid 3-sulfate
- CA7S
- cholic acid 7-sulfate
- CA12S
- cholic acid 12-sulfate
- Cyp
- cytochrome P450
- CDCA, chenodeoxycholic acid
- 3α,7α-dihydroxy-5β–cholan-24-oic acid
- CDCA3S
- chenodeoxycholic acid 3-sulfate
- CDCA7S
- chenodeoxycholic acid 7-sulfate
- DCA, deoxycholic acid
- 3α,12α-dihydroxy-5β–cholan-24-oic acid
- 3-DCA, 3-deoxycholic acid
- 7α,12α-dihydroxy-5β–cholan-24-oic acid
- DCA3S
- deoxycholic acid 3-sulfate
- DCA12S
- deoxycholic acid 12-sulfate
- 3-dehydroCA
- 7α,12α-dihydroxy-3-oxo-5β–cholan-24-oic acid
- 3-dehydroCDCA
- 7α-dihydroxy-3-oxo-5β–cholan-24-oic acid
- dehydroLCA
- 3-oxo-5β-cholan-24-oic acid
- Gapdh
- Glyceraldehyde-3-phosphate dehydrogenase
- GCA, glycocholic acid
- 3α,7α,12α–trihydroxy-5β–cholan-24-oylglycine
- GCDCA, glycochenodeoxycholic acid
- 3α,7α-dihydroxy-5β–cholan-24-oylglycine
- GCDCA3S
- glycochenodeoxycholic acid 3-sulfate
- GDCA, glycodeoxycholic acid
- 3α,12α-dihydroxy-5β–cholan-24-oylglycine
- GDCA3S
- glycodeoxycholic acid 3-sulfate
- GHDCA, glycohyodeoxycholic acid
- 3α,6α-dihydroxy-5β–cholan-24-oylglycine
- GLCA, glycolithocholic acid
- 3α-hydroxy-5β–cholan-24-oylglycine
- GLCAS
- glycolithocholic acid sulfate
- GUDCA, glycoursodeoxycholic acid
- 3α,7β-dihydroxy-5β–cholan-24-oylglycine
- HCA, hyocholic acid
- 3α,6α,7α-trihydroxy-5β–cholan-24-oic acid
- HDCA, hyodeoxycholic acid
- 3α,6α-dihydroxy-5β–cholan-24-oic acid
- IS
- internal standard
- isoDCA, iso-deoxycholic acid
- 3β,12α-dihydroxy-5β–cholan-24-oic acid
- isoLCA, iso-lithocholic acid
- 3β-hydroxy-5β–cholan-24-oic acid
- LCA, lithocholic acid
- 3α-hydroxy-5β–cholan-24-oic acid
- LCAS
- lithocholic acid sulfate
- αMCA, α-muricholic acid
- 3α,6β,7α-trihydroxy-5β–cholan-24-oic acid
- βMCA, β-muricholic acid
- 3α,6β,7β-trihydroxy-5β–cholan-24-oic acid
- ωMCA, ω-muricholic acid
- 3α,6a,7β-trihydroxy-5β–cholan-24-oic acid
- MDCA, murideoxycholic acid, 3α
- 6β-dihydroxy-5β–cholan-24-oic acid
- MRM
- multiple reaction monitoring
- m/z
- mass to charge ratio
- 6-oxo-alloLCA
- 3α-hydroxy-6-oxo-5α–cholan-24-oic acid
- 12-oxoCDCA
- 3α,7α-dihydroxy-12-oxo-5β–cholan-24-oic acid
- 7-oxoDCA
- 3α,12α-dihydroxy-7-oxo-5β–cholan-24-oic acid
- 7-oxoHDCA
- 3α,6α-dihydroxy-7-oxo-5β–cholan-24-oic acid
- 6-oxoLCA
- 3α-hydroxy-6-oxo-5β–cholan-24-oic acid
- 7-oxoLCA
- 3α-hydroxy-7-oxo-5β–cholan-24-oic acid
- 12-oxoLCA
- 3α-hydroxy-12-oxo-5β–cholan-24-oic acid
- TCA, taurocholic acid
- 3α,7α,12α–trihydroxy-5β–cholan-24-oyltaurine
- TCA3S
- taurocholic acid 3-sulfate
- TCDCA, taurochenodeoxycholic acid
- 3α,7α-dihydroxy-5β–cholan-24-oyltaurine
- TCDCA3S
- taurochenodeoxycholic acid 3-sulfate
- TDCA, taurodeoxycholic acid
- 3α,12α-dihydroxy-5β–cholan-24-oyltaurine
- TDCA3S
- taurodeoxycholic acid 3-sulfate
- THCA, taurohyocholic acid
- 3α,6α,7α-trihydroxy-5β–cholan-24-oyltaurine
- THDCA, taurohyodeoxycholic acid
- 3α,6α-dihydroxy-5β–cholan-24-oyltaurine
- TLCA, taurolithocholic acid
- 3α-hydroxy-5β–cholan-24-oyltaurine
- TLCAS
- taurolithocholic acid sulfate
- TαMCA, tauro-α-muricholic acid
- 3α,6β,7α-trihydroxy-5β–cholan-24-oyltaurine
- TβMCA, tauro-β-muricholic acid
- 3α,6β,7β-trihydroxy-5β–cholan-24-oyltaurine
- TωMCA, tauro-ω-muricholic acid
- 3α,6a,7β-trihydroxy-5β–cholan-24-oyltaurine
- TMDCA, tauromurideoxycholic acid, 3α
- 6β-dihydroxy-5β–cholan-24-oyltaurine
- TUDCA, tauroursodeoxycholic acid
- 3α,7β-dihydroxy-5β–cholan-24-oyltaurine
- UDCA, ursodeoxycholic acid
- 3α,7β-dihydroxy-5β–cholan-24-oic acid
- UPLC/MS/MS
- ultra performance liquid chromatography-tandem mass spectrometry
- WT
- wild-type
This work was supported by National Institutes of Health Grants ES-009649, ES-013714, ES-009716, and RR-021940. Its contents are solely the responsibility of the authors and do not necessarily represent the official views of the National Institutes of Health.
The online version of this article (available at http://www.jlr.org) contains supplementary data in the form of an experimental procedure with 12 figures and one table.
REFERENCES
- 1.Chiang J. Y. 2002. Bile acid regulation of gene expression: roles of nuclear hormone receptors. Endocr. Rev. 23: 443–463. [DOI] [PubMed] [Google Scholar]
- 2.Botham K. M., Boyd G. S. 1983. The metabolism of chenodeoxycholic acid to beta-muricholic acid in rat liver. Eur. J. Biochem. 134: 191–196. [DOI] [PubMed] [Google Scholar]
- 3.Hofmann A. F., Hagey L. R. 2008. Bile acids: chemistry, pathochemistry, biology, pathobiology, and therapeutics. Cell. Mol. Life Sci. 65: 2461–2483. [DOI] [PMC free article] [PubMed] [Google Scholar]
- 4.Hofmann A. F., Sjovall J., Kurz G., Radominska A., Schteingart C. D., Tint G. S., Vlahcevic Z. R., Setchell K. D. 1992. A proposed nomenclature for bile acids. J. Lipid Res. 33: 599–604. [PubMed] [Google Scholar]
- 5.Deo A. K., Bandiera S. M. 2008. Identification of human hepatic cytochrome p450 enzymes involved in the biotransformation of cholic and chenodeoxycholic acid. Drug Metab. Dispos. 36: 1983–1991. [DOI] [PubMed] [Google Scholar]
- 6.Yousef I. M., Magnusson R., Price V. M., Fisher M. M. 1973. Bile acid metabolism in mammals. V. Studies on the sex difference in the response of the isolated perfused rat liver to chenodeoxycholic acid. Can. J. Physiol. Pharmacol. 51: 418–423. [DOI] [PubMed] [Google Scholar]
- 7.Fisher M. M., Price V. M., Magnusson R. J., Yousef I. M. 1974. Bile acid metabolism in mammals. VII. Studies on sex differences in deoxycholic acid metabolism in isolated perfused rat liver. Lipids. 9: 786–794. [DOI] [PubMed] [Google Scholar]
- 8.Kitada H., Miyata M., Nakamura T., Tozawa A., Honma W., Shimada M., Nagata K., Sinal C. J., Guo G. L., Gonzalez F. J., et al. 2003. Protective role of hydroxysteroid sulfotransferase in lithocholic acid-induced liver toxicity. J. Biol. Chem. 278: 17838–17844. [DOI] [PubMed] [Google Scholar]
- 9.Alpini G., Glaser S. S., Ueno Y., Rodgers R., Phinizy J. L., Francis H., Baiocchi L., Holcomb L. A., Caligiuri A., LeSage G. D. 1999. Bile acid feeding induces cholangiocyte proliferation and secretion: evidence for bile acid-regulated ductal secretion. Gastroenterology. 116: 179–186. [DOI] [PubMed] [Google Scholar]
- 10.Hofmann A. F. 1999. Bile acids: the good, the bad, and the ugly. News Physiol. Sci. 14: 24–29. [DOI] [PubMed] [Google Scholar]
- 11.Goodwin B., Kliewer S. A. 2002. Nuclear receptors. I. Nuclear receptors and bile acid homeostasis. Am. J. Physiol. Gastrointest. Liver Physiol. 282: G926–G931. [DOI] [PubMed] [Google Scholar]
- 12.Delzenne N. M., Calderon P. B., Taper H. S., Roberfroid M. B. 1992. Comparative hepatotoxicity of cholic acid, deoxycholic acid and lithocholic acid in the rat: in vivo and in vitro studies. Toxicol. Lett. 61: 291–304. [DOI] [PubMed] [Google Scholar]
- 13.Alnouti Y., Csanaky I. L., Klaassen C. D. 2008. Quantitative-profiling of bile acids and their conjugates in mouse liver, bile, plasma, and urine using LC-MS/MS. J. Chromatogr. B Analyt. Technol. Biomed. Life Sci. 873: 209–217. [DOI] [PMC free article] [PubMed] [Google Scholar]
- 14.Hagio M., Matsumoto M., Fukushima M., Hara H., Ishizuka S. 2009. Improved analysis of bile acids in tissues and intestinal contents of rats using LC/ESI-MS. J. Lipid Res. 50: 173–180. [DOI] [PubMed] [Google Scholar]
- 15.Yeager R. L., Reisman S. A., Aleksunes L. M., Klaassen C. D. 2009. Introducing the “TCDD-inducible AhR-Nrf2 gene battery.” Toxicol. Sci. 111: 238–246. [DOI] [PMC free article] [PubMed] [Google Scholar]
- 16.Trottier J., Verreault M., Grepper S., Monte D., Belanger J., Kaeding J., Caron P., Inaba T. T., Barbier O. 2006. Human UDP-glucuronosyltransferase (UGT)1A3 enzyme conjugates chenodeoxycholic acid in the liver. Hepatology. 44: 1158–1170. [DOI] [PubMed] [Google Scholar]
- 17.Alnouti Y. 2009. Bile acid sulfation: a pathway of bile acid elimination and detoxification. Toxicol. Sci. 108: 225–246. [DOI] [PubMed] [Google Scholar]
- 18.Hofmann A. F. 2007. Why bile acid glucuronidation is a minor pathway for conjugation of endogenous bile acids in man. Hepatology. 45: 1083–1084; author reply 1084–1085. [DOI] [PubMed] [Google Scholar]
- 19.Raedsch R., Lauterburg B. H., Hofmann A. F. 1981. Altered bile acid metabolism in primary biliary cirrhosis. Dig. Dis. Sci. 26: 394–401. [DOI] [PubMed] [Google Scholar]
- 20.Almé B., Bremmelgaard A., Sjovall J., Thomassen P. 1977. Analysis of metabolic profiles of bile acids in urine using a lipophilic anion exchanger and computerized gas-liquid chromatorgaphy-mass spectrometry. J. Lipid Res. 18: 339–362. [PubMed] [Google Scholar]
- 21.Eyssen H. J., Parmentier G. G., Mertens J. A. 1976. Sulfate bile acids in germ-free and conventional mice. Eur. J. Biochem. 66: 507–514. [DOI] [PubMed] [Google Scholar]
- 22.Hofmann A. F. 2004. Detoxification of lithocholic acid, a toxic bile acid: relevance to drug hepatotoxicity. Drug Metab. Rev. 36: 703–722. [DOI] [PubMed] [Google Scholar]
- 23.Eyssen H., Smets L., Parmentier G., Janssen G. 1977. Sex-linked differences in bile acid metabolism of germfree rats. Life Sci. 21: 707–712. [DOI] [PubMed] [Google Scholar]
- 24.Alnouti Y., Klaassen C. D. 2008. Regulation of sulfotransferase enzymes by prototypical microsomal enzyme inducers in mice. J. Pharmacol. Exp. Ther. 324: 612–621. [DOI] [PubMed] [Google Scholar]
- 25.Falany C. N., Fortinberry H., Leiter E. H., Barnes S. 1997. Cloning, expression, and chromosomal localization of mouse liver bile acid CoA:amino acid N-acyltransferase. J. Lipid Res. 38: 1139–1148. [PubMed] [Google Scholar]
- 26.Wang D. Q., Tazuma S., Cohen D. E., Carey M. C. 2003. Feeding natural hydrophilic bile acids inhibits intestinal cholesterol absorption: studies in the gallstone-susceptible mouse. Am. J. Physiol. Gastrointest. Liver Physiol. 285: G494–G502. [DOI] [PubMed] [Google Scholar]
- 27.Cantafora A., Alvaro D., Attili A. F., Di Biase A., Anza M., Mantovani A., Angelico M. 1986. Hepatic 3 alpha-dehydrogenation and 7 alpha-hydroxylation of deoxycholic acid in the guinea-pig. Comp. Biochem. Physiol. B. 85: 805–810. [DOI] [PubMed] [Google Scholar]
- 28.Shefer S., Salen G., Hauser S., Dayal B., Batta A. K. 1982. Metabolism of iso-bile acids in the rat. J. Biol. Chem. 257: 1401–1406. [PubMed] [Google Scholar]
- 29.Kurata Y. 1967. Stero-bile acids and bile alcohols. CII. Metabolism of lithocholic acid in a mouse and a dog. Hiroshima J. Med. Sci. 16: 281–285. [PubMed] [Google Scholar]
- 30.Xie W., Radominska-Pandya A., Shi Y., Simon C. M., Nelson M. C., Ong E. S., Waxman D. J., Evans R. M. 2001. An essential role for nuclear receptors SXR/PXR in detoxification of cholestatic bile acids. Proc. Natl. Acad. Sci. USA. 98: 3375–3380. [DOI] [PMC free article] [PubMed] [Google Scholar]
- 31.Staudinger J. L., Goodwin B., Jones S. A., Hawkins-Brown D., MacKenzie K. I., LaTour A., Liu Y., Klaassen C. D., Brown K. K., Reinhard J., et al. 2001. The nuclear receptor PXR is a lithocholic acid sensor that protects against liver toxicity. Proc. Natl. Acad. Sci. USA. 98: 3369–3374. [DOI] [PMC free article] [PubMed] [Google Scholar]
- 32.Makishima M., Lu T. T., Xie W., Whitfield G. K., Domoto H., Evans R. M., Haussler M. R., Mangelsdorf D. J. 2002. Vitamin D receptor as an intestinal bile acid sensor. Science. 296: 1313–1316. [DOI] [PubMed] [Google Scholar]
- 33.Bodin K., Lindbom U., Diczfalusy U. 2005. Novel pathways of bile acid metabolism involving CYP3A4. Biochim. Biophys. Acta. 1687: 84–93. [DOI] [PubMed] [Google Scholar]
- 34.Deo A. K., Bandiera S. M. 2008. Biotransformation of lithocholic acid by rat hepatic microsomes: metabolite analysis by liquid chromatography/mass spectrometry. Drug Metab. Dispos. 36: 442–451. [DOI] [PubMed] [Google Scholar]
- 35.Glantz A., Marschall H. U., Lammert F., Mattsson L. A. 2005. Intrahepatic cholestasis of pregnancy: a randomized controlled trial comparing dexamethasone and ursodeoxycholic acid. Hepatology. 42: 1399–1405. [DOI] [PubMed] [Google Scholar]
- 36.Aldridge M. A., Ito M. K. 2001. Colesevelam hydrochloride: a novel bile acid-binding resin. Ann. Pharmacother. 35: 898–907. [DOI] [PubMed] [Google Scholar]
- 37.Imai Y., Kawata S., Inada M., Miyoshi S., Minami Y., Matsuzawa Y., Uchida K., Tarui S. 1987. Effect of cholestyramine on bile acid metabolism in conventional rats. Lipids. 22: 513–516. [DOI] [PubMed] [Google Scholar]
Associated Data
This section collects any data citations, data availability statements, or supplementary materials included in this article.