

Abstract
While human bone marrow derived mesenchymal stem cells (BMSCs) are of great interest for their potential therapeutic value, its murine equivalent remains an important basic research model that can provide critical insights into the biology of this progenitor cell population. Here we present a novel transgenic strategy that allowed for the selective identification and isolation of murine BMSCs at the early stages of stromal cell culture. This strategy involved crossing Twist2 –Cre mice with Cre reporter mice such as Z/EG or Ai9, which express EGFP or Tomato fluorescent protein, respectively, upon Cre mediated excision of a stop sequence. Using this approach, we identified an adherent fluorescent protein+ cell population (T2C+) that is present during the earliest stages of colony formation and by day 5 of culture represents ~20% of the total cell population. Cell surface profiling by flow cytometry showed that T2C+ cells are highly positive for SCA1 and CD29 and negative for CD45, CD117, TIE2, and TER119. Isolation of T2C+ cells by FACS selected for a cell population with skeletal potential that can be directed to differentiate into osteoblasts, adipocytes, or chondrocytes. We also demonstrated in a calvarial bone defect model that T2C+ cells retain a strong efficacy for osteogenic repair and can support a hematopoietic environment. Collectively, these studies provide evidence that the Twist2-Cre x Cre reporter breeding strategy can be used to positively identify and isolate multipotent murine BMSCs.
Introduction
The first evidence for the presence of a rare skeletal progenitor cell population present in the bone marrow was provided by Friedenstein and colleagues [1]. This cell population, when flushed out of the bone marrow, could be enriched for based on its semi-selective adherence to tissue culture plastic relative to the majority of non-adherent hematopoietic cells [2]. Since then, many research groups have substantiated their work and have further sought to understand the biology of bone marrow derived mesenchymal stem cells (BMSCs) [3–8].
While BMSCs have been derived from several different animal species, work on human BMSCs has progressed markedly faster, largely because of their potential direct therapeutic importance. However, human BMSCs also possess additional advantages that are not universal to BMSCs derived from other animal species. Human BMSCs retain the ability to be expanded for several passages while maintaining some degree of multipotency and are not heavily contaminated by other cellular derivatives [6, 8, 9]. Moreover, the existence of a unique cell surface marker, Stro-1, has aided human BMSC studies [10, 11].
Work on murine BMSCs has progressed notably slower than its human counterpart. Under conventional culturing methodologies mouse BMSCs retain an extremely limited capacity to expand and are heavily contaminated with hematopoietic cellular components [7]. Furthermore, no unique cell surface markers exist to uniquely identify mouse BMSCs. Despite the inherent problems associated with culturing mouse BMSCs, the mouse is a formidable animal model with an extensive toolbox of recombinant DNA methodologies to genetically manipulate its genome. Moreover, the already existing resource of genetic mutant mice from which BMSCs can be readily derived has much to offer the field of BMSC biology.
Methodologies to isolate and culture mouse BMSCs in recent years have substantially progressed. One successful approach to enrich for mouse BMSCs involves a negative selection strategy where hematopoietic cells are removed from culture by immunodepletion [7]. In this study, we present a positive selection transgenic strategy to isolate murine BMSCs by crossing Twist2-Cre recombinase mice with Cre reporter mice, which express a fluorescent protein upon Cre mediated excision of a stop sequence. The rationale for choosing Twist2-Cre mice was based on evidence for the early role that Twist genes play during skeletal development and their ability to promote mesenchymal cell morphology [12–16]. Bone marrow stromal cell cultures derived from Twist2-Cre/+; Cre reporter dual transgenic mice identifies an adherent, fluorescent protein+ cell population (T2C+) that can be visualized at the earliest stages of stromal cell culture. T2C+ cells isolated from day 5 stromal cultures are largely positive for SCA1 and CD29. In vitro differentiation of T2C+ cells provided evidence for their skeletal potential retaining the capacity to differentiate into osteoblasts, adipocytes, and chondrocytes. Transplantation of T2C+ cells also directly contributed to osteogenic repair in an in vivo calvarial defect model. Collectively, these data suggest that the crossing of Twist2-Cre mice with Cre reporter mice identified a cell population with characteristics of BMSCs in early stage stromal cell cultures. Furthermore, the persistent expression of the fluorescent protein Cre reporter allowed for their isolation by FACS and their historical marking whether it be in cell culture or during transplantation studies.
Materials and Methods
Harvesting and Cell Culture of BMSCs from mouse bone
The care of animals was in accordance with institutional guidelines. Offspring from Twist2-Cre x Z/EG matings and Twist2-Cre X Ai9 matings were used to derive BMSC cultures. In brief, two to four month old mice were sacrificed by CO2 asphyxiation followed by cervical dislocation. Femurs and tibia were dissected from the surrounding tissues. The epiphyseal growth plates were removed and the bone marrow was collected by flushing with αMEM culture medium containing 100 U/ml Penicillin, 100 μg/ml streptomycin and 10% FCS (Hyclone) with a 25 gauge needle. Single cell suspensions were prepared by gently mixing the cells with a pipette followed by filtration through a 70-μm strainer. Cells were centrifuged at 350g for 10 minutes and plated at a density 3 × 10⁶ cells/cm2. At day four, the cells get a complete media change. On day five, the cells were sorted and processed.
Colony Forming Unit Assays
Bone marrow stromal cultures were prepared as described above. 2×10⁶ cells of total bone marrow was plated in 100mm dishes and allowed to grow for two weeks in αMEM culture medium containing 100 U/ml Penicillin, 100 μg/ml streptomycin and 20% FCS (Hyclone). DiO cell-labeling solution (Invitrogen) was added to cell cultures 5ul/ml and incubated at 37°C for 30 minutes. Cultures were washed three times in PBS and fixed in 10% buffered formalin. Plates were imaged for DiO fluorescence (green) and Tomato fluorescent protein fluorescence on a Zeiss Lumar microscope. Fibroblast colony forming units were quantified based on a colony being the concentric organization of 25 cells or more.
FACS Isolation of BMSC Cultures
Day 5 stromal cell cultures were washed twice with PBS followed by digestion with 0.1% collagenase A, 0.1% hyaluronidase and 2%FBS in a 1:1 mixture of OPTI-MEM and PBS at 37°C for 10 minutes. Cells were then scraped and kept another 5 minutes at 37°C. A single cell suspension was obtained by gentle pipeting followed by running cells through a 40μm cell strainer. Cells were then centrifuged at 350g for 10 minutes and resuspended in 2% serum in a 1:1 mixture of OPTI-MEM and PBS. FACS isolation was carried out using a Vantage SE FACS sorter (BD Biosciences). Cells were collected in 20% serum in a 1:1 mixture of OPTI-MEM and PBS.
Passaging of BMSCs
Bone marrow cultures were grown for 5 days. For the first passage cultures were washed twice with PBS followed by digestion with 0.1% collagenase A, 0.1% hyaluronidase and 2%FBS in a 1:1 mixture of OPTI-MEM and PBS at 37°C for 10 minutes. Cells were then scraped and kept another 5 minutes at 37°C. 5×10⁵ unsorted cells were plated in 100mm dishes. Cells were grown in 10% FCS (Hyclone) in αMEM containing 100 U/ml Penicillin, 100 μg/ml streptomycin. For the second and third passages cells were washed with PBS followed by digestion with 0.05% Trypsin/EDTA solution. 5×10⁵ unsorted were passed on every third day two more times for a total of three passages.
Differentiation of BMSCs
After FACS, isolated cell populations were initially plated as a spot with~2×10⁴ cells in 20ul of medium (αMEM culture medium containing 100 U/ml Penicillin, 100 μg/ml streptomycin and 10% FCS (Hyclone)) for osteogenic and adipogenic differentiation and 2 × 10⁵ cells in 10ul of medium for chondrocyte differentiation. For the plating of spot cultures, cells were allowed to remain undisturbed for 2 hours while they attached to the plate and then additional medium was added very gently. On the second day of culture, the cells were switched to differentiation media. Osteogenic differentiation: cells were grown in αMEM medium with 10% FCS, 100u/ml penicillin, 100ug/ml streptomycin, 50ug/ml ascorbic acid, and 8mM 2-glycerol phosphate. Adipogenic differentiation: cells were cultured in αMEM medium containing 1.0uM insulin and 0.5uM rosiglitazone. Chondrogenic differentiation: cells were cultured in high-glucose DMEM supplemented with ITS+1, 50ug/ml ascorbic acid, 100ug/ml sodium pyruvate, 0.1uM dexamethasone, 100units/100ug penicillin/streptomycin, 40ug/ml L-proline and 10ng/ml TGF-β3 [17].
Histological Analysis of Differentiated BMSC cultures
Osteogenesis was assessed by von Kossa staining. In brief, cultures were washed with PBS, fixed in 10% formalin for 10–15 min, rinsed with water, incubated with 5% silver nitrate solution while cross-linking for 2 cycles @ 1200 mjoules × 100 in a UV Stratalinker (Stratagene, La Jolla, CA). Mineralized nodules were seen as dark brown or black spots. Adipogenesis was assayed by Oil Red-O staining. To stain for Oil Red-O, cultures were washed with PBS and fixed for 15 minutes at room temperature in 10% formalin. Cultures were then washed with water and allowed to air dry. Oil Red-O stock was diluted to 0.3%, subsequently filtered, added to the culture wells and allowed to incubate for one hour at room temperature. The stain was aspirated off and the cells were washed twice with water. Von Kossa and Oil Red-O cultures were counterstained with Mayer’s hematoxylin. Chondrogenesis was assayed by Alcian Blue staining. For Alcian Blue staining, cell cultures were fixed with 10% formalin containing 0.5% cetylpyridinium chloride(CPC) for 10 minutes and rinsed briefly in 3% glacial acetic acid, pH 1.0. Then cultures were histochemically monitored by staining with 1.0% Alcian blue, pH1.0, overnight. Excess stain was rinsed off by washing in 3% glacial acetic acid, pH 1.0, once and then twice with 3% glacial acetic acid, pH 2.5, as described previously [18]. Alcian blue stained cultures were counterstained with eosin Y.
Quantitative PCR
RNA was purified from tissue culture cells using a Nucleospin kit (Macherey-Nagel). RNA was transiently treated with DNAse to remove any possible genomic DNA contaminants followed by cDNA synthesis. Quantitative PCR was carried out using a QuantiTect SYBR Green PCR kit (Qiagen) according to the manufacturer’s instructions. Samples were run in a Biorad I-Cycler real time PCR machine under the following conditions: 95°C-15min; 95°C-30s, 55°C-30s, 72°C-30s for 40 cycles; PCR primers were used to amplify the following genes: Ibsp (sense) 5′-CGCCACACTTTCCACACTCTC-3′ Ibsp (antisense) 5′-CTTCCTCGTCGCTTTCCTTCAC-3′; Phex (sense) 5′-GCATGATTAACCAGTATAGCAA-3′, Phex (antisense) 5′-GGTCTATAGGAATTGCACCTTAC-3′; Bglap1 (sense) 5′-TCCAAGCAGGAGGGCAATAAG-3′, Bglap1(antisense) 5′-GCGTTTGTAGGCGGTCTTCAAG-3′; Dmp1 (sense) 5′-CGCATCCCAATATGAAGACTG-3′, Dmp1 (antisense) 5′-GCTTGACTTTCTTCTGATGACTCA-3′; Fabp4 (sense) 5′-GGGAACCTGGAAGCTTGTCTC-3′, Fabp4 (antisense) 5′-CTGCGGTGATTTCATCGAATTCCAC-3′; Adipsin (PrimerBank ID: 7304867a3) (sense) 5′-GCTATCCCAGAATGCCTCGTT-3′, Adipsin (antisense) 5′-GCGCAGATTGCAGGTTGTC-3′; Adiponectin (sense) 5′-CGTGATGGCAGAGATGGCACT-3′, Adiponectin (antisense) 5′-GCGAATGGGTACATTGGGAACAG-3′, Perilipin (PrimerBank ID: 28316726a2)(sense) 5′-AGATCCCGGCTCTTCAATACC -3′, Perilipin (antisense) 5′-AGAACCTTGTCAGAGGTGCTT-3′; Aggrecan (sense) 5′-CTATGAGGATGGCTTCCACCAGT-3′, Aggrecan (antisense) 5′-CCATCTCCTCAGCGAAGCAGT-3′; Col2a1 (sense) 5′-TCGCACTTGCCAAGACCTGAA-3′, Col2a1 (antisense) 5′-GGTCTCTCCAAACCAGATGTG-3′; ColX (sense) 5′-GCTGCCTCAAATACCCTTTCTG-3′, ColX (antisense) 5′-GGACCAGGAATGCCTTGTTCT-3′; Sox9 (PrimerBank ID:31543761a1) (sense) 5- GAGCCGGATCTGAAGAGGGA-3′, Sox9 (antisense) 5′-GCTTGACGTGTGGCTTGTTC-3′; Hprt (sense) 5′-CACAGGACTAGAACACCTGC-3′, Hprt (antisense) 5′-GCTGGTGAAAAGGACCTCT-3′. Hprt was used as a normalization control. Gene expression was also carried out on a PCR mesenchymal stem cell array (SA Biosciences). For the PCR array, cDNA and the qPCR reaction mixture was generated in the same manner as describe above. Samples were run in a Biorad I-Cycler real time PCR machine at the following conditions: 95°C-15min; 95°C-30s, 60°C-30s, 72°C-30s for 40 cycles.
FACS Analysis of Day 5 Stromal Cell Cultures
Bone marrow stromal cell cultures were derived from wild type CD-1 mice and Twist2-Cre x Z/EG matings and grown as described above. At day 5 of culture, cells were brought into a single cell suspension as described above. For cell surface profiling, cells were initially blocked in staining media (1X Hank’s Balanced Salt Solution, 10mM HEPES pH 7.2, 2% FCS, and 0.5% mouse IgG) followed by incubation with the following antibodies diluted in staining media: APC-CD45 (1:50), APC-CD117 (1:800), APC-SCA1 (1:200), PE-TIE2 (1:50), PE-CD29 (1:50), PB-TER119 (1:50) (all antibodies were obtained from E-Bioscience). Cell surface profiling was carried out with three distinct bioreplicates.
Transplantation of T2C cells into Parietal Bone Defect Model
Before transplantation, the recipient mice underwent total body gamma irradiation with 137Cs (Nordion Gammacell 40 Irradiator) to overcome immune rejection problems. A dose of 9.0 Gy (900rads) was used to ablate the bone marrow. Within 24 hours after irradiation, the mice received a bone marrow donation from non-transgenic CD1 mice. A volume of 0.10 ml with 5×10⁶ cells was introduced into the retro-orbital sinus. Recipients were anesthetized with Ketamine 135 mg/kg/Xylazine 15 mg/kg by intraperitoneal injection before transplantation and administered Buprenex analgesia with 0.08 mg/kg Buprenorphine by subcutaneous injection after implantation. The surgical site was cleaned with 75% ethanol and an incision was made just off the sagittal midline to expose the right parietal bone. The pericranium was removed and 4mm defects were made in the right non-suture associated parietal bone using a trephine drill. The calvarial disk was removed carefully in order to avoid injury to the underlying dura mater. Cells were pipetted onto a collagen cross-linked hydroxyapaptite coated scaffold (Healos, DePuy Orthopaedics) in the amounts specified. After placement of the scaffold into the defect, the skin was sutured closed and the animal was monitored. Two days before harvesting tissue, mice were injected intraperitoneal with xylenol orange (0.09mg/gm body weight).
Analysis of the Post-Transplantation Defect Area
Samples were harvested 30 days after surgical implantation. Calvaria were fixed in 10% formalin for 4 days at 4 °C. Calvaria were X-rayed at 28 kVp for 4 s using a Faxitron. Xylenol orange incorporation into newly formed bone was imaged by fluorescence detection using an IVIS Spectrum (Caliper Life Sciences). Samples were then embedded, frozen sectioned (5 μm), and imaged using a Zeiss Observer-Z1 microscope. For brightfield imaging, sections were initially imaged under DIC optics followed by decalcification of sections with a 14% EDTA solution followed by counterstaining with Mayer’s hematoxylin.
Results
Bone Marrow Derived fromTwist2-Cre/Cre Reporter Mice Marks an Early Fluorescent Protein+ Stromal Cell Population
Given the early roles Twist genes have during embryonic skeletal development, we speculated that Twist2-Cre mice could be utilized in conjunction with Cre reporter mice to mark the earliest osteoprogenitor cell types flushed from the bone marrow when preparing stromal cell cultures. Therefore, we decided to cross Twist2-Cre mice with Cre reporter mice that express a fluorescent protein upon Cre mediated excision of a stop sequence and use FACS as a means to isolate this fluorescent cell population and study its biology. Our initial studies utilized a Z/EG Cre reporter line, which conditionally expressed EGFP [19]. However, our more recent work has also utilized the Ai9 Cre reporter line, which conditionally expresses tomato fluorescent protein [20]. Both Z/EG and Ai9 Cre reporter mouse lines yielded comparable results, with the Ai9 reporter being much easier to detect and visualize. Bone marrow stromal cell cultures derived from Twist2-Cre X Z/EG (Fig. 1A–C) and Twist2-Cre X Ai9 (Fig. 1D–F) offspring were plated at non-clonal densities (3×10⁶ cells/cm2) and resulted in the appearance of an adherent fluorescent protein+ cell population (here after referred to as T2C+) that attached and proliferated over the earliest stages of stromal cell culture. By day 5 of stromal cell culture, the majority of T2C+ cells were associated with colony forming units, but clearly marked a subpopulation of cells within the colony. FACS analysis of these day 5 cultures indicated that T2C+ cells represent ~20% of the total cell population (Fig. 1G and H).
Figure 1.

Bone marrow stromal cell cultures derived from Twist2-Cre; Cre reporter mice. (A–H) Stromal cell cultures plated at high non-clonal densities. (A–C) Imaging of a developing stromal cell colony derived from Twist2-Cre; Z/EG mice at day 5 of stromal cell culture. (D–E) Imaging of a developing stromal cell colony derived from Twist2-Cre; Ai9 mice at day 5 of stromal cell culture. (A,D) Detection of fluorescent protein reporter expression. (B,E) Phase contrast imaging of the same respective colonies. (C,F) Overlay of fluorescent and phase images. Overlay images reveal that fluorescent protein marked cells represent a small subset of the total cell population. (G,H) FACS analysis of T2C+ cells from day 5 stromal cell cultures. T2C+ cells represent ~20% of the total cell population. (I,J) Stromal cell cultures were plated at low clonal densities to carryout CFU-F assays. DiO was used to label the total cell population (J). Plates were scanned for Ai9 reporter activity and DiO fluorescence to quantify CFU-Fs. 82% of CFU-Fs were T2C+.
When BMSCs are plated at low cell densities they can form fibroblast colony forming units (CFU-Fs) generally thought to be derived from a single cell. Past work has shown that different in bred strains of mice can vary as much as 10 fold in their ability to generate CFU-Fs with C57Bl/6 and 129 mouse strains forming CFU-Fs with low efficiency [21]. Consistent with these studies, our mouse BMSCs, derived from Twist2-Cre X Ai9 offspring (mixed genetic background CD/1-129-C57Bl/6) also formed CFU-Fs with low efficiency (~11.25 CFU-Fs/100mm dish). Never the less, scanning of tissue culture plates for CFU-Fs (all colonies were labeled with DiO) revealed that 82% of all colonies were T2C+ (Fig. 1I and J).
Gene Expression Profiling of T2C+ Cells
A common practice has been to characterize BMSCs by FACS analysis using antibodies raised against a wide breath of cell surface markers. While it is recognized that no one cell surface marker uniquely identifies mouse BMSCs, collectively different cell surface markers do re-enforce the identity of different cell populations. We carried out FACS analysis on day 5 of stromal cell cultures comparing T2C+ cells to T2C- cells (Fig. 2A and B). In our analysis, a very high percentage of T2C+ cells were SCA1 positive (93.5%) and CD29 (β1-Integrin) positive (80%). T2C+ cells were largely negative for hematopoietic derivatives and endothelial cell markers, CD45, CD117, TIE2, and TER119. In contrast, T2C- cells were nearly all hematopoietic in origin being 90.8% positive for CD45 and having a roughly equivalent distribution (45–50% positive) for CD117, SCA1, TIE2, CD29, and TER119. Recent studies have also identified CD146/MCAM as another useful marker to identify human BMSCs [22]. Unfortunately, in our hands this monoclonal antibody (clone:P1H12) raised against human CD146 did not work and information provided by various manufacturers for this hybridoma lacks consistency in terms of determining whether this clone can detect CD146 across species or is restricted to human cells.
Figure 2.

Cell surface profiling of Day 5 Stromal Cell Cultures Derived from Twist2-Cre; Z/EG transgenic mice. (A) T2C+ cells were 93.5% positive for SCA1 and 80% positive for CD29 with other hematopoietic markers being <20%. (B) In contrast, T2C- cells were 90.8% positive for CD45 suggesting they are hematopoietic in origin.
To further define the T2C+ cell population, we carried out a mesenchymal stem cell PCR array comparing T2C+ cells to T2C- cells. Many previously described cell surface markers for BMSCs were detected in T2C+ cells including CD44, Alcam, and CD105 (data not shown). However, many of these markers were not enriched in T2C+ cells and therefore, fold differences between positive and negative populations did not reach significance. Gene markers that were enriched in the PCR array are shown in Table 1. Many of these genes have been previously been shown to be expressed in BMSCs including Mmp2, Tgfβ3, Col1a1, Nestin, Fgf2 and Bmp4 [23]. While not so surprising, gene expression profiling of T2C- cells further substantiated our FACS analysis studies suggesting that this cell population is largely hematopoietic in origin. Expression of inflammatory cytokine genes Il1β and Tnfα were both highly enriched in the negative cell population along with the hematopoietic cell surface marker, CD45.
Table 1.
PCR Array Gene Expression Profile Comparison of T2C Positive and Negative Cell Types.
| RefSeq | Symbol | Description | P- Value | Fold Δ |
|---|---|---|---|---|
| NM_008610 | Mmp2 | Matrix metallopeptidase 2 | 0.00011 | 9.99 |
| NM_001003817 | Erbb2 | V-erb-b2 erythroblastic leukemia viral oncogene homolog 2 | 0.00039 | 9.65 |
| NM_009368 | Tgfb3 | Transforming growth factor, beta 3 | 0.00315 | 9.65 |
| NM_007742 | Col1a1 | Collagen, type I, alpha 1 | 0.00284 | 9.32 |
| NM_008809 | Pdgfrb | Platelet derived growth factor receptor, beta polypeptide | 0.00035 | 9.00 |
| NM_016701 | Nes | Nestin | 0.00045 | 8.40 |
| NM_007982 | Ptk2 | PTK2 protein tyrosine kinase 2 | 0.00066 | 7.31 |
| NM_008006 | Fgf2 | Fibroblast growth factor 2 | 0.00138 | 5.74 |
| NM_031168 | Il6 | Interleukin 6 | 0.00111 | 5.54 |
| NM_007554 | Bmp4 | Bone morphogenetic protein 4 | 0.01061 | 5.26 |
| NM_021334 | Itgax | Integrin alpha X | 0.00653 | −11.75 |
| NM_008361 | Il1b | Interleukin 1 beta | 0.00015 | −10.59 |
| NM_008935 | Prom1 | Prominin 1 | 0.01239 | −7.49 |
| NM_011210 | Ptprc (CD45) | Protein tyrosine phosphatase, receptor type, C | 0.00086 | −7.36 |
| NM_013693 | Tnf | Tumor necrosis factor | 0.00499 | −6.99 |
Re-culturing T2C+ Cells in a Confluent Spot
Previous work has reported that mouse BMSCs have a limited proliferative capacity [7]. Consistent with this report, the re-culturing of FACS isolated T2C+ cells at various sub-confluent densities was problematic. However, observations of mouse stromal cell cultures also reveal that cell proliferation is generally slow until the initial onset of colony formation, after which cell division within the colony forming unit is extremely rapid. With this in mind, we decided to re-create the colony environment by replating FACS isolated T2C+ cells in a confluent spot, where 20,000 sorted cells were initially plated within a 20 μL volume of media. Using this culturing strategy, T2C+ cells isolated from day five stromal cell cultures adhere to the tissue culture plastic within 1 to 2 hours, maintain their mesenchymal cell morphology, and continue to proliferate rapidly. This re-culturing strategy has allowed us to conservatively use FACS isolated T2C+ cells to assess their differentiation potential.
T2C+ Cells are Multipotent
To determine the multipotent nature of T2C+ cells, we differentiated them under osteogenic, adipogenic, and chondrogenic culture conditions. Under all three culturing regimens, isolated T2C+ cells were capable of differentiating into osteoblasts (Fig. 3A–G), adipocytes (Fig. 3H–N), and chondrocytes (Fig. O–U) where as T2C- cells retained no skeletal potential (data not shown). We confirmed the T2C+ cellular origin of these differentiated cell types by imaging Ai9 tomato reporter fluorescence (Fig. 3A,D,H,K,O, and R), which serves as a historical marker.
Figure 3.

In vitro differentiation of T2C+ cells provide evidence for their multipotent skeletal potential. T2C+ were FACS isolated from day 5 stromal cells, replated as a confluent spot, and directed to differentiate down the osteoblast (A–C, & G), adipocyte (H–I, & N), and chondrocyte (O–Q, & U) cell lineages. Control cultures were also carried out, where T2C+ cells were plated as a confluent spot, but not grown in differentiation media (D–F, K–M, R–T). Ai9 reporter fluorescence was imaged to confirm the contribution of T2C+ to all three skeletal lineages (A,D,H,K,O,R). Histological staining was used to assess differentiation, von Kossa for osteogenesis (C,F), oil red-o for adipogenesis (J,M), and Alcian blue for chondrogenesis (Q,T). Histological staining was observed in differentiated cultures (C,J,Q), but not in control cultures (F, M, T). Differentiation could also be observed under DIC optics where matrix deposition was observed under osteogenic differentiation (B), large lipid vesicles were apparent in adipocytes (I), and cellular condensations were observed during chondrogenic differentiation (P). Differentiation was also assessed by quantitative PCR (G, N, & U) where undifferentiated T2C+ sorted cells (white bars) were compared to differentiated T2C+ derived cultures (black bars). (G) For osteogenic differentiation quantitative PCR was carried out for Ibsp, Phex, Bglap1, and Dmp1. (N) For adipogenic differentiation quantitative PCR was carried out for Fabp4, Adipsin, Adiponectin, and Perilipin. (U) For chondrogenic differentiation quantitative PCR was carried out for Aggrecan, Col2a1, ColX, and Sox9. Under each differentiation condition substantial increases in gene marker expression were detected providing evidence for successful differentiation down all three lineages.
For these in vitro studies, we assessed differentiation in multiple ways. First, we utilized common histological staining methods: Von Kossa for bone, Oil Red-O for fat, and Alcian Blue for cartilage. To provide evidence for the selective nature of these histological stains, in addition to the three cell culture differentiation conditions (Fig. 3A–C for bone, H–J for fat, and O–Q for cartilage), in parallel we also maintained T2C+ cells under non-differentiation conditions (Fig. 3D–F, K–M, and R–T) and carried out histological staining for both cultures at the same time. Only differentiated cultures showed appropriate histological staining.
The second manner in which differentiation was easy to assess was based upon observing cells in culture under DIC optics. T2C+ cells grown under osteogenic conditions had considerable matrix deposition which could be easily visualized (Fig. 3, compare B to E). During adipocyte differentiation, large and small lipid vesicles could be seen in differentiated adipocytes (Fig. 3, compare I to L). Also, during chondrocyte differentiation cellular condensations could be observed (Fig. 3, compare P to S).
The third manner in which we assessed in vitro differentiation was by carrying out gene expression studies where we compared the expression level of known osteoblast, adipocyte, and chondrocyte marker genes in day 5 undifferentiated FACS isolated T2C+ cells to fully differentiated T2C+ derived cultures (Fig. 3G, N, and U). Increases in osteoblast and osteocyte gene markers were ~68 fold for Bone sialoprotein (Ibsp), ~85 fold for Phosphate regulating endopeptidase homolog X linked (Phex), ~265 fold for Osteocalcin (Bgalp1) and ~550 fold Dentin matrix protein 1 (Dmp1) (Fig. 3G). Increases in adipocyte gene markers were ~30 fold for Fatty acid binding protein 4 (Fabp4), ~194 fold for Adipsin, ~432 fold for Adiponectin, and ~379 fold for Perilipin (Fig. 3N). Increases in chondrocyte gene markers were ~1320 fold for Aggrecan, ~171 fold for Collagen type 2 alpha 1 (Col2a1), ~187 fold for Collagen type 10 (ColX), and ~19 fold for Sox9 (Fig. 3U). Collectively, these in vitro differentiation studies provide evidence that T2C+ cells derived from day 5 stromal cell cultures are a multipotent cell population.
Mouse BMSCs Rapidly Lose Skeletal Potential
There is a general recognition that the length of time BMSCs are maintained in culture is inversely proportional to their skeletal potential. Review of the literature and our own experience suggests that there is considerably variation between species with regard to the extent by which BMSCs can be expanded while maintaining skeletal potential. For example, human BMSCs are routinely passaged 3–7 times with apparently only a gradual loss in skeletal potential. Therefore, we decided to test how well mouse BMSCs retain their skeletal potential. We compared the multipotency of sorted T2C+ cells from day 5 stromal cell cultures to passed BMSCs by differentiating them under osteogenic, adipogenic and chondrogenic conditions (Fig. 4). We assessed differentiation using histological assays: Von Kossa for bone (Fig. 4, AD), Oil Red-O for fat (Fig. 4, E–H), and Alcian blue for cartilage (Fig. 4, I–L). Both T2C+ sorted cells (Fig. 4A, E, I) and passage 1 unsorted cells (Fig. 4B, F, J) retained skeletal potential with T2C+ sorted cells generally having better osteoblast and chondrocyte differentiation relative to the unsorted cell population. Greater disparity in the performance of sorted versus unsorted cultures was observed for chondrocyte cultures, which require 10X more cells for differentiation. Thus, enrichment of BMSCs by sorting was particularly beneficial in situations where more cells were required. By passage 2 (Fig. 4, C, G, K), the potential to differentiate into osteoblasts and chondrocytes was gone, while adipocyte potential remained. By passage 3 (Fig. 4. D, H, L), histological evaluation indicated that skeletal potential was essentially lost for all three lineages. While the culturing of BMSCs is an evolving science, when maintained in 10% fetal calf serum in αMEM media, mouse BMSCs rapidly changed in culture and lost their multipotency. The rapid loss of skeletal potential highlights the need to isolate and study mouse BMSCs as early as possible to better understand the molecular pathways and genes that contribute to their multipotency.
Figure 4.
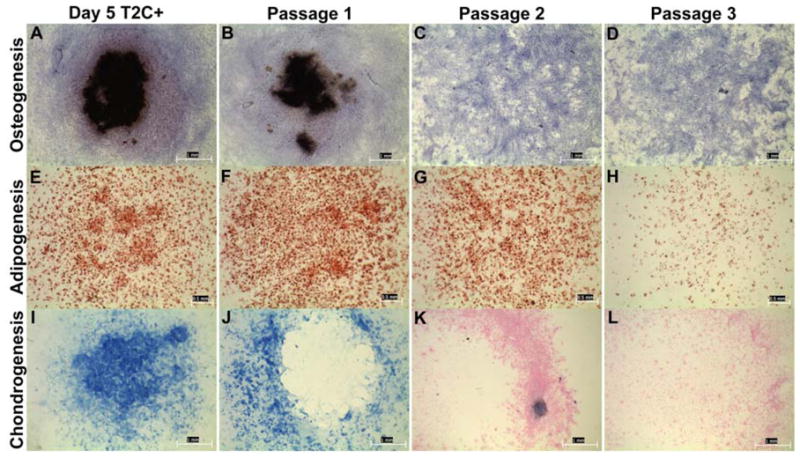
BMSCs rapidly lose skeletal potential. The ability of BMSCs to retain multi-lineage skeletal potential over consecutive passages was tested by comparing sorted T2C+ cells from day 5 stromal cell cultures to unsorted passaged BMSCs. Differentiation was assess using histological staining methods: von Kossa for osteogenesis (A–D), Oil Red-O for adipogenesis (E–H), and Alcian blue for Chondrogenesis (I–L). Day 5 T2C+ sorted cells (A, E, I) and passage 1 unsorted BMSCs (B, F,J) retained skeletal potential for all three lineages. By passage 2 (C, G, K) osteoblast and chondrocyte skeletal potential were lost, while adipocyte potential was maintained. By passage 3 (D, H, L), the skeletal potential for all three lineages was lost.
T2C+ Cells Contribute to Osteogenic Repair
To determine the therapeutic repair potential of T2C+ cells, transplantation studies were carried out using a parietal bone defect model. A circular 4mm diameter size defect was created in the parietal bone and treated with either Healos, a collagen cross-linked hydroxyapatite coated scaffold, Healos + 100,000 T2C- cells, Healos +50,000 T2C+ cells, or Healos +300,000 T2C + cells (Fig. 5, A–C). Whole tissue examination of the defect area (Fig. 5A) 30 days after transplantation revealed that T2C+ cells contributed to osteogenic repair in a dosage dependent manner, where 50,000 T2C+ cells and 300,000 T2C+ cells resulted in increased detection of fluorescence emitted by xylenol orange, an orange-red fluorescent dye which is incorporated into newly formed bone (Fig. 5A). In the same areas of xylenol orange incorporation, bone mineral density appeared greater as revealed by X-ray (Fig. 5A). In contrast, Healos scaffold and Healos +100000 T2C- cells resulted in no xylenol orange incorporation and no areas of increased mineral density (Fig. 5A). To further clarify the outcome of this transplantation study, histological sections through the defect area were examined (Fig. 5B & C). Fluorescent imaging at low magnification (Fig. 5B), detects the autofluorescence of the Healos scaffold (appearing as brighter green, greenish-yellow pieces) scattered throughout the defect area in all treatments except for Healos +300000 T2C+ cells. Consistent with whole tissue analysis, xylenol orange incorporation was detected in the repair area only when T2C+ cells were transplanted (Fig. 5B, white arrows). Moreover, the transplantation of 300,000 T2C+ cells not only formed new bone, but supported the creation of a marrow space (Fig. 5B, yellow asterisk) and appeared to conform to a shape comparable to the host parietal bone. Brightfield imaging at low and high magnification (Fig. 5C) also showed no bone formation in the defect area in Healos or Healos +100,000 T2C- cells, despite the presence of cells, blood vessels, and pieces of unresorbed scaffold. However, transplantation of T2C+ cells resulted in dosage dependent amount of bone formation. Transplantation of 50,000 T2C+ cells produced a small region of bone at the bottom of the defect area and transplantation of 300,000 T2C+ cells resulted in new bone formation across the defect. At high magnification osteocytes can be observed in newly formed bone (Fig. 5C, bottom right). Imaging of Z/EG reporter expression (Fig. 5D) in samples transplanted with 300,000 T2C+ cells showed EGFP+ cuboidal osteoblasts on the bone surface above the xylenol orange label and EGFP+ osteocytes embedded in bone; thus verifying the direct contribution of T2C+ cells to newly formed bone.
Figure 5.

T2C+ cells contribute to osteogenic repair. The osteogenic repair potential of T2C+ cells was tested in a parietal bone defect model. (A–C) T2C+ cells were compared to the Healos scaffold, Healos seeded with 100,000 T2C- cells or Healos seeded with 50,000 and 300,000 T2C+ cells. 30 days after transplantation, osteogenic repair was assessed by whole tissue imaging (A) and visualization of the defect area in tissue sections (B and C). (A) Whole tissue detection of xylenol orange fluorescence can only be seen in the repair region when T2C+ cells were transplanted. In these same regions of xylenol orange detection, x-ray imaging reveals increased radiodensity relative to the Healos. (B) Consistent with whole mount imaging, xylenol orange detection could only be visualized in tissue sections through the defect area in mice where T2C+ cells were transplanted (white arrows). In the absence of T2C+ cells, green and yellow autofluorescent fragments of Healos are scattered throughout the defect area. (C) Tissue sections through the defect area were also imaged under DIC optics (left side) and hematoxylin counterstained sections (middle and right side- high magnification of black boxed inset). Newly formed bone is observed in T2C+ transplanted samples with 50,000 T2C+ cells resulting in a region of new bone that formed at the bottom of the defect area and 300,000 T2C+ cells that formed new bone across the defect area. At high magnification (C, right panel of images) osteocytes can be seen in the bone of T2C+ transplanted samples. In Healos or 100,000 T2C- cells + Healos the defect area is full of cells and blood vessels and fragments of unresorbed scaffold, but no bone is present. (D) The direct cellular contribution of T2C+ cells to bone was confirmed by imaging Z/EG reporter expression where EGFP+ cells can be observed in osteoblasts lining the bone surface and osteocytes within the bone. This is appreciated in an overlay view of bone mineral by DIC imaging along xylenol orange labeling (right image).
Discussion
In this report, we provided evidence for a transgenic approach that allowed for the isolation of mouse BMSCs from the much greater hematopoietic cellular fraction by crossing Twist2-Cre transgenic mice with the Cre reporter mice, Z/EG or Ai9. The rationale for choosing Twist2-Cre mice largely had to do with the expression pattern and proposed functional role for Twist genes during embryonic skeletal development. Twist1 and Twist2 are expressed at very early stages of skeletal development in osteochondral progenitor cells and function as important regulators of skeletal formation [16, 24]. Moreover, Twist genes are known to promote mesenchymal cell morphology [15, 16, 25] and possibly may contribute to the morphology of BMSCs. Recent work in human BMSCs has provided evidence that Twist genes are expressed in the high Stro-1 cell fraction and their over expression enhances BMSC cell proliferation [26].
Previous studies provided an initial characterization of Twist2-Cre transgenic mice by crossing them with the Rosa R26R Cre reporter mice, which results in β-galactosidase expression in response to Cre recombinase activity [27]. These studies reveal a rather broad expression of Cre recombinase activity largely limited to a subset of mesodermal tissues including the condensing mesenchyme of the limb bud, which are precursors to bone and cartilage. Despite the broad expression of Cre in this animal model, hematopoietic cells in the bone marrow compartment remained negative for β-galactosidase staining [27]. Given these particular attributes of the Twist2-Cre mice, we speculated that it may be a useful animal model to mark BMSCs and thus pursued a line of research investigating this possibility.
Collectively, our work revealed that bone marrow stromal cell cultures derived from Twist2-Cre/+; Cre reporter mice resulted in the identification of a fluorescent protein+ cell population (T2C+ cells) that retained characteristics of BMSCs. When plated at high non-clonal densities, T2C+ cells represented a subset of cells within the colony forming unit that by day 5 of culture were ~20% of the total adherent cell population. Cell surface profiling and gene expression studies were carried out to further define the T2C+ cell population in contrast to the negative cell population. Consistent with other studies to profile BMSCs [4, 7, 9, 28], T2C+ cells were negative for hematopoietic cell surface markers, but positive for markers such as SCA1 and CD29. Additionally, gene expression studies using a mesenchymal stem cell PCR microarray identified several genes that have been shown by other groups to be selectively expressed in BMSCs [23]. Not surprisingly, our FACS analysis and gene expression studies defined the fluorescent protein negative cell population, which represented ~80% of the total cell population in day 5 stromal cell cultures as hematopoietic in origin being >90% positive for CD45.
We also carried out in vitro differentiation studies and transplantation studies to further characterize the T2C+ cell population. T2C+ cells retained skeletal potential for at least three different lineages, osteoblast, adipocyte, and chondrocyte. Furthermore, T2C+ cells effectively contributed to osteogenic repair in an in vivo parietal bone defect model. These transplantation studies also revealed that T2C+ cells supported the creation of a hematopoietic environment, another characteristic attribute of BMSCs [29].
Our studies also showed that the skeletal potential of mouse BMSCs is rapidly lost upon passaging. This is in contrast to human BMSCs research, where BMSCs are routinely passed multiple times. Another distinction between mouse and human BMSCs relates to differences in proliferation with human BMSCs growing substantially better than mouse. Whether derived from human or mouse, the culturing of BMSCs is an evolving science and defining the optimal conditions to culture mouse BMSCs, while important, remains out of the scope of this study. Work by others have augmented BMSC proliferation in the presence of growth factors or by culturing in a low oxygen environment [21, 22, 30, 31]. However, it is unclear to what extent skeletal potential is maintained under these various conditions.
The mouse remains a cornerstone animal model for skeletal biology studies and has much to offer the field of BMSCs. The isolation and study of murine BMSCs has made real progress in recent years. However, given the lack of cell surface markers to selectively isolate mouse BMSCs, alternative approaches such as immunodepletion have been cleverly devised to enrich for BMSCs [7]. In this study, we have developed a positive selection scheme to identify mouse BMSCs involving Twist2-Cre transgenic mice. It is our hope that these new methodologies to identify BMSCs may provide an alternative to existing approaches and allow for a better understanding of how to work with BMSCs for therapeutic benefit.
Acknowledgments
We would like to thank Dr. David M. Ornitz for sending us Twist2 Cre transgenic mice and Diane Gran from the UCHC Flow Cytometry Facility for her excellent technical assistance. This research was funded in by T32 and U24 grants from the NIDCR and an R01AR043457 from NIAMS.
Footnotes
Disclaimers: None
Author Contribution Summary:
Yaling Liu: Collection and Assembly of Data
Liping Wang: Collection and Assembly of Data
Reze Fatahi: Collection and Assembly of Data
Mark Kronenberg: Experimental Support
Ivo Kalajzic: Experimental Support
David Rowe: Financial Support
Yingcui Li: Collection and Assembly of Data
Peter Maye: Conception and Design, Financial Support, Manuscript Writing, Final Approval of manuscript
Publisher's Disclaimer: This is a PDF file of an unedited manuscript that has been accepted for publication. As a service to our customers we are providing this early version of the manuscript. The manuscript will undergo copyediting, typesetting, and review of the resulting proof before it is published in its final citable form. Please note that during the production process errors may be discovered which could affect the content, and all legal disclaimers that apply to the journal pertain.
References
- 1.Friedenstein AJ, Piatetzky S, II, Petrakova KV. Osteogenesis in transplants of bone marrow cells. Journal of embryology and experimental morphology. 1966;16:381–390. [PubMed] [Google Scholar]
- 2.Friedenstein AJ, Chailakhjan RK, Lalykina KS. The development of fibroblast colonies in monolayer cultures of guinea-pig bone marrow and spleen cells. Cell and tissue kinetics. 1970;3:393–403. doi: 10.1111/j.1365-2184.1970.tb00347.x. [DOI] [PubMed] [Google Scholar]
- 3.Bruder SP, Fink DJ, Caplan AI. Mesenchymal stem cells in bone development, bone repair, and skeletal regeneration therapy. Journal of cellular biochemistry. 1994;56:283–294. doi: 10.1002/jcb.240560809. [DOI] [PMC free article] [PubMed] [Google Scholar]
- 4.Krebsbach PH, Kuznetsov SA, Bianco P, et al. Bone marrow stromal cells: characterization and clinical application. Crit Rev Oral Biol Med. 1999;10:165–181. doi: 10.1177/10454411990100020401. [DOI] [PubMed] [Google Scholar]
- 5.Pittenger MF, Mackay AM, Beck SC, et al. Science. Vol. 284. New York, N.Y.: 1999. Multilineage potential of adult human mesenchymal stem cells; pp. 143–147. [DOI] [PubMed] [Google Scholar]
- 6.Caterson EJ, Nesti LJ, Danielson KG, et al. Human marrow-derived mesenchymal progenitor cells: isolation, culture expansion, and analysis of differentiation. Molecular biotechnology. 2002;20:245–256. doi: 10.1385/MB:20:3:245. [DOI] [PubMed] [Google Scholar]
- 7.Baddoo M, Hill K, Wilkinson R, et al. Characterization of mesenchymal stem cells isolated from murine bone marrow by negative selection. Journal of cellular biochemistry. 2003;89:1235–1249. doi: 10.1002/jcb.10594. [DOI] [PubMed] [Google Scholar]
- 8.Tuli R, Tuli S, Nandi S, et al. Stem cells. Vol. 21. Dayton, Ohio: 2003. Characterization of multipotential mesenchymal progenitor cells derived from human trabecular bone; pp. 681–693. [DOI] [PubMed] [Google Scholar]
- 9.Gronthos S, Zannettino AC, Hay SJ, et al. Molecular and cellular characterisation of highly purified stromal stem cells derived from human bone marrow. Journal of cell science. 2003;116:1827–1835. doi: 10.1242/jcs.00369. [DOI] [PubMed] [Google Scholar]
- 10.Gronthos S, Graves SE, Ohta S, et al. The STRO-1+ fraction of adult human bone marrow contains the osteogenic precursors. Blood. 1994;84:4164–4173. [PubMed] [Google Scholar]
- 11.Dennis JE, Carbillet JP, Caplan AI, et al. The STRO-1+ marrow cell population is multipotential. Cells, tissues, organs. 2002;170:73–82. doi: 10.1159/000046182. [DOI] [PubMed] [Google Scholar]
- 12.Lee MS, Lowe GN, Strong DD, et al. TWIST, a basic helix-loop-helix transcription factor, can regulate the human osteogenic lineage. Journal of cellular biochemistry. 1999;75:566–577. doi: 10.1002/(sici)1097-4644(19991215)75:4<566::aid-jcb3>3.0.co;2-0. [DOI] [PubMed] [Google Scholar]
- 13.Tamura M, Noda M. Identification of DERMO-1 as a member of helix-loop-helix type transcription factors expressed in osteoblastic cells. Journal of cellular biochemistry. 1999;72:167–176. doi: 10.1002/(sici)1097-4644(19990201)72:2<167::aid-jcb1>3.0.co;2-3. [DOI] [PubMed] [Google Scholar]
- 14.Bialek P, Kern B, Yang X, et al. A twist code determines the onset of osteoblast differentiation. Developmental cell. 2004;6:423–435. doi: 10.1016/s1534-5807(04)00058-9. [DOI] [PubMed] [Google Scholar]
- 15.Karreth F, Tuveson DA. Twist induces an epithelial-mesenchymal transition to facilitate tumor metastasis. Cancer biology & therapy. 2004;3:1058–1059. doi: 10.4161/cbt.3.11.1302. [DOI] [PubMed] [Google Scholar]
- 16.Yang J, Mani SA, Donaher JL, et al. Twist, a master regulator of morphogenesis, plays an essential role in tumor metastasis. Cell. 2004;117:927–939. doi: 10.1016/j.cell.2004.06.006. [DOI] [PubMed] [Google Scholar]
- 17.Tuli R, Tuli S, Nandi S, et al. Transforming growth factor-beta-mediated chondrogenesis of human mesenchymal progenitor cells involves N-cadherin and mitogen-activated protein kinase and Wnt signaling crosstalk. The Journal of biological chemistry. 2003;278:41227–41236. doi: 10.1074/jbc.M305312200. [DOI] [PubMed] [Google Scholar]
- 18.Li Y, Toole BP, Dealy CN, et al. Hyaluronan in limb morphogenesis. Developmental biology. 2007;305:411–420. doi: 10.1016/j.ydbio.2007.02.023. [DOI] [PMC free article] [PubMed] [Google Scholar]
- 19.Novak A, Guo C, Yang W, et al. Z/EG, a double reporter mouse line that expresses enhanced green fluorescent protein upon Cre-mediated excision. Genesis. 2000;28:147–155. [PubMed] [Google Scholar]
- 20.Madisen L, Zwingman TA, Sunkin SM, et al. A robust and high-throughput Cre reporting and characterization system for the whole mouse brain. Nature neuroscience. 2010;13:133–140. doi: 10.1038/nn.2467. [DOI] [PMC free article] [PubMed] [Google Scholar]
- 21.Phinney DG, Kopen G, Isaacson RL, et al. Plastic adherent stromal cells from the bone marrow of commonly used strains of inbred mice: variations in yield, growth, and differentiation. Journal of cellular biochemistry. 1999;72:570–585. [PubMed] [Google Scholar]
- 22.Sacchetti B, Funari A, Michienzi S, et al. Self-renewing osteoprogenitors in bone marrow sinusoids can organize a hematopoietic microenvironment. Cell. 2007;131:324–336. doi: 10.1016/j.cell.2007.08.025. [DOI] [PubMed] [Google Scholar]
- 23.Phinney DG, Hill K, Michelson C, et al. Stem cells. Vol. 24. Dayton, Ohio: 2006. Biological activities encoded by the murine mesenchymal stem cell transcriptome provide a basis for their developmental potential and broad therapeutic efficacy; pp. 186–198. [DOI] [PubMed] [Google Scholar]
- 24.Kronenberg HM. Twist genes regulate Runx2 and bone formation. Developmental cell. 2004;6:317–318. doi: 10.1016/s1534-5807(04)00069-3. [DOI] [PubMed] [Google Scholar]
- 25.Kang Y, Massague J. Epithelial-mesenchymal transitions: twist in development and metastasis. Cell. 2004;118:277–279. doi: 10.1016/j.cell.2004.07.011. [DOI] [PubMed] [Google Scholar]
- 26.Isenmann S, Arthur A, Zannettino AC, et al. Stem cells. Vol. 27. Dayton, Ohio: 2009. TWIST family of basic helix-loop-helix transcription factors mediate human mesenchymal stem cell growth and commitment; pp. 2457–2468. [DOI] [PubMed] [Google Scholar]
- 27.Yu K, Xu J, Liu Z, et al. Development. Vol. 130. Cambridge, England: 2003. Conditional inactivation of FGF receptor 2 reveals an essential role for FGF signaling in the regulation of osteoblast function and bone growth; pp. 3063–3074. [DOI] [PubMed] [Google Scholar]
- 28.Phinney DG. Methods in molecular biology. Vol. 449. Clifton, N.J.: 2008. Isolation of mesenchymal stem cells from murine bone marrow by immunodepletion; pp. 171–186. [DOI] [PubMed] [Google Scholar]
- 29.Friedenstein AJ, Chailakhyan RK, Latsinik NV, et al. Stromal cells responsible for transferring the microenvironment of the hemopoietic tissues. Cloning in vitro and retransplantation in vivo. Transplantation. 1974;17:331–340. doi: 10.1097/00007890-197404000-00001. [DOI] [PubMed] [Google Scholar]
- 30.Lennon DP, Edmison JM, Caplan AI. Cultivation of rat marrow-derived mesenchymal stem cells in reduced oxygen tension: effects on in vitro and in vivo osteochondrogenesis. Journal of cellular physiology. 2001;187:345–355. doi: 10.1002/jcp.1081. [DOI] [PubMed] [Google Scholar]
- 31.Short BJ, Brouard N, Simmons PJ. Methods in molecular biology. Vol. 482. Clifton, N.J.: 2009. Prospective isolation of mesenchymal stem cells from mouse compact bone; pp. 259–268. [DOI] [PubMed] [Google Scholar]