

Abstract
Here, we have prospectively isolated and characterized, for the first time, clonogenic cells with self-renewal capacities from mantle cell lymphoma (MCL), a particularly deadly form of Non-Hodgkin’s Lymphoma (NHL). Self-renewal and tumorigenic activities were enriched in MCL cell fractions that lacked expression of the prototypic B cell surface marker, CD19. CD45+CD19− cells represented a relatively small fraction of the total MCL tumor cells, however, they recapitulated the heterogeneity of original patient tumors upon transplantation into immunodeficient mice. As few as 100 of these cells displayed self-renewal capacities in secondary and tertiary recipient mice by in vivo limiting dilution assays. Similar to leukemic stem cells, CD45+CD19− MCL cells also displayed a quiescent status as determined by dye efflux assays. In summary, this study is the first to isolate subpopulations of MCL cells that have self-renewal and tumorigenic capacities. Identification and characterization of MCL-ICs is an important first step toward understanding how self-renewal and tumorigenicity are regulated in MCL and designing targeted therapies against MCL-ICs will ultimately lead to improved outcomes for MCL patients.
Keywords: Mantle cell lymphoma, Self-renewal, Xenografts, Cancer stem cells
Introduction
Various reports have identified cancer-initiating cells (C-ICs) as important mediators for tumor growth, progression and metastasis [1–6]. Furthermore, C-ICs are also largely resistant to conventional chemotherapy and radiotherapy, suggesting that these resistant cells may be responsible for tumor recurrence [7–11]. Early studies demonstrated the presence of clonogenic tumor cell populations with stem-like properties in NHL, which presumably arise from B cells of origin [12–14]. However, the identities of these cell types that contribute to tumorigenicity in vivo have remained obscure. Transplantation of normal and leukemic human hematopoietic stem cells into immunodeficient mice is a bona-fide way to measure in vivo long-term repopulating activities [15–16]. By using the xenotransplantation assay system, we attempted to identify a subpopulation of cells that initiate and sustain tumor growth in human MCLs.
MCL is a subtype of B-cell NHL, and accounts for approximately 6% of all NHL cases [17–19]. The major characteristic of MCL is t(11:14)(q13:q32) translocation that leads to the increased level of cyclin D1 (CCND1) expression. This is caused by the juxtaposition of the cyclin D1 gene to B-cell immunoglobulin heavy chain transcriptional enhancers. However, transgenic mice over-expressing wild-type CCND1 in their B cells do not show increased lymphoma incidence [20–21]. These data indicate that CCND1 over-expression is necessary, but not sufficient to induce MCL. The cellular morphology of MCL at the time of diagnosis are irregular nuclei, condensed chromatin, and scant and pale cytoplasm with up-regulated cell surface markers such as CD20 and CD79a [17–19]. Most MCL display widespread cellular heterogeneity in advanced stages, which contributes to a poor response to therapies [19, 22–23]. The heterogeneity within MCL tumors and resistance to therapies imply that the MCL tumors are comprised of the cells with different tumorigenic capacities. In addition, unlike other B cell lymphomas, most MCL do not undergo somatic hypermutation in the immunoglobulin heavy chains [24]. All these combined biological properties indicate that MCL could arise from the early- stage B cells, rather than from the committed B cells in germinal centers.
Here we report that MCL-initiating activities are enriched in a subpopulation of tumor cells that lack the prototypic B cell marker, CD19. As few as 100 CD45+CD19− MCL cells displayed self-renewal activities and formed tumors in immunodeficient mice. In contrast, CD45+CD19+ MCL cells were not able to self-renew during serial transplantation assays and displayed greatly reduced tumorigenicity. These data demonstrate that MCL tumors are comprised of hierarchical of the cells with different tumorigenic capacities. Identification of clonogenic MCL initiating cells provides valuable tools to understand pathogenesis of MCL in humans.
Results
Clinical Samples Used to Identify Mantle Cell Lymphoma Initiating Cells
Tumor cells were harvested via aphaeresis from patients with clinically confirmed stage 4 MCL, with involvement of extra nodal sites such as the intestinal tract, kidney, bone marrow and peripheral blood. In each sample, markedly increased numbers of committed B cells (CD19+CD20+) were present compared to normal PBMC samples (Fig. 1a). Prior to transplantation into immunodeficient mice, each sample was analyzed for the presence of Epstein-Barr virus (EBV) by PCR. All eight patient samples (Fig. S1a) as well as primary xenograft tumors used for secondary transplantation (Fig. S1b) were negative for EBV. At the time of diagnosis each sample was positive for the t(11:14)(q13:q32) translocation, as determined by FISH. We also confirmed elevated levels of cyclin D1 gene expression in all patient samples by real-time PCR (Fig. S1c).
Figure 1. Isolation of CD45+CD19− and CD45+CD19+ MCL cells.


(A); FACS analysis of patient samples used for isolation of clonogenic MCL populations. Note that CD19+ CD20+ cells are markedly increased in all eight MCL patient samples compared to normal PBMC. Percentages of CD19+CD20+ cells were calculated by FACS based on isotype control for each patient, and CD3+ and CD34+ cells were removed prior to FACS analyses.
(B); Highly purified MCL cells were used for xenograft transplantation. CD3 positive T cells and CD34 positive HSC were removed by immunodepletion prior to sorting. There were no detectable CD3+ and CD34+ cells present after depletion. Post-sort analysis of CD45+CD19+ and CD45+CD19− cells showed nearly 100% of desired populations. All cells were gated for CD45 positive cells prior to CD19 separation, and gates were determined using IgG isotype controls.
Identification of Markers that Fractionate Tumorigenicity in Mantle Cell Lymphoma
In order to isolate clonogenic populations in human MCL, which we have termed MCL-initiating cells (MCL-ICs), we utilized a similar approach that has been used successfully to isolate non-malignant stem and progenitor cells, i.e., monoclonal antibody-based cell sorting followed by analysis of the sorted cells using clonogenic assays in vitro and in vivo [25–27]. Since there is no in vitro assay available to measure clonogenicity of human B cells, we used in vivo immunodeficient xenograft models for the identification of MCL-ICs.
Unlike other B cell lymphomas, most MCL do not undergo somatic hypermutation in immunoglobulin heavy chains [24]. These biological properties suggest that MCL tumors likely arise from early-stage B cells, rather than from committed B cells in germinal centers. Therefore, we initially focused on differential expression of the cell surface antigen, CD19, which is involved in early stages of B cell commitment [28]. The levels of CD19 expression were heterogeneous among MCL patients with minor percentages (3–15%) of CD19 negative cells (Table 1a). Prior to separation by CD19 expression, CD3+ T cells and CD34+ hematopoietic stem cells (HSCs) were depleted. No detectable T cells or HSCs were present in MCL tumors after depletion (Fig. 1b). Post-sort analyses of injected cells showed nearly 100% purity of the desired population (Fig. 1b).
Table 1A. Heterogeneous expression of CD19 in MCL patient samples.
The percentages of CD45+CD19− cells were calculated based on expression levels with IgG isotype control (not shown). CD3+ and CD34+ cells were separated from mononuclear cells of each sample as described in the Materials and Methods section. All CD45+CD19− xenograft tumors displayed the same light chain restriction patterns as the original patient cells. Intracellular stainings were performed to analyze light chain restriction patterns as described in Materials and Methods. CD45+CD19− xenograft tumors displayed the same light chain restriction patterns that match the original patient tumor cells.
| Patient # | % of CD45+CD19− cells | Light chain restriction in patient samples | Light chain restriction in CD45+CD19− xenografts |
|---|---|---|---|
| Pt 1 | 8 % | Lambda | Lambda |
| Pt 2 | 10 % | Kappa | Kappa |
| Pt 3 | 9 % | Lambda | Lambda |
| Pt 4 | 3 % | Lambda | Lambda |
| Pt 5 | 15 % | Kappa | Kappa |
| Pt 6 | 11 % | Kappa | Kappa |
| Pt 7 | 10 % | Lambda | Lambda |
| Pt 8 | 7 % | Lambda | Lambda |
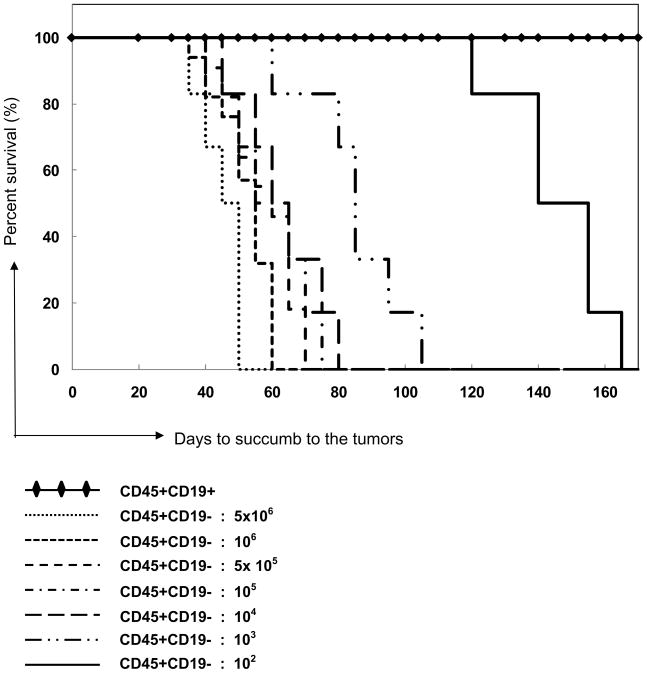
Surprisingly, CD45+CD19− MCL cells generated MCL-like tumors in all NOD/SCID mice tested (Table 1b, Fig. S1d). MCL-like tumors were detected in the peritoneum of the abdominal wall, lymph nodes, spleens or thymus, indicating that residual lymphoid tissues in NOD/SCID mice can support lymphoma growth (Fig. S1d). In contrast, mice injected with CD45+CD19+ MCL cells did not establish tumors in the same time period (Table 1b).
Table 1B. Kaplan-Meier Curves.
Kaplan-Meier curve illustrating the proportion of survival of NOD/SCID mice injected with various doses of CD45+CD19+ or CD45+CD19− MCL-ICs cells. All mice (n=57) injected with CD45+CD19− cells developed MCL-like tumors and were sacrificed due to tumor-related abnormalities. The time to succumb to the tumors differed depending on the dose of injected cells. Mice implanted with CD45+CD19+ fractions did not develop tumors within the range of injected cells (5×10⁶ to ~100 cells, n=56 of 57) and in the time course tested, except for one mouse in passage 2 (see Table S1).
 |
In Vivo Limiting Dilution Assays Reveal that at Least One in 100 CD45+CD19− MCL-ICs Possess Tumor-Initiating Activities
To quantify self-renewal activities of CD45+CD19− cells, we performed limiting dilution assays, which are in vivo bioassays that detect positive or negative responses in mice receiving varying doses of injected cells [29–31]. CD45+CD19− and CD45+CD19+ cells were isolated and tested from all eight patient samples. All mice (n= 57) injected with CD45+CD19− cells developed MCL-like tumors. In contrast, mice injected with CD45+CD19+ cells (n=57) did not develop tumors in the same time period, with the exception of one mouse (Table 1b, Table S1). Since NOD/SCID mice develop spontaneous murine thymomas and lymphomas beyond 8–10 months of age [32], we sacrificed the mice injected with CD45+CD19+ cells at the same time when the mice injected with CD45+CD19− cells succumbed to tumors. CD45+CD19− MCL cells from eight different patients generated MCL-like tumors during serial transplantations (Table S1). Based on the numbers of mice analyzed, we have calculated the frequencies of stem cells in CD45+CD19− MCL cells. (http://bioinf.wehi.edu.au/software/elda). The frequency of malignant stem cells within CD45+CD19− fractions is 1 in 1 (upper limit) to 1 in 1.08 × 10² cells. In contrast, the frequencies of stem cells in the CD45+CD19+ cells are 1 in 7,109,449 (upper limit) to 1 in 3.46 × 10⁸ (lower limit). Therefore, CD45+CD19− cells are enriched with stem-like cells between 3.2 × 10⁶-fold to 7 × 10⁶-fold as compared to CD45+CD19+ MCL cells.
To ensure that reduced tumor engraftment of CD45+CD19+ cells are not due to inhibitory effects of anti-CD19 antibodies, as has been reported in immunodeficient mice engrafted with human leukemic cells after anti-CD38 antibody incubation [33], we incubated MCL tumor cells with anti-CD19 antibodies, F(ab′)2 fragments of CD19 antibodies, and isotype controls prior to transplantation into the mice. All MCL tumor cells were equally tumorigenic regardless of presence of anti-CD19 antibodies (Table 2a and Fig. 2). In addition, CD122 antibody injection to NOD/SCID mice did not change engraftment of MCL cells (Table 2b). Therefore, reduced engraftment of CD45+CD19+ MCL cells in NOD/SCID mice is not due to inhibitory effects of CD19 antibodies mediated by innate immune system of the immunocompromised mice.
Table 2A. Anti-CD19 antibodies do not inhibit engraftment of MCL tumor cells in NOD/SCID mice.
MCL patient cells were incubated with anti-CD19 antibodies, isotype controls and F(ab′)2 fragments of anti-CD19 antibodies before transplantation into NOD/SCID mice by intraperitoneal injection. F(ab′)2 fragments of anti-CD19 antibodies were generated by enzymatic digestion using ficin (Pierce) and then purified using a protein A column to remove Fc portions. MCL-like tumors formed at equal frequency in all mice.
| Cells injected | Cell dose | # of mice tested | Total # of mice have tumors |
|---|---|---|---|
| MCL tumor cells (pt1, pt3, pt8) + anti-CD19 antibodies | 5×10⁶ | 5 | 5/5 (100%) |
| MCL tumor cells (pt1, pt3, pt8) + IgG antibodies | 5×10⁶ | 3 | 3/3 (100%) |
| MCL tumor cells (pt1, pt3, pt8) + (Fab)2 fragments of CD19 | 5×10⁶ | 4 | 4/4 (100%) |
Figure 2. Anti-CD19 antibodies do not inhibit engraftment of MCL tumor cells in NOD/SCID mice.

FACS analysis of xenograft tumors from mice transplanted with MCL cells after incubation with either anti-CD19 antibodies or isotype control antibodies.
Table 2B. Treatment of immunosuppressive antibodies to NOD/SCID mice does not influence engraftment of MCL tumor cells.
CD122 antibody (200 μg) was administrated by intraperitoneal injection on the day before transplantation. MCL tumor cells incubated with anti-CD19 or isotype control were injected into anti-CD122-treated NOD/SCID mice. Both populations formed MCL-like tumors in all mice tested.
| Cells injected | Cell dose | # of mice tested | Total # of mice have tumors |
|---|---|---|---|
| MCL tumor cells (pt1, pt3) + anti-CD19 antibodies Injected into anti-CD122 treated NOD/SCID mice | 5×10⁶ | 5 | 5/5 (100%) |
| MCL tumor cells(pt1, pt3) + IgG antibodies Injected to anti-CD122-NOD/SCID mice | 5×10⁶ | 2 | 2/2(100%) |
CD45+CD19− Xenografts Generate the Cellular Heterogeneity of Original Patient Samples
To determine whether CD45+CD19− xenograft tumors resembled the original tumors, we first examined intracellular light chain restriction patterns in xenograft tumors. Human B cells use V(D)J recombination to assemble genes for the variable regions of the heavy and light chains of antibodies. The result is either kappa or lambda light chain generation [34]. CD45+CD19− xenograft tumors from all eight patients displayed the same light chain restriction patterns as the original patient samples (Table 1a). We further analyzed cell surface antigen expression of CD45+CD19− xenograft tumors by FACS analyses using various makers important for the development of normal and malignant B cells. CD45+CD19− xenograft tumors showed comparable levels of cell surface marker expressions in comparison to the original patient samples (Fig. 3a). Cells containing the defining genetic hallmark of MCL, t(11;14)(q13;q32) translocation, were detected in original patient tumors as well as in xenograft tumors derived from CD45+CD19− MCL cells (Fig. 3b). We also compared histological characteristics of CD45+CD19− xenograft tumors with original patient tumor cells. Xenografts injected with unfractionated patient cells (termed unfractionated xenograft tumors) were also compared due to lack of whole lymph node biopsies from patients. CD45+CD19− xenografts and unfractionated xenografts exhibited similar pathological characteristics by H&E staining including small to medium sized lymphoid cells with irregular nuclear contours [17,18] (Fig. 4a). Both xenograft tumors showed increased expression of human CD20, CD19, CD45 and cyclin D1 by immunohistochemistry (Fig. 4a). The proliferative antigen, Ki-67, was highly expressed in CD45+CD19− xenograft tumors, unfractionated xenograft tumors, and in patient cells (Fig. 4a). Together, these data demonstrate that CD45+CD19− MCL cells, even though they represent relatively small populations within MCL tumors, are able to generate xenograft tumors that recapitulate heterogeneity of original patient tumors.
Figure 3. CD45+CD19− xenograft tumors recapitulate heterogeneity of patient samples.


(A); FACS analysis of cell surface antigens in CD45+CD19− xenograft tumors, as compared to patient tumor cells. Only cells expressing human CD45 were analyzed. Xenograft tumors generated from patients 1 and 4 are shown, although similar results were obtained from all xenograft tumors injected with other patient samples.
(B); t(11:14)(q13:q32) translocations were detected in patient tumor cells (Pt1) as well as CD45+CD19− xenograft tumors as determined by FISH. Note the yellow fusion signals (arrows). Boxed regions in left panels are shown at higher magnification in right panels.
Figure 4. Immunohistochemical analysis of CD45+CD19− xenograft tumors.


(A); Xenograft tumors generated from both unfractionated and sorted CD45+CD19− tumor cells (Pt1) displayed pathological features resembling the original patient tumors. The xenograft tumors and the patient’s original tumor cells expressed comparable levels of CD19, CD20, cyclin D1 and Ki-67 proliferation antigens. Cells from patient PBMC were examined for Ki-67 and cyclin D1 expression (arrows). At least five sections from each xenograft tumor were analyzed. Only Pt1 derived tumors are shown even though all xenograft tumors derived from eight different patients were analyzed. Other xenograft tumors also generated similar results.
(B); Immunohistochemical analysis of CD45+CD19− and CD45+CD19+ xenograft tumors. CD45+CD19− and CD45+CD19+ xenograft tumors (Pt4) are immunostained for human CD19 and cyclin D1. Arrows in each panel indicate representative signals.
Since mice injected with CD45+CD19+ cells did not develop intraperitoneal tumors in the time course analyzed, we examined organs for the expression of human cyclin D1 and CD19. The livers of CD45+CD19+ xenografts were largely negative for cyclin D1 and CD19, although small patches of splenocytes with low CD19 expression were noticed (Fig. 4b). In contrast, obvious cyclin D1 expression was detected in spleens isolated from all CD45+CD19− xenografts, but not in spleens of mice injected with CD45+CD19+ cells (Fig. S2a). Various organs such as brain, heart, liver, spleen, and intestine from CD45+CD19+ xenograft mice were mostly negative for human lymphocytes, as revealed by anti-CD45 immunostaining (Fig. S2b). In contrast, CD45 positive cells engrafted into the liver, spleen and intestine of CD45+CD19− xenograft mice. All xenograft mice (Table S1) were analyzed by FACS and/or immunohistochemistry and showed similar expression patterns.
Collectively, our data suggest that we have successfully divided MCL tumors into two fractions: one is enriched for self-renewal and tumor-initiating activities, whereas the other lacks self-renewal capacity and displays greatly reduced tumorigenicity in immunodeficient mice.
Hematopoietic Stem Cells are not the Sources of Tumorigenicity
MCL patient cells contained less than 1% CD34+ cells (Fig. 1b and Fig. S3a). To ensure that the self-renewal and tumorigenic activities of MCL-ICs were not from CD34+ cells, we further fractionated CD45+CD19− cells based on CD34 expression. Both CD45+CD19−CD34+ and CD45+CD19−CD34− cells were equally tumorigenic in all mice tested (n=6) and all tumors developed with similar kinetics (Fig. S3b). Therefore, hematopoietic stem cells in MCL samples do not contribute to the stem-like properties of MCL-ICs.
Other Cell Surface Markers Do Not Fractionate Tumorigenicity
We also fractionated MCL tumors using additional cell surface markers that play established roles in B cell development to determine whether these markers could enrich for tumorigenic properties of MCL-ICs [35,36]. The expressions of some of these markers, such as CD5, were heterogeneous between patients (Fig. S3c). Both CD3+ T cells and CD34+ HSC cells were also depleted prior to sorting, as shown in post sort analyses (Fig. S3d). None of the markers tested, however, fractionated tumorigenicity similar to CD19 expression (Fig. S3e). All xenograft tumors generated with marker-positive and -negative cells up-regulated both cyclin D1 and Ki-67 similar to injected patient cells (Fig. S3f).
Unlike primary patient cells, both CD45+CD19+ and CD45+CD19− cells isolated from MCL cell lines (SP-53 and Jeko) equally formed tumors in immunodeficient mice (Fig. S3g). These data suggest that tumor cells that have been passaged for a prolonged time period and are adapted for in vitro growth conditions, may not be an appropriate source for isolation of clonogenic cancer-initiating cells.
MCL-ICs are Maintained in a Quiescent Status
Since advanced MCL is often resistant to conventional therapies that target the bulk of proliferating cells [17–19], we investigated the cell cycle status of CD45+CD19− cells using Rhodamine 123 (Rho123). Decreased Rho123 dye accumulation reflects quiescent cellular status as well as increased ABC drug transporter expression [37]. Rho123 is a substrate for P-glycoprotein (P-gp), an efflux pump responsible for multidrug resistance in tumor cells. P-gp contributes to drug resistance by acting as an uni-directional drug efflux pump, resulting in decreased accumulation of drugs within the cells [37,38]. Analyses of MCL tumor cells from patients showed that CD45+CD19− fractions were enriched with decreased Rho123 dye accumulation as compared to CD45+CD19+ fractions (Fig. 5a). However, CD45+CD19− cells were not the only populations with decreased Rho123 accumulation. CD45+CD38− (46%), CD45+CD10− (14%), and CD45+CD5− (5%) MCL cells showed decreased Rho123 accumulation compared to CD45+CD38+, CD45+CD10+, and CD45+CD5+ cells (Fig. 5b). Given that CD38 is a marker for more differentiated lymphocytes [39,40], it is likely that less differentiated CD38 negative populations are enriched with Rho123 dye efflux activities as shown in CD34+CD38− hematopoietic stem cells [41]. We are currently investigating the functional importance of cellular quiescence in MCL initiation.
Figure 5. CD45+CD19− MCL-ICs are maintained in a quiescent status.


(A); In comparison to CD45+CD19+ MCL cells, CD45+CD19− MCL-ICs displayed increased rhodamine efflux activities (Rho123 low populations), indicative of ABC transporter activities. Relative percentages of Rho123 low cells in patient samples are indicated in the boxed areas.
(B); MCL-ICs are quiescent based on Hoechst (Hst), and PyroninY (PY) expression. Patient tumor cells (Pt1) were analyzed for CD45 and CD19 expression as well as Hst and PY stainings. CD45+CD19− fractions are enriched for G0 phase cells (79%) and CD45+CD19+ fractions are enriched for G1/S/G2+M phase cells (58%). CD3 and CD34 positive cells were depleted prior to Rho123 staining and Hst/Py staining.
Since Rhodamine efflux assays do not distinguish between cells in different stages of the cell cycle, we further stained MCL patient cells with Hoechst (Hst) and Pyronin Y (PY) dyes. Cells in G0 phase have diploid DNA and low RNA content and low Hst and PY staining. As cells progress through G1 to S/G2+M phases, they synthesize both RNA and DNA and display more intense staining for Hst and PY [42,43]. Quiescent AML cells isolated according to Hst and PY stainings can form more colonies in vitro and also initiate AML in NOD/SCID mice [44,45]. CD45+CD19+ fractions were enriched for G1 and S/G2+M phase cells (58%) and CD45+CD19− fractions were enriched for quiescent G0 phase (Fig. 5b).
Discussion
We have successfully isolated a minor population from mantle cell lymphoma that is highly enriched with tumor initiating activities. The frequencies of tumor initiating cells in CD45+CD19− MCL populations were 48,000-fold higher than those in unfractionated MCL populations. In mice, CD19− early B cell progenitor cells possess stem-like plasticity which enables them to differentiate into cellular lineages other than B cells [45]. Upon development to the fully committed B cells, this stem-like plasticity is lost [45]. Therefore, it is possible that normal CD45+CD19− cells more readily initiate MCL upon genetic mutations compared to fully differentiated CD19+ cells. However, our report does not address whether CD45+CD19− cells are indeed the normal cell of origin that give rise to MCL. More detailed studies will be needed to determine if early B cell progenitors are the normal cell of origin for MCL or whether a de-differentiation process occurs, similar to what has been reported in mice [46]. However, there are significant differences between early murine and human B cell development, e.g., human pre-B-I cells do not follow a proliferative expansion in response to IL-7 [47]. Therefore, careful analyses are necessary to delineate the normal cell of origin for MCL. Development of in vitro assays that can measure clonogenicity of human B cells will help to understand the factors that drive early human B cells to expand and differentiate.
Conclusions
The prospective identification of MCL-ICs that initiate and sustain tumors in human is a critical first step toward designing therapeutic strategies to target these cells. Additionally, isolation of MCL-ICs will allow for future studies targeting molecular mechanisms that couple self-renewal, tumorigenicity and chemotherapeutic resistance in MCL.
Materials and Methods
Antibodies
The commercially available antibodies were used; anti-CD45 (HI30, IgG1, k), anti-CD19 (HIB19, IgG1, k), anti-CD3 (HIT3a, IgG2a, k), anti-CD34 (581, IgG1, k), anti-CD5 (UCHT2, IgG1, k), anti-CD20 (2H7, IgG2b, k), anti-CD69 (FN50, IgG1, k), anti-CD10 (HI10a, IgG1, k), anti-CD38 (HIT2, IgG1, k), anti-CD43 (L10, IgG1), anti-CD27 (O323, IgG1, k). All antibodies were conjugated with appropriate fluorochromes based on the combinations of antibodies used in each experiment. Antibodies were purchased from BD or ebioscience.
Tumor cell lines and patient samples
The Jeko and SP53 human MCL cell lines were cultured and maintained in RPMI 1640 (Cellgro) supplemented with 10% heat-inactivated fetal calf serum (Cellgro), 2 mM L-glutamine, 50 U/ml penicillin and 50 μg/ml streptomycin. Blood specimens from patients were obtained after informed consent, as approved by M.D. Anderson Cancer Center as well as by the University of Texas-Health Science Center Institutional Review Boards. Blood samples from non-malignant donors were purchased from Gulf Coast Regional Blood Center (Houston, TX). Mononuclear cells were isolated from all primary patient PBMC and normal PBMC by standard Ficoll gradient methods.
Cell staining and sorting
Cell preparation
CD3+ T cells and CD34+ HSCs were removed from PBMC samples prior to all analyses using lineage-specific antibodies (CD3 and CD34, 1:500 dilutions) and magnetic beads according to the manufacturer’s protocol (Dynal). PBMC (1×10⁷ cells/ml) were first incubated with unlabelled CD3 and CD34 antibodies for 20 mins at 4°C with gentle rotation. Cells were washed three times with buffer (HBSS containing 2% heat inactivated FBS). Dynal beads were added and incubated for 30 mins at 4°C with gentle rotation. Beads were sorted with a magnet for 3–5 mins and the supernatants were harvested (“A” fraction) for further analyses.
CD45+CD19+ and CD45+CD19− MCL cell isolation
Fraction “A” was used for this experiment. The absence of CD3+ and CD34+ cells was confirmed in the cells (“A” fraction above) by FACS before sorting for CD45+CD19+ and CD45+CD19− fractions. If the “A” fraction still contains CD3+CD34+ cells, cells were sorted as follows: CD45+CD19−CD3−CD34− or CD45+CD19+CD3−CD34−. The following antibodies were used for FACS analyses and sorting; FITC-conjugated anti-CD45 (HI30), PE-conjugated anti-CD19 (HIB19), APC-conjugated CD34 (581). CD3 antibodies (HIT3a) were conjugated with biotin, which were followed by staining with PE-Cy7 conjugated streptavidin. The prepared cell populations were incubated for 20–30 mins at 4°C with gentle rotation. Stained populations were then washed three times with HBSS containing 2% FBS. The gates were determined based on negative controls (isotype stainings) and positive controls. Non-viable cells were eliminated with fluoro-gold (50 μM). All fractions were isolated by fluorescence-activated cell sorting (Aria, Becton Dickinson, San Jose, CA). Post sort analyses were done in all samples to ensure greater than 99% purity. If necessary, cells were sorted twice to achieve desired sorting purities. All FACS data were analyzed using the Diva software (Becton Dickinson) or FlowJo (Tree Star, Ashland, OR).
Xenotransplantation assay
Immunodeficient NOD/SCID mice (2–4 weeks old) were purchased from Jackson Labs (Bar harbor, Maine). These mice were then bred and maintained in a pathogen-free facility at the UT-Health Science Center. All animal procedures were approved by the UT-HSC Animal Care Committee. For all xenograft assays, 2–3 month old mice (male or female) were used. Appropriate cell numbers and cell types were injected by intraperitoneal injection into NOD/SCID mice given a dose of 2.25 G using gamma rays from a cesium irradiator. Mice were kept until they showed obvious signs of distress or discomfort in accordance with approved guidelines established by the Animal Care Committee at the UT-health Science Center. CD45+CD19− and CD45+CD19+ xenograft mice were sacrificed at the same time points because 10% of NOD/SCID mice develop spontaneous murine lymphoproliferative diseases beyond 8–10 months age.
Limiting dilution assays and serial transplantations
For limiting dilution assays, unsorted MCL patient cells were injected intraperitoneally at doses ranging from 107 to 103 cells. Eight different patient samples were injected. Highly purified CD45+CD19− and CD45+CD19+ cells (isolated as described in the cell separation procedure) were injected at doses ranging from 100 to 5×10⁶ cells per mouse. Three to seven mice per group were used for each injection dose. For serial transplantation experiments, tumors from primary or secondary mice were separated based on human CD45 and CD19 expression. Prior to sorting, human CD3 and CD34 cells were removed by antibodies conjugated to magnetic beads. The CD45+CD19− and CD45+CD19+ cells, at doses ranging from 100 to 5 × 10⁶ cells (Table S1), were then reimplanted into irradiated secondary or tertiary NOD/SCID mice (2.25G) via intraperitoneal injections.
Detection of Epstein-Barr Virus (EBV)
DNA was extracted using the QIAamp DNA blood mini kit (Qiagen, Valencia, CA) according to the manufacturer’s instructions. The presence of EBV was detected by amplifying fragments using the following primers: 5-CTTTAGAGGCGAATGGGCGCCA-3 and 5-TCCAGGGCCTTCACTTCGGTCT-3. 100 ng of DNA and 150 nM of each primer were added to 50 μl PCR supermix (Invitrogen, CA). 94°C for 30 seconds, 55°C for 30 seconds, and 72°C for 1 min with a final extension at 72°C for 10 mins were used to amplify the gene.
Rhodamine 123 staining
CD3+ (T cells) and CD34+ (HSCs) were removed from primary patient samples as described above. These cells were suspended at 106 cells/50 μl of HBSS containing 5% FBS. Rhodamine 123 dye (Invitrogen) was added to a final concentration of 0.1 μg/ml. Cells were incubated for 20 mins at 37°C followed by washing cells twice with HBSS. Cells were resuspended to allow efflux at 37°C for 2 hours. Cells were washed once with HBSS and stained with antibodies before FACS analyses.
CD19 antibodies and engraftment
To address whether anti-CD19 antibodies influence engraftment, MCL tumor cells (after CD3 and CD34 positive cell depletion) were first incubated with test antibodies (unconjugated anti-CD19, clone HIB19) or isotype control antibodies (IgG1) for 30 mins at 4°C with gentle rotation. Antibodies (0.5 μg) were added to 106 cells in a volume of 50 μl. The cells were then washed three times and resuspended in phosphate-buffered saline before transplantation into NOD/SCID mice. All mice were sacrificed 60 days after injection prior to death (as described in Taussig et al33). Intraperitoneal tumors and various organs of all xenograft mice were examined. Organs were analyzed by immunohistochemistry for the presence of human CD45+CD19+ cells. Intraperitoneal tumors were also examined by FACS analysis to ensure they recapitulate heterogeneity of original patient tumors.
Immunohistochemistry
Paraffin sections were made from xenograft tumors and slide sections were heated at 60°C for 20 mins. Sections were deparaffinized by standard methods (100% xylene, 100% ethanol, 95% ethanol, 80% ethanol) and antigens were retrieved by incubating slides in 0.1 M citrate buffer in vegetable steamer for 30 mins. After cooling down slides to room temperature, 0.3% H2O2 was added and incubated for 10 mins. After wash, slides were blocked in 10% swine serum for 30 mins followed by incubation with primary antibodies (Ki-67, 1:150 Cyclin D1, 1:100, Abcam) for 2 hours. Slides were washed and incubated with biotinylated secondary antibodies (Dako). Signals were detected after incubating slides with ABC complex (Vector lab) followed by incubation with DAB (Vector). Counter staining was done with Mayer’s Hematoxylin (Sigma) for 10 mins at RT. Slides will be dehydrated before taking pictures. For Ki-67 staining on frozen tissues, sections were incubated in Zamboni’s fixative for 10 mins before antibody staining. Zamboni’s solution is parafomaldehyde, picric acid solution (pH 7.3).
Analysis of cyclin D1 translocation
Cells were fixed with FISH fixative (100% methanol: Acetic acid = 3:1) for 30 mins. Cells were dried in air and treated sequentially with the following reagents. 2 × SSC (PH 7.0, 37°C) for 30 min, 1× PBS for 5 min, 1 × formaldehyde for 5 min, 1 × PBS for 5 min, 70% ethanol for 1 min, 85% ethanol for 1 min, 100% ethanol for 1 min followed by dry samples in air for 15 mins. Probe specific for the CCND1 (SpectrumOrange™) and IGH genes (SpectrumGreen™) were used to detect translocation (11:14)(q13:q32) (Vysis). t(11:14)(q13:q32) translocation were observed with Lieca microscope equipped with a triple-band pass.
Supplementary Material
Acknowledgments
We are grateful to Dr. Joseph McCarty (MDACC) for insightful comments and critical reading of the manuscript. We thank Dr. David L. Haviland for cell sorting technical assistance, Cassandra A. Woodard for assistance with the IRB protocols, Drs. Luis Fayad and Ruth Katz for filing the IRB applications, and Dr. Michael Wang for inspiring this study. The tissue samples were provided by the University of Texas M. D. Anderson Cancer Center Satellite Lymphoma Tissue Bank which were supported by Institutional Core Grant # NCI/NIH - CA16672. NM is funded by NIH grant R21CA141275-01.
Appendix A. Supplementary data
Supplementary data associated with this article can be found, in the online version.
Footnotes
Publisher's Disclaimer: This is a PDF file of an unedited manuscript that has been accepted for publication. As a service to our customers we are providing this early version of the manuscript. The manuscript will undergo copyediting, typesetting, and review of the resulting proof before it is published in its final citable form. Please note that during the production process errors may be discovered which could affect the content, and all legal disclaimers that apply to the journal pertain.
References
- 1.Hajj M, Wicha MS, Benito-Hernandez A, Morrison SJ, Clarke MF. Prospective identification of tumorigenic breast cancer cells. Proc Natl Acad Sci USA. 2003;100:3983–3988. doi: 10.1073/pnas.0530291100. [DOI] [PMC free article] [PubMed] [Google Scholar]
- 2.O’Brien CA, Pollett A, Gallinger S, Dick JD. A human colon cancer cell capable of initiating tumour growth in immunodeficient mice. Nature. 2007;445:106–110. doi: 10.1038/nature05372. [DOI] [PubMed] [Google Scholar]
- 3.Lapidot T, Sirard C, Vormoor J, Murdoch B, Hoang T, Caceres-Cortes J, Minden M, Paterson B, Caligiuri MA, Dick JE. A cell initiating human acute myeloid leukaemia after transplantation into SCID mice. Nature. 1994;367:645–648. doi: 10.1038/367645a0. [DOI] [PubMed] [Google Scholar]
- 4.Singh SK, Hawkins C, Clarke ID, Squire JA, Bayani J, Hide T, Henkelman RM, Cusimano MD, Dirks PB. Identification of human brain tumour initiating cells. Nature. 2004;432:396–401. doi: 10.1038/nature03128. [DOI] [PubMed] [Google Scholar]
- 5.Matsui W, Huff CA, Wang Q, Malehorn MT, Barber J, Tanhehco Y, Smith BD, Civin CI, Jones RJ. Characterization of clonogenic multiple myeloma cells. Blood. 2004;15:2332–2336. doi: 10.1182/blood-2003-09-3064. [DOI] [PMC free article] [PubMed] [Google Scholar]
- 6.Hermann PC, Huber SL, Herrler T, Aicher A, Ellwart JW, Guba M, Bruns CJ, Heeschen C. Distinct populations of cancer stem cells determine tumor growth and metastatic activity in human pancreatic cancer. Cell Stem Cell. 2007;13:313–323. doi: 10.1016/j.stem.2007.06.002. [DOI] [PubMed] [Google Scholar]
- 7.Jordan CT. Cancer stem cell biology: from leukemia to solid tumors. Curr Opin Cell Biol. 2004;16:708–712. doi: 10.1016/j.ceb.2004.09.002. [DOI] [PubMed] [Google Scholar]
- 8.Bao S, WuQMcLendon RE, Hao Y, Shi Q, Hjelmeland AB, Dewhirst MW, Bigner DD, Rich JN. Glioma stem cells promote radioresistance by preferential activation of the DNA damage response. Nature. 2006;444:756–760. doi: 10.1038/nature05236. [DOI] [PubMed] [Google Scholar]
- 9.Dean M, Fojo T, Bates S. Tumour stem cells and drug resistance. Nat Rev Cancer. 2005;5:275–284. doi: 10.1038/nrc1590. [DOI] [PubMed] [Google Scholar]
- 10.Diehn M, Clarke MF. Cancer stem cells and radiotherapy: new insights into tumor radioresistance. J Natl Cancer. 2006;98:1755–1757. doi: 10.1093/jnci/djj505. [DOI] [PubMed] [Google Scholar]
- 11.Woodward WA, Chen MS, Behbod F, Alfaro MP, Buchholz TA, Rosen JM. WNT/beta-catenin mediates resistance of mouse mammary progenitor cells. Proc Natl Acad Sci USA. 2007;104:618–623. doi: 10.1073/pnas.0606599104. [DOI] [PMC free article] [PubMed] [Google Scholar]
- 12.Tweeddale ME, Lim B, Jamal N, Robinson J, Zalcberg J, Lockwood G, Minden MD, Messner HA. The presence of clonogenic cells in high grade malignant lymphoma: a prognostic factor. Blood. 1987;69:1307–1314. [PubMed] [Google Scholar]
- 13.Jones SE, Hamburger AW, Kim MB, Salmon SE. Development of a bioassay for putative human lymphoma stem cells. Blood. 1979;53:294–303. [PubMed] [Google Scholar]
- 14.Bobak D, Whisler R. Human B lymphocyte colony reponses. J Immunol. 1980;125:2764–2768. [PubMed] [Google Scholar]
- 15.Lapidot T, Fajerman Y, Kollet O. Immune-deficient SCID and NOD/SCID mice models as functional assays for studying normal and malignant human hematopoiesis. J Mol Med. 1997;75:664–673. doi: 10.1007/s001090050150. [DOI] [PubMed] [Google Scholar]
- 16.Dicks JE, Bhatia M, Gan O, Kapp U, Wang JC. Assay of human stem cells by repopulation of NOD/SCID mice. Stem Cells. 1997;15:199–207. doi: 10.1002/stem.5530150826. [DOI] [PubMed] [Google Scholar]
- 17.Campo E, Raffeld M, Jaffe ES. Mantle cell lymphoma. Semin Hematol. 1999;36:115–127. [PubMed] [Google Scholar]
- 18.Swerdlow SH, Berger F, Isaacson PI, Muller-Hermelink HK, Nathwani BN, Piris MA. Mantle cell lymphoma. Lyon: IARC press; 2001. [Google Scholar]
- 19.Salaverria I, Perez-Galan P, Colomer D, Campo E. Mantle cell lymphoma: from pathology and molecular pathogenesis to new therapeutic perspectives. Haematologica. 2005;90:11–16. [PubMed] [Google Scholar]
- 20.Adams JM, Harris AW, Strasser A, Ogilvy S, Cory S. Transgenic models of lymphoid neoplasia and development of a pan-hematopoietic vector. Oncogene. 1999;18:5268–5277. doi: 10.1038/sj.onc.1202997. [DOI] [PubMed] [Google Scholar]
- 21.Bodrug SE, Warner BJ, Bath ML, Lindeman GJ, Harris AW, Adams JM. Cyclin D1 transgene impedes lymphocytes maturation and collaborates in lymphomagenesis with the myc gene. EMBO. 1994;13:2124–2130. doi: 10.1002/j.1460-2075.1994.tb06488.x. [DOI] [PMC free article] [PubMed] [Google Scholar]
- 22.Sweetenham JW. Review: stem cell transplantation for mantle cell lymphoma: not yet the standard of care. Clin Adv Hematol Oncol. 2009;7:323–324. [PubMed] [Google Scholar]
- 23.Ruan J, Coleman M, Leonard JP. Management of relapsed mantle cell lymphoma: still a treatment challenge. Oncology. 2009;23:683–690. [PubMed] [Google Scholar]
- 24.Kienle D, et al. VH mutation status and VDJ rearrangement structure in mantle cell lymphoma: correlation with genomic aberration, clinical characteristics, and outcome. Blood. 2003;102:3003–3009. doi: 10.1182/blood-2003-05-1383. [DOI] [PubMed] [Google Scholar]
- 25.Morrison SJ, Weissman IL. The long-term repopulating subset of hematopoietic stem cells is determined and isolatable by phenotype. Immunity. 1994;1:661–673. doi: 10.1016/1074-7613(94)90037-x. [DOI] [PubMed] [Google Scholar]
- 26.Baum CM, Weissman IL, Tsukamoto AS, Buckle AM, Peault B. Isolation of a candidate human hematopoietic stem-cell population. Proc Natl Acad Sci USA. 1992;89:2804–2808. doi: 10.1073/pnas.89.7.2804. [DOI] [PMC free article] [PubMed] [Google Scholar]
- 27.Uchida N, Weissman IL. Searching for hematopoietic stem cells: evidence that Thy -1lo Lin- Sca-1+ cells are the only stem cells in C57BL/Ka-Thy-1.1. bone marrow J Exp Med. 1992;175:175–184. doi: 10.1084/jem.175.1.175. [DOI] [PMC free article] [PubMed] [Google Scholar]
- 28.Hardy RR, Hayakawa K. B cell development pathways. Annu Rev Immunol. 2001;19:595–621. doi: 10.1146/annurev.immunol.19.1.595. [DOI] [PubMed] [Google Scholar]
- 29.Taswell C. Limiting dilution assays for the determination of immunocompetent cell frequencies. III. Validity tests for the single-hit poisson model. J Immunol Methods. 1984;72:29–40. doi: 10.1016/0022-1759(84)90430-7. [DOI] [PubMed] [Google Scholar]
- 30.Taswell C. Limiting dilution assays for the determination of immunocompetent cell frequencies. J Immunol. 1981;126:1614–1619. [PubMed] [Google Scholar]
- 31.Strijbosch LWG, Buurman WA, Does R, Zinken PH, Groenewegen G. Limiting dilution assays, Experimental design and statistical analysis. J Immunol Methods. 1987;87:133–140. doi: 10.1016/0022-1759(87)90115-3. [DOI] [PubMed] [Google Scholar]
- 32.Chiu PP, Ivakine E, Mortin-Toth S, Danska JS. Susceptibility to lymphoid neoplasia in immunodeficient strains of nonobese diabetic mice. Cancer Res. 2002;62:5828–5834. [PubMed] [Google Scholar]
- 33.Taussig DC, et al. Anti-CD38 antibody-mediated clearance of human repopulating cells masks the heterogeneity of leukemia-initiating cells. Blood. 2008;112:568–575. doi: 10.1182/blood-2007-10-118331. [DOI] [PubMed] [Google Scholar]
- 34.Tonegawa S. Somatic generation of antibody diversity. Nature. 1983;302:575–581. doi: 10.1038/302575a0. [DOI] [PubMed] [Google Scholar]
- 35.Blom B, Spits H. Development of human lymphoid cells. Ann Rev Immunol. 2005;24:287–320. doi: 10.1146/annurev.immunol.24.021605.090612. [DOI] [PubMed] [Google Scholar]
- 36.Kondo M, Scherer DC, King AG, Manz MG, Weissman IL. Lymphocyte development from hematopoietic stem cells. Curr Opin Genet Dev. 2001;11:520–526. doi: 10.1016/s0959-437x(00)00227-6. [DOI] [PubMed] [Google Scholar]
- 37.Chaudhary PM, Roninson IB. Expression and activity of p-glycoprotein, a multidrug efflux pump, in human hematopoietic stem cells. Cell. 1991;66:85–94. doi: 10.1016/0092-8674(91)90141-k. [DOI] [PubMed] [Google Scholar]
- 38.Dean M, Rzhetsky A, Allikmets R. The human ATP-binding cassette (ABC) transporter superfamily. Genome Res. 2001;11:1156–1166. doi: 10.1101/gr.184901. [DOI] [PubMed] [Google Scholar]
- 39.Munshi CB, Graeff R, Lee HC. Evidence for a causal role of CD38 expression in granulocytic differentiation of human HL-60 cells. J Biol Chem. 2002;51:49453–49458. doi: 10.1074/jbc.M209313200. [DOI] [PubMed] [Google Scholar]
- 40.Prus E, Fibach E. Retinoic acid induction of CD38 antigen expression on normal and leukemic human myeloid cells: relationship with cell differentiation. Leuk Lymphoma. 2003;44:691–698. doi: 10.1080/1042819031000060564. [DOI] [PubMed] [Google Scholar]
- 41.Mckenzie JL, Takenaka K, Gan OI, Doedens M, Dick JE. Low rhodamine 123 retention identifies long-term human hematopoietic stem cells within the Lin-CD34+CD38− population. Blood. 2007;109:543–545. doi: 10.1182/blood-2006-06-030270. [DOI] [PubMed] [Google Scholar]
- 42.Darzynkiewicz Z, Evenson L, Staiano-coico L, Sharpless T, Melamed M. Relationship between RNA content and progression of lymphocytes through S-phase of cell cycle. Proc Natl Acad Sci USA. 1979;76:358–362. doi: 10.1073/pnas.76.1.358. [DOI] [PMC free article] [PubMed] [Google Scholar]
- 43.Shapiro HM. Flow cytometric estimation of DNA and RNA content in intact cells stained with Hoechst 3342 and pyronin Y. Cytometry. 1981;2:143–150. doi: 10.1002/cyto.990020302. [DOI] [PubMed] [Google Scholar]
- 44.Gothot A, Pyatt R, McMahel J, Rice S, Srour EF. Functional heterogeneity of Human CD34+ cells isolated in subcompartments of the G0/G1 phase of the cell cycle. Blood. 1997;90:4384–4393. [PubMed] [Google Scholar]
- 45.Gothot A, Van der loo JC, Clapp DW, Srour EF. Cell cycle-related changes in Repopulate capacity of human mobilized peripheral blood CD34+ cells in non-obese diabetic/severe combined immune-deficient mice. Blood. 1998;92:2641–2649. [PubMed] [Google Scholar]
- 45.Rumfelt LL, Zhou Y, Rowley BM, Shinton SA, Hardy RR. Lineage specification and plasticity in CD19− early B cell precursors. J Exp Med. 2006;203:675–687. doi: 10.1084/jem.20052444. [DOI] [PMC free article] [PubMed] [Google Scholar]
- 46.Cobaleda C, Jochum W, Busslinger M. Conversion of mature B cells into T cells by dedifferentiation to uncommitted progenitors. Nature. 2007;449:473–477. doi: 10.1038/nature06159. [DOI] [PubMed] [Google Scholar]
- 47.Prieyl JA, LeBien TW. Interleukin 7 independent development of human B cells. Proc Natl Acad Sci. 1996;93:10348–10353. doi: 10.1073/pnas.93.19.10348. [DOI] [PMC free article] [PubMed] [Google Scholar]
Associated Data
This section collects any data citations, data availability statements, or supplementary materials included in this article.