

Abstract
Altered serotonin (5-HT) signaling is implicated in several neuropsychiatric disorders, including depression, anxiety, obsessive-compulsive disorder, and autism. The 5-HT transporter (SERT) modulates 5-HT neurotransmission strength and duration. This is the first study using rotating disk electrode voltammetry (RDEV) to measure 5-HT clearance. SERT kinetics were measured in whole brain synaptosomes. Uptake kinetics of exogenous 5-HT were measured using glassy carbon electrodes rotated in 500 uL glass chambers containing synaptosomes from SERT-knockout (−/−), heterozygous (+/−), or wild-type (+/+) mice. RDEV detected 5-HT concentrations of 5 nM and higher. Initial velocities were kinetically resolved with Km and Vmax values of 99 ± 35 standard error of regression (SER) nM and 181 ± 11 SER fmol / (s x mg protein), respectively in wild-type synaptosomes. The method enables control over drug and chemical concentrations, facilitating interpretation of results. Results are compared in detail to other techniques used to measure SERT kinetics, including tritium labeled assays, chronoamperometry, and fast scan cyclic voltammetry. RDEV exhibits decreased 5-HT detection limits, decreased vulnerability to 5-HT oxidation products that reduce electrode sensitivity, and also overcomes diffusion limitations via forced convection by providing a continuous, kinetically resolved signal. Finally, RDEV distinguishes functional differences between genotypes, notably, between wild-type and heterozygous mice, an experimental problem with other experimental approaches.
Keywords: Rotating disk electrode, Voltammetry, Serotonin, 5-HT, Transporter, Uptake, Serotonin transporter, 5-HTT, SERT knockout
1. INTRODUCTION
Rotating disk electrode voltammetry (RDEV) is used in neuroscience to measure neurotransmitter transporter kinetics (Earles et al., 1998). A sufficient oxidation potential causes ‘electroactive’ substances with oxidizable chemical moieties to transfer electrons at the electrode's surface, generating a detection current proportional to the amount of material oxidized. Since its first application in neurobiology characterizing dopamine transporter (DAT) activity in rat striata (McElvain and Schenk, 1992b), RDEV has been adapted for a variety of tissue preparations including cells, whole fresh and frozen tissue and subcellular preparations (Earles et al., 2001; Volz et al., 2009a; Volz et al., 2006b; Wang et al., 2001), including synaptosomes (McElvain and Schenk, 1992b; Volz et al., 2009b). RDEV has been used to study uptake for several transporters, including DAT (Bjorklund et al., 2007; Chen et al., 2003; Chen et al., 1999; Robinson et al., 2005; Sleipness et al., 2008; Volz and Schenk, 2004) (reviewed by Schenk (Schenk, 2002; Schenk et al., 2005) and Meiergerd et al (Meiergerd and Schenk, 1996)), the norepinephrine transporter (NET) (Burnette et al., 1996; Chen and Justice, 1998; Chen et al., 1998; Reed et al., 2003) and the vesicular monoamine transporter 2 (VMAT-2) (Volz et al., 2009a; Volz et al., 2007; Volz et al., 2009c, 2008; Volz et al., 2006a, b). Measurements of 5-HT uptake in tissue preparations using RDEV are notably absent from the literature.
Experimental approaches to study 5-HT uptake in the brain have evolved over time. Traditional methods monitored radiolabeled 5-HT accumulation in tissue (Blackburn et al., 1967; Shaskan and Snyder, 1970). Ralph Adams' lab developed electrochemical methods for studying neurotransmitter uptake in the 1970's (Kissinger et al., 1973) and their use has steadily increased (Michael and Borland, 2007). Electrochemical techniques offer subsecond, highly kinetically resolved, real-time information about neurotransmission events with increased sensitivity compared to radiochemical approaches. High speed chronoamperometry has been used in vitro (Perez and Andrews, 2005; Perez et al., 2006) and in vivo (Daws et al., 2005; Daws et al., 1997; Daws et al., 1998; Frazer and Daws, 1998; Zhu et al., 2007) and fast scan cyclic voltammetry (FSCV) has been used in brain slices (John and Jones, 2007) and in vivo (Hashemi et al., 2009).
Synaptic and paracrine neurotransmission mediate brain 5-HT dynamics (Bunin and Wightman, 1999). Altered 5-HT neurotransmission may contribute to several psychiatric disorders including depression and anxiety (Ressler and Nemeroff, 2000), obsessive-compulsive disorder (Bloch et al., 2008; Murphy et al., 1989), and autism (Prasad et al., 2009; Schain and Freedman, 1961). Many currently prescribed drugs for these disorders modulate 5-HT neurotransmission, underscoring the clinical importance of developing a method to assess the dynamics of 5-HT.
The most extensively characterized 5-HT transport mechanism is the serotonin transporter (SERT), a sodium/chloride-dependent integral membrane protein expressed periand extrasynaptically along axons and dendrites and on varicosities (Miner et al., 2000; Pickel and Chan, 1999; Sur et al., 1996; Zhou et al., 1998). SERT modulates the strength and duration of serotonergic neurotransmission by high-affinity 5-HT uptake (Blakely et al., 1994; Iversen, 1971; Quick, 2003; Rudnick, 2006). Multiple post-translational regulatory mechanisms influence 5-HT uptake through SERT (Blakely et al., 1998; Steiner et al., 2008), and gene polymorphisms have been associated with several psychiatric disorders (Collier et al., 1996; Ogilvie and Harmar, 1997; Serretti et al., 2006) including autism (Prasad et al., 2009) and depression (Caspi et al., 2003; Vergne and Nemeroff, 2006; Weizman and Weizman, 2000) (but see (Risch et al., 2009)). Studies of mice with targeted disruption of SERT have further illuminated the role of SERT in emotional behavior (Fox et al., 2008; Murphy et al., 2008; Murphy et al., 2001). SERT and other monoamine transporters are a primary site of action for many antidepressants (Blakely et al., 1998; Sulzer and Edwards, 2005) as well as drugs of abuse (Amara and Sonders, 1998).
Here we evaluate RDEV's ability to measure SERT-mediated uptake in whole-brain synaptosomes, a model system of synaptic function comprised of metabolically active sealed synaptic structures with normal membrane potentials that can release and take up neurotransmitter (Whittaker, 1963, 1993). Specifically, we (1) characterize electrochemical and physiologic parameters relevant for using RDEV to measure 5-HT uptake in synaptosomes (including optimal working potential, detection limit, response time, and synaptosome viability), (2) show that pharmacologic approaches can be used to identify SERT's kinetic parameters and (3) show that this RDEV approach distinguishes between SERT genotypes.
2. MATERIALS AND METHODS
2.1. Animals
For the studies demonstrating viability of synaptosomes, male and female 129SvEvTac mice were used. All other uptake studies used mice having both (SERT +/+), one (SERT +/−), or no (SERT −/−) copies of the SERT gene. The SERT −/− mice were originally created in the laboratory of Dr. Dennis Murphy at NIMH (Bengel et al., 1998). They were backcrossed for at least nine generations (N9) to a C57BL/6J background and maintained at Taconic Farms (Hudson, New York) by incrossing homozygous mice. SERT −/− mice obtained from Taconic Farms were backcrossed to C57Bl6/J mice to generate SERT+/− mice, which were then bred to generate littermates of all three genotypes. Our lab uses multiple strains of mice, which is why two different strains are involved in the present study. All mice were 2 – 4 months old at the time of experiments. Mice were group housed and fed ad libitum in a temperature-controlled vivarium with a 12:12 light cycle (lights on 0600). All efforts were made to reduce the number of animals used and to minimize animal stress and discomfort during experimental procedures. Experiments were performed exactly as approved by the University of Washington Institutional Animal Care and Use Committee and conducted in accordance with the National Institutes of Health Guidelines for the Care and Use of Laboratory Animals.
2.2. Solutions and Chemicals
Solutions were made with water purified by a Millipore (Billerica, MA) Milli-Q ultrapurification system. Solutions were made fresh each day and all chemicals were reagent grade and used as received. The KCl and MgSO4 were purchased from Fisher Scientific (Pittsburg, PA). The NaCl, KH2PO4, NaHCO3, CaCl2, were purchased from JT Baker Chemical Co. (Philipsburg, NJ). The sucrose, glucose, HEPES, serotonin hydrochloride, paroxetine hydrochloride, GBR 12935, and nisoxetine hydrochloride were purchased from Sigma (St. Louis, MO). Drugs were diluted into physiological buffer, except serotonin which was diluted in pH 7.2 phosphate buffered saline (PBS) to improve its stability (Huang and Kissinger, 1996). The sucrose buffer contained 300 mM sucrose and 10 mM HEPES (pH 7.4). The physiological buffer contained 124 mM NaCl, 1.8 mM KCl, 1.3 mM MgSO4, 1.24 mM KH2PO4, 2.5 mM CaCl2, 26 mM NaHCO3, and 10 mM glucose (saturated with 95% O2, 5% CO2 for at least 10 minutes before use, pH 7.4). All experiments except the hydrodynamic voltammograms were performed in the presence of 100 nM nisoxetine and 1 μM GBR 12935 to minimize non-specific 5-HT uptake through NET and DAT, respectively. SERT activity was defined as the difference in initial rates in the presence and absence of 1 μM paroxetine, which is at least 200 times SERT's Ki (Li et al., 2004). Concentrations of all transporter uptake inhibitors were chosen on the basis of the Ki or IC50 with the goal of maintaining selectivity at a concentration sufficient to saturate the transporter of interest without affecting the others. The DAT blocker GBR12935 concentration was 100 nM, where the Ki for DAT is 1.6 nM (Garreau et al., 1997) and for SERT is 289 nM (Rothman et al., 2001). The NET blocker nisoxetine concentration was 50 nM, where the Ki for NET is 0.46 nM (Davids et al., 2002) and for SERT is 610 nM (Hyttel and Larsen, 1985).
2.3. Rotating Disk Voltammetry
RDEV involves rapid constant-rate rotation of an electrode placed in solution (Figure 1). This action generates laminar flow which draws solution upward to the electrode's surface where analytes are then oxidized and then move away in radial paths parallel to the electrode's surface (Figure 1, inset). Unlike conventional approaches in large beakers, these studies are performed in a small vessel with small volumes (0.5 mL) to decrease mixing time of the whole sample. Constant delivery of solution to the electrode surface and subsequent transfer of electrons from the solution's electroactive substances enable mathematical prediction, even in these low volume chambers, of the detection current using the Levich equation (Earles and Schenk, 1998):
| (1) |
where iL is the limiting current in amperes, n the number of electrons transferred per mole of analyte, F the Faraday's constant (96,485 coulombs/mol), A the area of the electrode in cm2, D the diffusion coefficient in cm2/s, C the analyte concentration in mol/L, ν the kinematic viscosity of the solution in cm2/s (0.01 cm2/s for an aqueous solution), and ω the angular velocity of the RDE in rad/s (given by ω = 2πN where N is the number of rotations/s) (Earles and Schenk, 1998; Schenk et al., 1990). By overcoming diffusion limitations, RDEV offers the advantages of sensitive, kinetically resolved, real-time measures of neurotransmitter transporter uptake, release, and efflux.
Figure 1.

Schematic diagram showing rotating disk electrode voltammetry apparatus. A potentiostat applies a 550 mV potential to a working electrode lowered into a custom glass chamber and rotated at 3000 RPM. Synaptosomes are kept at physiological temperature (37° C) by a water recirculator (solid-tip arrows). The analog signal is converted to digital and recorded on a computer. The inset shows the convective pathways of laminar solution flow (line-tip arrows) caused by rotation of the working electrode.
A Pine Instruments Inc. (Grove City, PA) AFMD03 glassy carbon electrode was used for all experiments (5 mm total diameter, 3 mm diameter glassy carbon electrode encased in 1 mm-thick Teflon sheath). Experiments were performed with tissue or buffer in a custom-made cylindrical glass chamber maintained at 37 °C by a Polyscience (Niles, IL) Series 8000 water recirculator. The electrode was connected to a Pine Instruments MSRX high-precision rotator. It was lowered into the glass chamber and rotated at 2000 RPM (for hydrodynamic voltammagram) or 3000 RPM (all other studies). Rotation rates were verified with a Model 20713A digital laser tachometer from Neiko Tools USA (Zhejiang Kangle Group Import & Export Co.Ltd., Wenzhou, China). A Bioanalytical Systems LC-4B amperometric detector (West Lafayette, IN) with a custom-modified time constant (20 ms) applied potentials relative to a Ag/AgCl reference electrode. A platinum wire was used as the auxiliary electrode. Detection currents were recorded digitally on a PC computer with an ITC-18 analog-digital converter and Ecell software from HEKA (formerly InstruTECH, Bellmore, New York) but were also monitored by a chart recorder. Data was acquired by Ecell with a 1000 Hz sample rate and a 60 Hz digital notch filter. The recorded data was converted to a waveform for analysis using Igor Pro software from WaveMetrics (Portland, OR). An Igor algorithm averaged waveforms to 10 points per second to facilitate analysis and graphing for most studies. No data averaging was performed in the analysis for the detection limit and response time studies. Statistical analyses were performed with Graphpad Prism 5 (San Diego, CA).
2.4. Data Analysis
The initial velocities of serotonin uptake were calculated from the linear slope of the initial apparent zero order portion of a plot of [5-HT] versus time after background subtraction and as described previously for RDEV assays (Earles et al., 1998). Data were normalized to protein concentration, which was quantified with a bicinchoninic acid (BCA) colorimetric based assay from Pierce (Rockford, IL) using bovine serum albumin as the standard. Data were also normalized to correct for inter-assay pipetting error and small variations in electrode response using average peak currents for assays using the same dilution of 5-HT. These values were used to calibrate an estimated ‘actual’ concentration of 5-HT added to each assay. Data are reported as average ± SEM , and the significance level was set at p<0.05. Indications of precision for values obtained by regression analyses are indicated by SER, the standard error from regression.
2.5. Electroanalytical Studies
Background-corrected hydrodynamic voltammagrams (Figure 2A, 2B) were used to define an optimum working potential for serotonin (parameters: initial potential (E) = 0 mV, high E = 550 mV, scan rate 0.67 mV/second). The number of electrons transferred from 5-HT was determined from the slope of a Nernst plot of the points along the apparent linear rising phase of the hydrodynamic voltammagram (Figure 2C) using the following equation:
| (2) |
where (log [ox]/[red]) = log [iobs/iL - iobs]. Previous studies with the same model and area of the electrode have determined iL = ~115 nA (Earles and Schenk, 1998) for two electron transfers. Figure 2B approaches 60 nA, so this was used for the analysis.
Figure 2.

Hydrodynamic voltammagram, Nernst plot, and oxidation scheme of 5-HT in physiological buffer. (A) A hydrodynamic voltammagram of 1 μM 5-HT in pH 7.4 physiological buffer and background (buffer only). Each datum point is the mean ± SEM of three separate determinations. Error bars for open circles fall within the dimensions of the symbol. (B) Expanded dotted box from Panel A shows the background-subtracted plot. (C) Nernst plot of points shown in Panel B. (D) Scheme adapted from Wrona and Dryhurst, 1990.shows that complete oxidation of serotonin liberates two electrons and one proton, while incomplete electrolysis frees a proton and an electron, producing a radical intermediate.
A continuously applied potential of 550 mV (an optimal potential as determined by hydrodynamic voltammogram studies described above) was used in calibration studies of 5-HT in physiological buffer and all subsequent studies. In all studies, drugs or vehicle (physiologic buffer) and serotonin were each added in volumes of 10 μL to 480 μL of synaptosomes or buffer for a total volume of 500 μL. A constant gentle stream of 95% O2, 5% CO2 gas was directed across the top of the chamber to maintain the buffer's oxygen saturation and pH. Oxygen saturation and pH for this buffer system have been measured previously and shown to support tissue viability (Earles and Schenk, 1998). Drugs or vehicle (10 μl) were added following application of the potential and allowed to incubate with the tissue for 15 minutes while baseline was achieved (data sampled continuously throughout with1000 Hz sample rate). Serotonin (10 μl) was added to the glass chamber using a Hamilton (Reno, NV) CR-700-20 constant rate syringe. All experiments (except for viability study described below) were carried out with synaptosomes less than four hours old from the time of their suspension in buffer. The electrode's responses to 5-HT concentrations in the presence of buffer, tissue (synaptosomes), and tissue plus paroxetine were measured across 5-HT concentrations ranging from 50 -1000 nM. A linear regression was performed on the currents versus [5-HT] to determine whether drug or tissue altered the electrode's response. Additionally, calibration studies investigated multiple applications of 5-HT with 30 second intervals between applications. The magnitude of the electrode response did not change between applications, suggesting no fouling occurs (data not shown).
The detection limit was defined as the signal at three times the root mean square (RMS) noise. Kinetic resolution of measures was determined by comparing measured response times to previously published RDEV measures of kinetic resolution of monoamine uptake (Earles and Schenk, 1998; Volz et al., 2006b). Response time is a function of 1) the response time of the instrument (20 ms time constant) and 2) how much time it takes for added 5-HT to be uniformly distributed within the chamber. Kinetic resolution of physiological events is reflected in signals that are longer the response time of the instrument plus the time required for 5-HT distribution. Biological events occurring more rapidly than the response time of the instrument cannot be detected (resolved). Response times were measured on different days with the addition of 200 nM 5-HT to the electrochemical chamber containing synaptosomes.
Estimating the amount of ‘apparent clearance’ due to the sum of serotonin oxidation and electrode drift was determined by adding 5-HT alone in buffer and normalizing the slope with the average concentration of protein from all assays.
2.6. Preparation of Synaptosomes
Unanesthetized mice were decapitated and brains were rapidly dissected out and homogenized in 10 volumes (w/v) of ice-cold sucrose buffer with a Potter Elvehjem homogenizer rotated at 540 RPM by a 10” Ryobi drill press. The whole-brain homogenate was centrifuged (1000 × g for 10 min at 4 °C) in an Eppendorf 5804R (Westbury, NY) to pellet and remove cellular debris (P1). The resulting supernatants were centrifuged (15,900 × g for 20 min at 4 °C) to obtain the crude synaptosomal pellet (P2). P2 was rinsed twice by resuspending in 15 mL physiological buffer pre-oxygenated with 95% O2, 5% CO2 gas, and recentrifuging (15,900 × g for 5 min at 4 °C) to remove any remaining sucrose. The rinsed P2 was resuspended in 5 mL oxygenated physiological buffer and maintained with 95% O2, 5% CO2 gas in a 50 mL polypropylene conical tube on ice. The tissue was gently vortexed between assays before aliquoting tissue into the electrochemical chamber. Between assays, the glass chamber was gently wiped with a cotton-tipped applicator and rinsed with 70% ethanol followed by several (7-10) water rinses. The electrode was gently rinsed with 70% ethanol and water and rotated while in contact with a damp brown velvet electrode polishing pad from a Bioanalytical Systems electrode polishing kit (West Lafayette, IN).
2.7. Viability of Synaptosomes
The tissue viability of the synaptosomes was determined by making multiple determinations of initial rates of clearance of 200 nM 5-HT over the course of seven hours and determining the length of time before the clearance rates in the tissue became significantly reduced. Because of inter-animal variability in basal clearance levels, data were normalized within animal with 100% set as the clearance rate of the tissue during the first half hour after resuspension in buffer. The order of treatments were randomized in all other studies to account for possible effects of tissue viability on results.
2.8. SERT-Mediated Uptake Studies
RDEV measurements of 5-HT uptake were made using modifications of previously published procedures used to measure dopamine uptake in rat striatal suspensions (Bjorklund et al., 2007; Earles and Schenk, 1998; Robinson et al., 2005; Volz et al., 2004; Volz and Schenk, 2004; Wayment et al., 2001) and rat vesicular preparations (Volz et al., 2006b). SERT activity was determined by subtracting the initial velocities of 5-HT clearance in the presence of 1 μM paroxetine from initial velocities measured in the presence of vehicle (physiologic buffer). The Km and Vmax for SERT was determined using curve-fitting procedures to fit velocity versus 5-HT concentration to the Michaelis-Menten equation:
| (3) |
as described by Motulsky and Christopoulos (Motulsky and Christopoulos, 2003) where v is the initial uptake velocity, Vmax the maximal uptake velocity, Km the Michaelis-Menten constant, and [5-HT] is the initial extrasynaptosomal concentration of exogenously added 5-HT. The reported values of the kinetic constants in synaptosomes from SERT +/+ mice used average initial rates determined with added 5-HT concentrations ranging from 50 – 500 nM 5-HT. The errors reported are ± standard errors of regression.
The SERT +/+, +/−, and −/− synaptosomes were used to determine whether the assay was sensitive enough to distinguish differences among genotypes, using 100 nM added 5-HT, a concentration close to the calculated Km for SERT (see Results and Discussion). Pharmacologic specificity of paroxetine was confirmed by testing the absence of an effect in SERT −/−synaptosomes.
3. RESULTS AND DISCUSSION
3.1. Hydrodynamic Voltammogram of 5-HT and Estimates of n Values for its Oxidation
The hydrodynamic voltammogram (Figure 2A) generated from three separate determinations showed that the electrode's response in the presence of 5-HT reaches a half-maximal response around 286 mV, which is the formal E0cell according to Equation 2, Thus, 550 mV was chosen as an application potential to obtain 99.999% of the oxidized form of 5-HT at the electrode surface (and not in the bulk of the sample). Then, the data were background subtracted (Figure 2B) to generate a Nernst plot (Figure 2C) according to Equation 2. The Nernst n analyses for electro-oxidation of 5-HT was 1.2 ± 0.1 electrons per mol, consistent with a reaction scheme elucidated by Wrona and Dryhurst (Wrona and Dryhurst, 1990) involving radical intermediate formation and incomplete electrolysis (Figure 2D). Their calculated n values for a range of 5-HT concentrations (0.4 – 4 mM) were 1.1 ± 0.1 to 1.2 ± 0.1 electrons as listed in Table 1 in Wrona and Dryhurst (1990).
Table 1.
Synaptosome function over time.
| Time (hours) | Clearance as a percent of Initial clearance capacity |
SEM | n |
|---|---|---|---|
| 0.0 | 100.000 | 0.000 | 5 |
| 0.5 | 97.21 | 3.06 | 4 |
| 1.0 | 95.04 | 5.60 | 4 |
| 1.5 | 94.92 | 2.70 | 5 |
| 2.0 | 90.57 | 3.69 | 5 |
| 2.5 | 87.33 | 3.97 | 5 |
| 3.0 | 85.31 | 3.03 | 5 |
| 4.0 | 81.77 | 5.69 | 4 |
| 5.0 | 77.68 | 2.33 | 5 |
| 6.0 | 78.18 | 4.59 | 5 |
| 7.0 | 69.83 | 5.40 | 5 |
Data were analyzed by a one-way ANOVA with a post hoc
Dunnett's multiple comparison test comparing each time point to a baseline measurement taken at time zero (set at 100%)
p<.05
p<.01
p<.001.
3.2. Electrode Responses to Serotonin and Effects of Tissue
Most electrochemical methods for measuring 5-HT in vivo and in vitro treat electrodes with Nafion to increase selectivity over their acid metabolites (Cahill et al., 1996; Cespuglio et al., 1986; Crespi et al., 1983; Daws and Toney, 2007; John et al., 2006; John and Jones, 2007; Perez and Andrews, 2005; Rivot et al., 1995). Nafion was not used here because the signal was obtained from direct exogenous addition of 5-HT. This also offered the advantage of eliminating alterations of electrode response times due to Nafion.
The electrode responded linearly to 5-HT concentrations (Figure 3A) and neither paroxetine nor tissue (synaptosomes) altered these linear responses. The slope of the calibration line in buffer was 0.21 ± 0.01 nA/nM (R2 = 0.9965), in tissue (synaptosomes) and paroxetine = 0.21 ± 0.01 nA/nM (R2 = 0.9971) and in synaptosomes was 0.22 ± 0.01 nA/nM (R2 = 0.9988). These slopes were determined from the maximal peak currents observed instantaneously following the additions of 5-HT. The slopes of the lines were not significantly different from each other (p=0.34).
Figure 3.

Linear electrode responses and sample oxidation current showing noise. (A) The electrode had a linear response to a physiologically relevant range of 5-HT (50 nM to 1 μM) in pH 7.4 buffer (n = 10 - 18 per concentration). The presence of tissue (synaptosomes) (n = 7 - 8 per concentration) with or without 1 μM paroxetine (n = 5 - 9 per concentration) did not affect the magnitude of the electrode's response to 5-HT. All three lines are coincident. Nearly all error bars fall within the dimensions of the symbols, and the symbols superimpose. (B) Raw data trace showing ratio of signal to noise and change in current when adding 50 nM 5-HT (arrow) to buffer. The boxed region is enlarged in the inset to show the magnitude of the noise. RMS noise was 0.33 ± 0.03 nA (n=5). This value was used with the coincident linear plots in (A) to calculate a detection limit of 4.8 ± 0.4 nM. Data are expressed as mean ± SEM.
The observation that the presence of tissue did not alter the peak current as a function of added 5-HT concentration represents a departure of RDEV from considerations relevant to other electrochemical methods. In chronoamperometry and FSCV, phenolic and hydroxyindoleic 5-HT oxidation products adsorb to the electrode, reducing electrode sensitivity and response time. Response factors for carbon-fiber electrodes used in vitro with synaptosomes decrease by up to 60% upon exposure to the sample (Perez and Andrews, 2005). Interference by oxidation products is reduced dramatically or eliminated in RDEV. In RDEV, rotation constantly delivers substrate to the electrode surface, where it is oxidized, and the majority of oxidation products are then ‘spun away’.
In contrast, methods using carbon-fiber tipped electrodes placed in tissue both in vivo and in vitro rely on diffusion for delivery of analyte to their surface where they are oxidized. The microelectrodes are ‘refreshed’ by applying reduction potentials that minimize ‘fouling’ of the electrode (Daws and Toney, 2007). Despite reducing potentials, oxidation products build-up locally and adsorb, decreasing the electrode's sensitivity to 5-HT because of diminished active surface area (Daws and Toney, 2007).
3.3. Detection Limit
The limit of detection in buffer, defined as three times RMS (Figure 3B), was 4.8 ± 0.4 nM. The detection limit for in vivo chronoamperometry is 43 ± 8 nM (Daws et al., 2005). Factors such as electrode motion, high sampling rate, and lack of need for reduction potential application may contribute to the greater sensitivity of RDEV. This is another departure of RDEV from other methods.
3.4. ‘Apparent’ Clearance by Non-Physiological Processes
The amount of ‘apparent’ clearance due to non-physiologic oxidation and electrode drift was determined by measuring the slope of a trace of 5-HT added to buffer without synaptosomes and normalizing by the average amount of protein used in these experiments (3.0 ± 0.1 mg/mL, n=30). Non-physiological ‘clearance’ decreased with increasing concentrations of added 5-HT and the total amount of exogenous 5-HT oxidized by the electrode during a typical measurement (~30 seconds) ranged from 2 - 10%, with lower concentrations (50 – 100 nM) tending to have higher percentages than higher (500 nM) concentrations. Depending on the experimental question RDEV is being used to examine, it may be desirable to subtract drift and non-physiological oxidation, especially if adding low concentrations of substrate.
3.5. Kinetic Resolution
The response time (including mixing time) was 600 ± 30 ms (n = 19), which compares with previously established kinetically resolved measures of dopamine uptake via DAT (550 ± 170 ms) (Earles and Schenk, 1998) and VMAT-2 at 2000 RPM (540 ± 40ms) (Volz et al., 2006b). Most observed transport signals occurred on a longer timescale, suggesting that RDEV measures reflect the kinetics of the physiological process with minimal effect of the time necessary to make the measurement. It should be noted here that this kinetic resolution is observed at a very moderate, fixed rotation rate. Kinetic resolution can be increased by increasing the rotation rate (Earles and Schenk, 1998).
Additional evidence supporting this conclusion also derives from the observation that paroxetine (1 μM) did not change the RDE's peak response to added 5-HT in the presence of synaptosomes. This suggests that the drug does not alter the electrode's surface chemistry. The lack of drug effect on the peak amplitude of 5-HT in synaptosomes suggests that minimal uptake occurs during the mixing-time dependent delay between substrate application and peak signal.
3.6. Synaptosomal Viability Studies
Clearance rates decreased from baseline over synaptosomal storage time with a significant (p<0.05) effect at four hours and beyond (Table 1). It may be possible to extend the lifetime of synaptosomes from a given animal beyond four hours if the buffer is replaced; however, because a typical 20 minute experiment uses 0.5 mL aliquots of tissue and a whole brain yields 5 mL of synaptosomes, the supply of sample is typically exhausted before time becomes a significant factor affecting physiology.
These data suggest synaptosomes provide a model of synaptic function that can be studied by RDEV. This result differs from previous work that yielded evidence that synaptosomes are vulnerable to mechanical disruption, thereby preventing uptake measurement (Perez and Andrews, 2005). Differences in the experimental approaches likely account for the different results. This previous work attempted to overcome the kinetic limitations of diffusion dependence via stirring with a magnetic stir bar, which would produce turbulent flow along the stationary carbon-fiber tipped electrode, perhaps shearing synaptosomes at the stir bar – chamber interface and causing irregular delivery of substrate to the electrode surface. The motion induced in RDEV causes laminar flow, delivering of substrate to a flat, smooth electrode surface at a regular rate.
3.7. Rationale for Using Whole Brain Synaptosomes
Whole brain synaptosomes were used since this experimental approach was developed to study regulatory mechanisms of SERT, not specific to a particular brain region. A clear limitation of whole brain is that it will not reflect biology relevant to specific brain regions, but rather, an average of SERT function across all brain regions. Certainly the technique could be applied for specific brain regions; however, the present study aimed to demonstrate merely that SERT function can be measured. Whole brain offers a sample preparation that is very consistent between animals and enables multiple within-animal measures to be made.
3.8. Synaptosomal Uptake Studies and SERT Kinetic Parameters
Figure 4A shows an entire time course of a 5-HT uptake uptake experiment. Complete clearance of 200 nM, defined as removal of >98% of added 5-HT occurred within four minutes. Initial velocities of serotonin uptake were calculated from the linear slope of a tangent line of the steepest portion of a plot of [5-HT] versus time (Figure 4B).
Figure 4.

Measuring 5-HT uptake with rotating disk electrode voltammetry. (A) A time course shows an entire recording of an oxidation current, from the time the potential is applied to the time that the 5-HT is completely taken up by the synaptosomal tissue. Achieving a flat baseline takes approximately 12 - 15 minutes, during which non-specific components in the preparation are oxidized by the electrode. Panel B shows expansion of dotted box in (A). (B) Initial rates are obtained from the linear slope (dotted line) of a tangent line to the steepest portion of the uptake curve, which represents the initial apparent zero order portion of the plot. Change in current/time is converted to fmol 5-HT taken up/s and normalized to protein concentrations (mg).
Figure 5A shows raw data demonstrating the effect of 1 μM paroxetine on clearance. We also tested 10 and 100 μM paroxetine and observed no additional 5-HT uptake inhibition (data not shown). SERT activity was determined by subtracting the initial rates of synaptosomes treated with 1 μM paroxetine from control (Figure 5B). The initial velocities of 5-HT uptake in control and paroxetine-treated synaptosomes from SERT+/+ mice depended on the instantaneous concentration of extrasynaptosomal 5-HT. These rates were used to determine the Km and Vmax of SERT.
Figure 5.
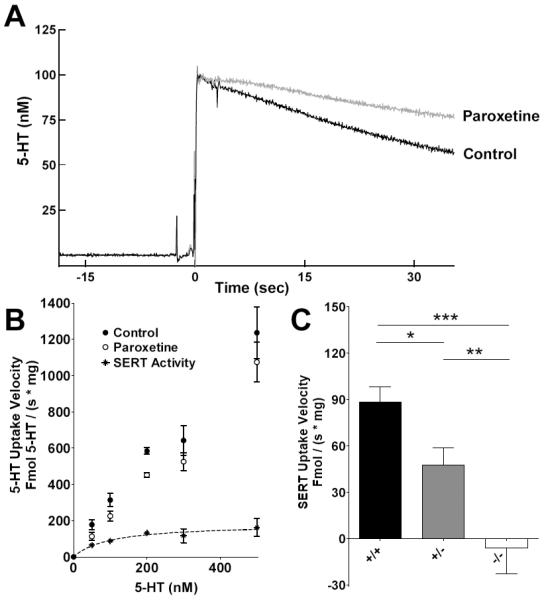
Kinetic analysis of SERT and SERT function in different SERT genotypes. (A) Raw data traces demonstrating inhibition of clearance by paroxetine in SERT +/+ synaptosomes. Background drift has been subtracted from the traces. (B) Michaelis-Menten plots showing how SERT activity in SERT +/+ synaptosomes (star symbols) is determined by subtracting initial rates in the presence of 1 μM paroxetine (open circles) from control initial rates (vehicle, closed circles). Drift was not subtracted from these data. The Km for SERT was 99 ± 35 nM and Vmax 182 ± 11 fmol / (s × mg). (C) RDEV detects differences in SERT function in synaptosomes isolated from SERT +/+, +/−, and −/− mice in taking up 100 nM 5-HT, a concentration near SERT's calculated Km. The initial velocity of SERT was 88.2 ± 10.2 fmol / (s × mg) in +/+ synaptosomes (n = 5), 47.8 ± 11.2 fmol / (s × mg) in +/− synaptosomes (n=8), and −5.8 ± 16.7 fmol / (s × mg) in −/− synaptosomes (n = 5). SERT velocity significantly differed between all pairs of genotypes: wild-type versus het, *p<0.05, +/− versus −/−, **p<0.01, wild-type versus knockout, ***p<0.001. Data are expressed as mean ± SEM. Data were analyzed by a one-way ANOVA with post hoc Newman-Keuls multiple comparisons tests comparing each pair of genotypes. The significance level was set at p<0.05.
Radioligand based uptake assays often define SERT uptake using a selective-serotonin reuptake inhibitor (SSRI). Fluoxetine is the least selective among SSRIs (Stanford, 1996), and its effect on catecholamine uptake can artificially ‘inflate’ kinetic measures of SERT depending on brain region (Norrholm et al., 2007). This accounts for some variability between radioligand studies, and underscores the importance of maximizing pharmacologic specificity when possible. In this study, DAT and NET blockers (GBR 12935 and nisoxetine) were used to improve specificity of our measurements for SERT, as described in the Methods section. Paroxetine had no effect in SERT −/− synaptosomes, suggesting it had high selectivity for SERT over nonspecific effects.
The RDEV estimate of SERT Km was 99 ± 35 nM. The Km for mouse SERT as measured by radioligand assays in mouse synaptosomes range from ~15 nM to 175 nM, depending on brain region and strain: 35.4 ± 8.4 nM in forebrain (Ansah et al., 2003), 67 ± 10 (Perez et al., 2006) in striatum, 59 ± 11 nM in hippocampus (Guiard et al., 2008), 15 ± 4 (Bengel et al., 1998) and 56 ± 5 (Perez et al., 2006) nM in brainstem, and 175 ± 9 nM (Wright et al., 1998), 122 ± 59 (O'Reilly and Reith, 1988), 57 ± 6 (Perez et al., 2006) and 45 ± 7 (Bengel et al., 1998) nM in cortex. Estimates for SERT Km from mouse synaptosomes have been reported to agree with measures made from rat synaptosomes (O'Reilly and Reith, 1988), which range from 6.7 - 111 nM depending on strain and brain region sampled (Asano et al., 1997; Fernandez et al., 2003; Martin et al., 2000; Norrholm et al., 2007; Pollier et al., 2000; Samuvel et al., 2005). The RDEV estimate of Vmax was 182 ± 11 fmol / (s × mg). Most Vmax estimates in radioligand based assays range, in mice, from ~4 - 100 fmol/(s × mg protein) (Ansah et al., 2003; Bengel et al., 1998; Chanrion et al., 2007; Guiard et al., 2008; Perez et al., 2006; Wright et al., 1998; Zhu et al., 2007). Another estimate, 200 ± 100 fmol / (s × mg), measured non-SERT uptake by substituting LiCl for NaCl (O'Reilly and Reith, 1988), a different approach to quantifying nonspecificity than more recent radioligand based studies that typically use drugs to pharmacologically isolate SERT as a single mechanism of uptake. The range for SERT Vmax in rats is 11.0-81.7 fmol/(s × mg) (Asano et al., 1997; Fernandez et al., 2003; Martin et al., 2000; Norrholm et al., 2007; Pollier et al., 2000; Reyes-Haro et al., 2003; Samuvel et al., 2005).
Some differences between RDEV and radioligand based assays clearly derive from comparing a whole brain preparation to brain subregion preparations. Vmax will depend on SERT density, which varies among brain regions (Daws and Toney, 2007). However, some methodologic factors may also contribute (Lied and Stein, 1974). A lack of oxygen in the buffer can decrease uptake rates in radiochemical analysis (Perez and Andrews, 2005). In addition, radioligand assays can lose some serotonin during the filtration process (Perez et al., 2006), which also leads to underestimation of kinetic measures. Radioligand assays do not make actual kinetic measures; the kinetics are derived from back-calculating a rate based on total accumulation of 5-HT in the tissue, which can lead to underestimation. Change in specific activity tracers in compartments throughout assays are also not typically evaluated, which also contributes to underestimation. RDEV, by contrast, provides a direct kinetic measure in real time.
In vitro chronoamperometry studies have estimated much higher values for Vmax relative to RDEV. Previous work has measured SERT kinetic constants in SERT +/+ striatal synaptosomes, where Km was 1.1 ± 0.1 μM and Vmax was 198 ± 16 pmol/(min x mg), which equates to ~3270 ± 270 fmol/(s × mg) (Perez et al., 2006). Comparatively, RDEV measured a ~10 fold lower Km and ~20 fold lower Vmax. One difference is that our study used whole brain, while previous work used pooled striata (Perez and Andrews, 2005). The other predominant differences between the methodologies are mass transfer and different time windows for acquiring the signal used to calculate uptake rates. Mass transfer conditions for clearance of 5-HT in in vitro chronoamperometry are diffusion dependent. The carbon fiber tipped electrode suspended in 2 mL synaptosomes relies solely on diffusion of 5-HT to its surface for detecting changes in ambient 5-HT concentrations.
RDEV overcomes diffusion dependence via the forced convection property of the RDEV, which rapidly and constantly delivers substrate to the electrode surface. The signal acquisition window for determining initial uptake rates is earlier in the time course of uptake for RDEV. In chronoamperometry, the rate of uptake is derived from the slope of the electrochemical signal from the time the signal decays by 20% to the time for the signal to decay by 60% (Perez and Andrews, 2005). RDEV derives its rates by using the slope of a tangent line of the steepest portion of the curve. This is typically from the time of the peak signal (which occurs in less than a second) for as long as the uptake follows zero-order kinetics (the linear portion of the uptake trace).
Several methodological differences complicate direct comparisons of RDEV kinetic measures with kinetic measures made in vivo or in slice preparations. Affinity values for 5-HT clearance in rates as determined by in vivo chronoamperometry are denoted KT to distinguish them from the in vitro kinetic measure Km. In vivo chronoamperometry and FSCV studies measure serotonin clearance, which may be comprised of multiple uptake mechanisms. Uptake signals in these studies also include diffusion away from the electrode (Montanez et al., 2003). Additionally, intact brain tissue and chopped tissue preparations have a diffusional barrier that synaptosomes lack; this barrier contributes to higher KT and Km estimates (Near et al., 1988). Mechanisms of 5-HT clearance that can skew in vivo affinity measures toward higher KT values (suggesting lower affinity) have been reviewed (Daws, 2009). Vmax isn't directly comparable between RDEV and in vivo studies since the uptake from intact brain cannot be normalized to protein.
To summarize, the most significant differences between RDEV and radiochemical methods are real-time monitoring and lack of need for filtration, which can lead to loss of ligand. Also, radioligand studies typically make kinetic estimates from single point measurements. The most significant differences between RDEV and other electrochemical methods is RDEV's capacity to isolate and model a single mechanism of clearance. Many in vivo chronoamperometry studies make a point of clarifying that their kinetic measures reflect serotonin clearance that can be due to multiple mechanisms.
3.9. Non-SERT Mechanisms of Uptake
While the scope of this study was limited to measuring serotonin transporter function, our data supports evidence gaining momentum in current literature that non-SERT mechanisms of clearance may be highly relevant to understanding the biology underlying psychiatric disorders, as well as the variability of antidepressant efficacy (reviewed by Daws, 2009). In Figure 5, panels A and B both show that paroxetine inhibition of clearance is incomplete. Our unpublished data suggests RDEV is also a useful application for pharmacologically characterizing these other 5-HT clearance mechanisms.
3.10. Sensitivity of RDEV to Functional Differences Among SERT Genotypes
To determine whether RDEV was sensitive enough to detect differences between SERT +/+ and +/− mice, we measured clearance of 100 nM 5-HT since it is near the Km, a concentration highly sensitive to differences in gene copy. RDEV significantly discriminated among the three genotypes in clearing this concentration of 5-HT (Figure 5C), with +/− synaptosomes showing 35.2 ± 20.1% of +/+ initial SERT velocity, and −/− synaptosomes showing no detectable clearance. This result is consistent with the finding of 40 - 60% reductions in SERT binding across different brain regions in SERT +/+ versus +/− mice (Perez et al., 2006). In vivo and in vitro chronoamperometry are also sensitive enough to detect differences between SERT +/+, and −/− mice (Montanez et al., 2003; Perez and Andrews, 2005; Perez et al., 2006). The original studies by Bengel and colleagues did not detect differences between SERT +/+ and +/− mice (Bengel et al., 1998); this may have been due to reduced sensitivity due to loss of radioligand during filtration (Perez et al., 2006). In vivo methods typically do not discriminate well between +/+ and +/− mice (Baganz et al., 2008; Montanez et al., 2003). In vitro chronoamperometry can distinguish between +/+ and +/− synaptosomes, but diffusion dependence impairs kinetic resolution in these studies.
4. CONCLUSION
This is an initial report demonstrating that RDEV can be used as a functional assay to measure serotonin transporter function. This study determined the experimental conditions for using RDEV to measure serotonin clearance in synaptosomes and includes the first estimates of SERT kinetic parameters obtained using RDEV. This in vitro approach complements other amperometric approaches to measuring 5-HT clearance, and offers a number of advantages. RDEV minimizes the effects of tissue and drugs in reducing electrode sensitivity (‘fouling’) and has a lower detection limit than those reported for other electrochemical methods. Concentrations of drugs, chemicals, and buffer constituents involved in the assay can be highly controlled, facilitating interpretation of results. It enables real-time kinetically resolved measurements of uptake, with improved resolution over diffusion-dependent methods. Finally, the application distinguishes functional differences between SERT genotypes.
Research Highlights.
Rotating disk voltammetry (RDEV) measures SERT function in synaptosomes.
Study includes first estimates of SERT kinetic parameters obtained using RDEV.
RDEV minimizes tissue and drug-induced decreases in sensitivity (“fouling”).
RDEV has improved kinetic resolution and detection limit compared with other methods.
RDEV distinguishes functional differences between SERT genotypes.
ACKNOWLEDGEMENTS
The authors sincerely thank Dr. Trent Volz, Dr. Paul Phillips, Dr. Ross McDevitt, Dr. Nicole Bjorklund, Dr. Michele Kelly, and Dr. Scott Ng-Evans for their feedback and technical advice, and Ms. Hannah DeMeritt for her technical assistance. We also thank Dr. Nicholas Poolos and Dr. Diane Lattemann for loaning equipment for these studies. The authors also give a special thank you to Dr. Denny Liggitt and the University of Washington's Department of Comparative Medicine for supporting this work. This work was supported by grants R01 MH63303, T32 RR07019, K01 RR024471, and the State of Washington.
Footnotes
Publisher's Disclaimer: This is a PDF file of an unedited manuscript that has been accepted for publication. As a service to our customers we are providing this early version of the manuscript. The manuscript will undergo copyediting, typesetting, and review of the resulting proof before it is published in its final citable form. Please note that during the production process errors may be discovered which could affect the content, and all legal disclaimers that apply to the journal pertain.
REFERENCES
- Amara SG, Sonders MS. Neurotransmitter transporters as molecular targets for addictive drugs. Drug Alcohol Depend. 1998;51:87–96. doi: 10.1016/s0376-8716(98)00068-4. [DOI] [PubMed] [Google Scholar]
- Ansah TA, Ramamoorthy S, Montanez S, Daws LC, Blakely RD. Calcium-dependent inhibition of synaptosomal serotonin transport by the alpha 2-adrenoceptor agonist 5-bromo-N-[4,5-dihydro-1H-imidazol-2-yl]-6-quinoxalinamine (UK14304) J Pharmacol Exp Ther. 2003;305:956–65. doi: 10.1124/jpet.102.047134. [DOI] [PubMed] [Google Scholar]
- Asano S, Matsuda T, Nakasu Y, Maeda S, Nogi H, Baba A. Inhibition by nitric oxide of the uptake of [3H]serotonin into rat brain synaptosomes. Jpn J Pharmacol. 1997;75:123–8. doi: 10.1254/jjp.75.123. [DOI] [PubMed] [Google Scholar]
- Baganz NL, Horton RE, Calderon AS, Owens WA, Munn JL, Watts LT, Koldzic-Zivanovic N, Jeske NA, Koek W, Toney GM, Daws LC. Organic cation transporter 3: Keeping the brake on extracellular serotonin in serotonin-transporter-deficient mice. Proc Natl Acad Sci U S A. 2008;105:18976–81. doi: 10.1073/pnas.0800466105. [DOI] [PMC free article] [PubMed] [Google Scholar]
- Bengel D, Murphy DL, Andrews AM, Wichems CH, Feltner D, Heils A, Mossner R, Westphal H, Lesch KP. Altered brain serotonin homeostasis and locomotor insensitivity to 3, 4-methylenedioxymethamphetamine (“Ecstasy”) in serotonin transporter-deficient mice. Mol Pharmacol. 1998;53:649–55. doi: 10.1124/mol.53.4.649. [DOI] [PubMed] [Google Scholar]
- Bjorklund NL, Volz TJ, Schenk JO. Differential effects of Zn(2+) on the kinetics and cocaine inhibition of dopamine transport by the human and rat dopamine transporters. Eur J Pharmacol. 2007 doi: 10.1016/j.ejphar.2007.02.027. [DOI] [PubMed] [Google Scholar]
- Blackburn KJ, French PC, Merrills RJ. 5-Hydroxytryptamine uptake by rat brain in vitro. Life Sci. 1967;6:1653–63. doi: 10.1016/0024-3205(67)90176-2. [DOI] [PubMed] [Google Scholar]
- Blakely RD, De Felice LJ, Hartzell HC. Molecular physiology of norepinephrine and serotonin transporters. J Exp Biol. 1994;196:263–81. doi: 10.1242/jeb.196.1.263. [DOI] [PubMed] [Google Scholar]
- Blakely RD, Ramamoorthy S, Schroeter S, Qian Y, Apparsundaram S, Galli A, DeFelice LJ. Regulated phosphorylation and trafficking of antidepressant-sensitive serotonin transporter proteins. Biol Psychiatry. 1998;44:169–78. doi: 10.1016/s0006-3223(98)00124-3. [DOI] [PubMed] [Google Scholar]
- Bloch MH, Landeros-Weisenberger A, Sen S, Dombrowski P, Kelmendi B, Coric V, Pittenger C, Leckman JF. Association of the serotonin transporter polymorphism and obsessive-compulsive disorder: systematic review. Am J Med Genet B Neuropsychiatr Genet. 2008;147B:850–8. doi: 10.1002/ajmg.b.30699. [DOI] [PubMed] [Google Scholar]
- Bunin MA, Wightman RM. Paracrine neurotransmission in the CNS: involvement of 5-HT. Trends Neurosci. 1999;22:377–82. doi: 10.1016/s0166-2236(99)01410-1. [DOI] [PubMed] [Google Scholar]
- Burnette WB, Bailey MD, Kukoyi S, Blakely RD, Trowbridge CG, Justice JB., Jr. Human norepinephrine transporter kinetics using rotating disk electrode voltammetry. Anal Chem. 1996;68:2932–8. doi: 10.1021/ac960022x. [DOI] [PubMed] [Google Scholar]
- Cahill PS, Walker QD, Finnegan JM, Mickelson GE, Travis ER, Wightman RM. Microelectrodes for the measurement of catecholamines in biological systems. Anal Chem. 1996;68:3180–6. doi: 10.1021/ac960347d. [DOI] [PubMed] [Google Scholar]
- Caspi A, Sugden K, Moffitt TE, Taylor A, Craig IW, Harrington H, McClay J, Mill J, Martin J, Braithwaite A, Poulton R. Influence of life stress on depression: moderation by a polymorphism in the 5-HTT gene. Science. 2003;301:386–9. doi: 10.1126/science.1083968. [DOI] [PubMed] [Google Scholar]
- Cespuglio R, Sarda N, Gharib A, Faradji H, Chastrette N. Differential pulse voltammetry in vivo with working carbon fiber electrodes: 5-hydroxyindole compounds or uric acid detection? Exp Brain Res. 1986;64:589–95. doi: 10.1007/BF00340496. [DOI] [PubMed] [Google Scholar]
- Chanrion B, Mannoury la Cour C, Bertaso F, Lerner-Natoli M, Freissmuth M, Millan MJ, Bockaert J, Marin P. Physical interaction between the serotonin transporter and neuronal nitric oxide synthase underlies reciprocal modulation of their activity. Proc Natl Acad Sci U S A. 2007 doi: 10.1073/pnas.0610964104. [DOI] [PMC free article] [PubMed] [Google Scholar]
- Chen N, Appell M, Berfield JL, Reith ME. Inhibition by arachidonic acid and other fatty acids of dopamine uptake at the human dopamine transporter. Eur J Pharmacol. 2003;478:89–95. doi: 10.1016/j.ejphar.2003.08.045. [DOI] [PubMed] [Google Scholar]
- Chen N, Justice JB., Jr. Cocaine acts as an apparent competitive inhibitor at the outward-facing conformation of the human norepinephrine transporter: kinetic analysis of inward and outward transport. J Neurosci. 1998;18:10257–68. doi: 10.1523/JNEUROSCI.18-24-10257.1998. [DOI] [PMC free article] [PubMed] [Google Scholar]
- Chen N, Trowbridge CG, Justice JB., Jr. Cationic modulation of human dopamine transporter: dopamine uptake and inhibition of uptake. J Pharmacol Exp Ther. 1999;290:940–9. [PubMed] [Google Scholar]
- Chen N, Trowbridge CG, Justice JB., Jr. Voltammetric studies on mechanisms of dopamine efflux in the presence of substrates and cocaine from cells expressing human norepinephrine transporter. J Neurochem. 1998;71:653–65. doi: 10.1046/j.1471-4159.1998.71020653.x. [DOI] [PubMed] [Google Scholar]
- Collier DA, Stober G, Li T, Heils A, Catalano M, Di Bella D, Arranz MJ, Murray RM, Vallada HP, Bengel D, Muller CR, Roberts GW, Smeraldi E, Kirov G, Sham P, Lesch KP. A novel functional polymorphism within the promoter of the serotonin transporter gene: possible role in susceptibility to affective disorders. Mol Psychiatry. 1996;1:453–60. [PubMed] [Google Scholar]
- Crespi F, Cespuglio R, Jouvet M. Differential pulse voltammetry in brain tissue: III. Mapping of the rat serotoninergic raphe nuclei by electrochemical detection of 5-HIAA. Brain Res. 1983;270:45–54. doi: 10.1016/0006-8993(83)90790-4. [DOI] [PubMed] [Google Scholar]
- Davids E, Zhang K, Kula NS, Tarazi FI, Baldessarini RJ. Effects of norepinephrine and serotonin transporter inhibitors on hyperactivity induced by neonatal 6-hydroxydopamine lesioning in rats. J Pharmacol Exp Ther. 2002;301:1097–102. doi: 10.1124/jpet.301.3.1097. [DOI] [PubMed] [Google Scholar]
- Daws LC. Unfaithful neurotransmitter transporters: focus on serotonin uptake and implications for antidepressant efficacy. Pharmacol Ther. 2009;121:89–99. doi: 10.1016/j.pharmthera.2008.10.004. [DOI] [PMC free article] [PubMed] [Google Scholar]
- Daws LC, Montanez S, Owens WA, Gould GG, Frazer A, Toney GM, Gerhardt GA. Transport mechanisms governing serotonin clearance in vivo revealed by high-speed chronoamperometry. J Neurosci Methods. 2005;143:49–62. doi: 10.1016/j.jneumeth.2004.09.011. [DOI] [PubMed] [Google Scholar]
- Daws LC, Toney GM. High-speed chronoamperometry to study kinetics and mechanisms for serotonin clearance in vivo. In: Michael AC, Borland LM, editors. Electrochemical Methods for Neuroscience. CRC Press; Boca Raton, FL: 2007. pp. 63–81. [PubMed] [Google Scholar]
- Daws LC, Toney GM, Davis DJ, Gerhardt GA, Frazer A. In vivo chronoamperometric measurements of the clearance of exogenously applied serotonin in the rat dentate gyrus. J Neurosci Methods. 1997;78:139–50. doi: 10.1016/s0165-0270(97)00144-1. [DOI] [PubMed] [Google Scholar]
- Daws LC, Toney GM, Gerhardt GA, Frazer A. In vivo chronoamperometric measures of extracellular serotonin clearance in rat dorsal hippocampus: contribution of serotonin and norepinephrine transporters. J Pharmacol Exp Ther. 1998;286:967–76. [PubMed] [Google Scholar]
- Earles C, Schenk JO. Rotating disk electrode voltammetric measurements of dopamine transporter activity: an analytical evaluation. Anal Biochem. 1998;264:191–8. doi: 10.1006/abio.1998.2850. [DOI] [PubMed] [Google Scholar]
- Earles C, Wayment H, Green M, Schenk JO. Resolution of biogenic amine transporter kinetics by rotating disk electrode voltammetry: methodology and mechanistic interpretations. Methods Enzymol. 1998;296:660–75. doi: 10.1016/s0076-6879(98)96047-5. [DOI] [PubMed] [Google Scholar]
- Earles CA, Bai J, Wang P, Chapman ER. The tandem C2 domains of synaptotagmin contain redundant Ca2+ binding sites that cooperate to engage t-SNAREs and trigger exocytosis. J Cell Biol. 2001;154:1117–23. doi: 10.1083/jcb.200105020. [DOI] [PMC free article] [PubMed] [Google Scholar]
- Fernandez F, Sarre S, Launay JM, Aguerre S, Guyonnet-Duperat V, Moisan MP, Ebinger G, Michotte Y, Mormede P, Chaouloff F. Rat strain differences in peripheral and central serotonin transporter protein expression and function. Eur J Neurosci. 2003;17:494–506. doi: 10.1046/j.1460-9568.2003.02473.x. [DOI] [PubMed] [Google Scholar]
- Fox MA, Jensen CL, French HT, Stein AR, Huang SJ, Tolliver TJ, Murphy DL. Neurochemical, behavioral, and physiological effects of pharmacologically enhanced serotonin levels in serotonin transporter (SERT)-deficient mice. Psychopharmacology (Berl) 2008;201:203–18. doi: 10.1007/s00213-008-1268-7. [DOI] [PMC free article] [PubMed] [Google Scholar]
- Frazer A, Daws LC. Serotonin transporter function in vivo: assessment by chronoamperometry. Ann N Y Acad Sci. 1998;861:217–29. doi: 10.1111/j.1749-6632.1998.tb10193.x. [DOI] [PubMed] [Google Scholar]
- Garreau L, Emond P, Belzung C, Guilloteau D, Frangin Y, Besnard JC, Chalon S. N-(3-lodoprop-2E-enyl)-2beta-carbomethoxy-3beta-(3′,4′-dichloro phenyl)nortropane (beta-CDIT), a tropane derivative: pharmacological characterization as a specific ligand for the dopamine transporter in the rodent brain. J Pharmacol Exp Ther. 1997;282:467–74. [PubMed] [Google Scholar]
- Guiard BP, David DJ, Deltheil T, Chenu F, Le Maitre E, Renoir T, Leroux-Nicollet I, Sokoloff P, Lanfumey L, Hamon M, Andrews AM, Hen R, Gardier AM. Brain-derived neurotrophic factor-deficient mice exhibit a hippocampal hyperserotonergic phenotype. Int J Neuropsychopharmacol. 2008;11:79–92. doi: 10.1017/S1461145707007857. [DOI] [PubMed] [Google Scholar]
- Hashemi P, Dankoski EC, Petrovic J, Keithley RB, Wightman RM. Voltammetric detection of 5-hydroxytryptamine release in the rat brain. Anal Chem. 2009;81:9462–71. doi: 10.1021/ac9018846. [DOI] [PMC free article] [PubMed] [Google Scholar]
- Huang T, Kissinger PT. Liquid chromatographic determination of serotonin in homogenized dog intestine and rat brain tissue using a 2 mm i.d. PEEK Column. Current Separations. 1996;14:114–9. [Google Scholar]
- Hyttel J, Larsen JJ. Neurochemical profile of Lu 19-005, a potent inhibitor of uptake of dopamine, noradrenaline, and serotonin. J Neurochem. 1985;44:1615–22. doi: 10.1111/j.1471-4159.1985.tb08803.x. [DOI] [PubMed] [Google Scholar]
- Iversen L. Role of transmitter uptake mechanisms in synaptic neurotransmission. Br J Pharmacol. 1971;41:571–91. doi: 10.1111/j.1476-5381.1971.tb07066.x. [DOI] [PMC free article] [PubMed] [Google Scholar]
- John CE, Budygin EA, Mateo Y, Jones SR. Neurochemical characterization of the release and uptake of dopamine in ventral tegmental area and serotonin in substantia nigra of the mouse. J Neurochem. 2006;96:267–82. doi: 10.1111/j.1471-4159.2005.03557.x. [DOI] [PubMed] [Google Scholar]
- John CE, Jones SR. Voltammetric characterization of the effect of monoamine uptake inhibitors and releasers on dopamine and serotonin uptake in mouse caudate-putamen and substantia nigra slices. Neuropharmacology. 2007 doi: 10.1016/j.neuropharm.2007.03.004. [DOI] [PMC free article] [PubMed] [Google Scholar]
- Kissinger PT, Hart JB, Adams RN. Voltammetry in brain tissue: a new neurophysiolgical measurement. Brain Res. 1973;55:209–13. doi: 10.1016/0006-8993(73)90503-9. [DOI] [PubMed] [Google Scholar]
- Li Q, Ma L, Innis RB, Seneca N, Ichise M, Huang H, Laruelle M, Murphy DL. Pharmacological and genetic characterization of two selective serotonin transporter ligands: 2-[2-(dimethylaminomethylphenylthio)]-5-fluoromethylphenylamine (AFM) and 3-amino-4-[2-(dimethylaminomethyl-phenylthio)]benzonitrile (DASB) J Pharmacol Exp Ther. 2004;308:481–6. doi: 10.1124/jpet.103.058636. [DOI] [PubMed] [Google Scholar]
- Lied WR, Stein WD. Biochim Biophys Acta. 1974;373:178–96. doi: 10.1016/0005-2736(74)90144-8. [DOI] [PubMed] [Google Scholar]
- Martin C, Duclos M, Mormede P, Manier G, Chaouloff F. Hippocampal and striatal [(3)H]5-HT reuptake under acute stressors in two rat strains differing for their emotivity. Neurosci Lett. 2000;288:246–8. doi: 10.1016/s0304-3940(00)01246-5. [DOI] [PubMed] [Google Scholar]
- McElvain JS, Schenk JO. Blockade of dopamine autoreceptors by haloperidol and the apparent dynamics of potassium-stimulated endogenous release of dopamine from and reuptake into striatal suspensions in the rat. Neuropharmacology. 1992a;31:649–59. doi: 10.1016/0028-3908(92)90143-d. [DOI] [PubMed] [Google Scholar]
- McElvain JS, Schenk JO. A multisubstrate mechanism of striatal dopamine uptake and its inhibition by cocaine. Biochem Pharmacol. 1992b;43:2189–99. doi: 10.1016/0006-2952(92)90178-l. [DOI] [PubMed] [Google Scholar]
- Meiergerd SM, Schenk JO. The measurement of the neuronal transport of biogenic amine in the kinetic domain. In: Baker G, Adams RN, editors. Neuromethods. CRC Press; Boca Raton: 1996. p. 21. [Google Scholar]
- Michael AC, Borland LM. An introduction to electrochemical methods in neuroscience. In: Michael AC, Borland LM, editors. Electrochemical Methods for Neuroscience. CRC Press; Boca Raton, FL: 2007. pp. 1–15. [Google Scholar]
- Miner LH, Schroeter S, Blakely RD, Sesack SR. Ultrastructural localization of the serotonin transporter in superficial and deep layers of the rat prelimbic prefrontal cortex and its spatial relationship to dopamine terminals. J Comp Neurol. 2000;427:220–34. doi: 10.1002/1096-9861(20001113)427:2<220::aid-cne5>3.0.co;2-p. [DOI] [PubMed] [Google Scholar]
- Montanez S, Owens WA, Gould GG, Murphy DL, Daws LC. Exaggerated effect of fluvoxamine in heterozygote serotonin transporter knockout mice. J Neurochem. 2003;86:210–9. doi: 10.1046/j.1471-4159.2003.01836.x. [DOI] [PubMed] [Google Scholar]
- Motulsky H, Christopoulos A. Fitting Models to Biological Data using Linear and Nonlinear Regression: a practical guide to curve fitting. GraphPad Software Inc; San Diego, CA: 2003. pp. 245–51. [Google Scholar]
- Murphy DL, Fox MA, Timpano KR, Moya PR, Ren-Patterson R, Andrews AM, Holmes A, Lesch KP, Wendland JR. How the serotonin story is being rewritten by new gene-based discoveries principally related to SLC6A4, the serotonin transporter gene, which functions to influence all cellular serotonin systems. Neuropharmacology. 2008;55:932–60. doi: 10.1016/j.neuropharm.2008.08.034. [DOI] [PMC free article] [PubMed] [Google Scholar]
- Murphy DL, Li Q, Engel S, Wichems C, Andrews A, Lesch KP, Uhl G. Genetic perspectives on the serotonin transporter. Brain Res Bull. 2001;56:487–94. doi: 10.1016/s0361-9230(01)00622-0. [DOI] [PubMed] [Google Scholar]
- Murphy DL, Zohar J, Benkelfat C, Pato MT, Pigott TA, Insel TR. Obsessive-compulsive disorder as a 5-HT subsystem-related behavioural disorder. Br J Psychiatry Suppl. 1989:15–24. [PubMed] [Google Scholar]
- Near JA, Bigelow JC, Wightman RM. Comparison of uptake of dopamine in rat striatal chopped tissue and synaptosomes. J Pharmacol Exp Ther. 1988;245:921–7. [PubMed] [Google Scholar]
- Norrholm SD, Horton DB, Dwoskin LP. The promiscuity of the dopamine transporter: Implications for the kinetic analysis of [(3)H]serotonin uptake in rat hippocampal and striatal synaptosomes. Neuropharmacology. 2007;53:982–9. doi: 10.1016/j.neuropharm.2007.10.001. [DOI] [PMC free article] [PubMed] [Google Scholar]
- O'Reilly CA, Reith ME. Uptake of [3H]serotonin into plasma membrane vesicles from mouse cerebral cortex. J Biol Chem. 1988;263:6115–21. [PubMed] [Google Scholar]
- Ogilvie AD, Harmar AJ. Association between the serotonin transporter gene and affective disorder: the evidence so far. Mol Med. 1997;3:90–3. [PMC free article] [PubMed] [Google Scholar]
- Perez XA, Andrews AM. Chronoamperometry to determine differential reductions in uptake in brain synaptosomes from serotonin transporter knockout mice. Anal Chem. 2005;77:818–26. doi: 10.1021/ac049103g. [DOI] [PubMed] [Google Scholar]
- Perez XA, Bianco LE, Andrews AM. Filtration disrupts synaptosomes during radiochemical analysis of serotonin uptake: comparison with chronoamperometry in SERT knockout mice. J Neurosci Methods. 2006;154:245–55. doi: 10.1016/j.jneumeth.2005.12.017. [DOI] [PubMed] [Google Scholar]
- Pickel VM, Chan J. Ultrastructural localization of the serotonin transporter in limbic and motor compartments of the nucleus accumbens. J Neurosci. 1999;19:7356–66. doi: 10.1523/JNEUROSCI.19-17-07356.1999. [DOI] [PMC free article] [PubMed] [Google Scholar]
- Pollier F, Sarre S, Aguerre S, Ebinger G, Mormede P, Michotte Y, Chaouloff F. Serotonin reuptake inhibition by citalopram in rat strains differing for their emotionality. Neuropsychopharmacology. 2000;22:64–76. doi: 10.1016/S0893-133X(99)00092-5. [DOI] [PubMed] [Google Scholar]
- Prasad HC, Steiner JA, Sutcliffe JS, Blakely RD. Enhanced activity of human serotonin transporter variants associated with autism. Philos Trans R Soc Lond B Biol Sci. 2009;364:163–73. doi: 10.1098/rstb.2008.0143. [DOI] [PMC free article] [PubMed] [Google Scholar]
- Quick MW. Regulating the conducting states of a mammalian serotonin transporter. Neuron. 2003;40:537–49. doi: 10.1016/s0896-6273(03)00605-6. [DOI] [PubMed] [Google Scholar]
- Reed B, Chen N, Justice JB., Jr. Dual-electrode voltammetry of catecholamine transport: simultaneous monitoring of uptake and efflux. J Neurosci Methods. 2003;126:127–35. doi: 10.1016/s0165-0270(03)00073-6. [DOI] [PubMed] [Google Scholar]
- Ressler KJ, Nemeroff CB. Role of serotonergic and noradrenergic systems in the pathophysiology of depression and anxiety disorders. Depress Anxiety. 2000;12(Suppl 1):2–19. doi: 10.1002/1520-6394(2000)12:1+<2::AID-DA2>3.0.CO;2-4. [DOI] [PubMed] [Google Scholar]
- Reyes-Haro D, Garcia-Alcocer G, Miledi R, Garcia-Colunga J. Uptake of serotonin by adult rat corpus callosum is partially reduced by common antidepressants. J Neurosci Res. 2003;74:97–102. doi: 10.1002/jnr.10724. [DOI] [PubMed] [Google Scholar]
- Risch N, Herrell R, Lehner T, Liang KY, Eaves L, Hoh J, Griem A, Kovacs M, Ott J, Merikangas KR. Interaction between the serotonin transporter gene (5-HTTLPR), stressful life events, and risk of depression: a meta-analysis. JAMA. 2009;301:2462–71. doi: 10.1001/jama.2009.878. [DOI] [PMC free article] [PubMed] [Google Scholar]
- Rivot JP, Cespuglio R, Puig S, Jouvet M, Besson JM. In vivo electrochemical monitoring of serotonin in spinal dorsal horn with Nafion-coated multi-carbon fiber electrodes. J Neurochem. 1995;65:1257–63. doi: 10.1046/j.1471-4159.1995.65031257.x. [DOI] [PubMed] [Google Scholar]
- Robinson DL, Volz TJ, Schenk JO, Wightman RM. Acute ethanol decreases dopamine transporter velocity in rat striatum: in vivo and in vitro electrochemical measurements. Alcohol Clin Exp Res. 2005;29:746–55. doi: 10.1097/01.alc.0000164362.21484.14. [DOI] [PubMed] [Google Scholar]
- Rothman RB, Baumann MH, Dersch CM, Romero DV, Rice KC, Carroll FI, Partilla JS. Amphetamine-type central nervous system stimulants release norepinephrine more potently than they release dopamine and serotonin. Synapse. 2001;39:32–41. doi: 10.1002/1098-2396(20010101)39:1<32::AID-SYN5>3.0.CO;2-3. [DOI] [PubMed] [Google Scholar]
- Rudnick G. Serotonin transporters--structure and function. J Membr Biol. 2006;213:101–10. doi: 10.1007/s00232-006-0878-4. [DOI] [PubMed] [Google Scholar]
- Samuvel DJ, Jayanthi LD, Bhat NR, Ramamoorthy S. A role for p38 mitogen-activated protein kinase in the regulation of the serotonin transporter: evidence for distinct cellular mechanisms involved in transporter surface expression. J Neurosci. 2005;25:29–41. doi: 10.1523/JNEUROSCI.3754-04.2005. [DOI] [PMC free article] [PubMed] [Google Scholar]
- Schain RJ, Freedman DX. Studies on 5-hydroxyindole metabolism in autistic and other mentally retarded children. J Pediatr. 1961;58:315–20. doi: 10.1016/s0022-3476(61)80261-8. [DOI] [PubMed] [Google Scholar]
- Schenk JO. The functioning neuronal transporter for dopamine: kinetic mechanisms and effects of amphetamines, cocaine and methylphenidate. Prog Drug Res. 2002;59:111–31. doi: 10.1007/978-3-0348-8171-5_4. [DOI] [PubMed] [Google Scholar]
- Schenk JO, Patterson TA, McElvain JS. Rotating disk electrode voltammetryic measurements in neurobiology and neuropharmacology. Trends Anal Chem. 1990;9:325–30. [Google Scholar]
- Schenk JO, Wright C, Bjorklund N. Unraveling neuronal dopamine transporter mechanisms with rotating disk electrode voltammetry. J Neurosci Methods. 2005;143:41–7. doi: 10.1016/j.jneumeth.2004.09.021. [DOI] [PubMed] [Google Scholar]
- Serretti A, Calati R, Mandelli L, De Ronchi D. Serotonin transporter gene variants and behavior: a comprehensive review. Curr Drug Targets. 2006;7:1659–69. doi: 10.2174/138945006779025419. [DOI] [PubMed] [Google Scholar]
- Shaskan EG, Snyder SH. Kinetics of serotonin accumulation into slices from rat brain: relationship to catecholamine uptake. J Pharmacol Exp Ther. 1970;175:404–18. [PubMed] [Google Scholar]
- Sleipness EP, Jansen HT, Schenk JO, Sorg BA. Time-of-day differences in dopamine clearance in the rat medial prefrontal cortex and nucleus accumbens. Synapse. 2008;62:877–85. doi: 10.1002/syn.20552. [DOI] [PMC free article] [PubMed] [Google Scholar]
- Stanford SC. Prozac: panacea or puzzle? Trends Pharmacol Sci. 1996;17:150–4. doi: 10.1016/0165-6147(96)81591-4. [DOI] [PubMed] [Google Scholar]
- Steiner JA, Carneiro AM, Blakely RD. Going with the flow: trafficking-dependent and -independent regulation of serotonin transport. Traffic. 2008;9:1393–402. doi: 10.1111/j.1600-0854.2008.00757.x. [DOI] [PMC free article] [PubMed] [Google Scholar]
- Sulzer D, Edwards RH. Antidepressants and the monoamine masquerade. Neuron. 2005;46:1–2. doi: 10.1016/j.neuron.2005.03.013. [DOI] [PubMed] [Google Scholar]
- Sur C, Betz H, Schloss P. Immunocytochemical detection of the serotonin transporter in rat brain. Neuroscience. 1996;73:217–31. doi: 10.1016/0306-4522(96)00030-9. [DOI] [PubMed] [Google Scholar]
- Vergne DE, Nemeroff CB. The interaction of serotonin transporter gene polymorphisms and early adverse life events on vulnerability for major depression. Curr Psychiatry Rep. 2006;8:452–7. doi: 10.1007/s11920-006-0050-y. [DOI] [PubMed] [Google Scholar]
- Volz TJ, Farnsworth SJ, Hanson GR, Fleckenstein AE. Measurement of plasmalemmal dopamine transport, vesicular dopamine transport, and K(+)-stimulated dopamine release in frozen rat brain tissue. J Neurosci Methods. 2009a;180:317–20. doi: 10.1016/j.jneumeth.2009.03.015. [DOI] [PMC free article] [PubMed] [Google Scholar]
- Volz TJ, Farnsworth SJ, Hanson GR, Fleckenstein AE. Method development and validation of an in vitro model of the effects of methylphenidate on membrane-associated synaptic vesicles. J Neurosci Methods. 2009b;177:177–82. doi: 10.1016/j.jneumeth.2008.10.004. [DOI] [PMC free article] [PubMed] [Google Scholar]
- Volz TJ, Farnsworth SJ, King JL, Riddle EL, Hanson GR, Fleckenstein AE. Methylphenidate administration alters vesicular monoamine transporter-2 function in cytoplasmic and membrane-associated vesicles. J Pharmacol Exp Ther. 2007;323:738–45. doi: 10.1124/jpet.107.126888. [DOI] [PubMed] [Google Scholar]
- Volz TJ, Farnsworth SJ, Rowley SD, Hanson GR, Fleckenstein AE. Age-dependent differences in dopamine transporter and vesicular monoamine transporter-2 function and their implications for methamphetamine neurotoxicity. Synapse. 2009c;63:147–51. doi: 10.1002/syn.20580. [DOI] [PMC free article] [PubMed] [Google Scholar]
- Volz TJ, Farnsworth SJ, Rowley SD, Hanson GR, Fleckenstein AE. Methylphenidate-induced increases in vesicular dopamine sequestration and dopamine release in the striatum: the role of muscarinic and dopamine D2 receptors. J Pharmacol Exp Ther. 2008;327:161–7. doi: 10.1124/jpet.108.139386. [DOI] [PMC free article] [PubMed] [Google Scholar]
- Volz TJ, Hanson GR, Fleckenstein AE. Kinetic analysis of developmental changes in vesicular monoamine transporter-2 function. Synapse. 2006a;60:474–7. doi: 10.1002/syn.20321. [DOI] [PubMed] [Google Scholar]
- Volz TJ, Hanson GR, Fleckenstein AE. Measurement of kinetically resolved vesicular dopamine uptake and efflux using rotating disk electrode voltammetry. J Neurosci Methods. 2006b;155:109–15. doi: 10.1016/j.jneumeth.2006.01.002. [DOI] [PubMed] [Google Scholar]
- Volz TJ, Kim M, Schenk JO. Covalent and noncovalent chemical modifications of arginine residues decrease dopamine transporter activity. Synapse. 2004;52:272–82. doi: 10.1002/syn.20021. [DOI] [PubMed] [Google Scholar]
- Volz TJ, Schenk JO. L-arginine increases dopamine transporter activity in rat striatum via a nitric oxide synthase-dependent mechanism. Synapse. 2004;54:173–82. doi: 10.1002/syn.20075. [DOI] [PubMed] [Google Scholar]
- Wang CT, Grishanin R, Earles CA, Chang PY, Martin TF, Chapman ER, Jackson MB. Synaptotagmin modulation of fusion pore kinetics in regulated exocytosis of dense-core vesicles. Science. 2001;294:1111–5. doi: 10.1126/science.1064002. [DOI] [PubMed] [Google Scholar]
- Wayment HK, Schenk JO, Sorg BA. Characterization of extracellular dopamine clearance in the medial prefrontal cortex: role of monoamine uptake and monoamine oxidase inhibition. J Neurosci. 2001;21:35–44. doi: 10.1523/JNEUROSCI.21-01-00035.2001. [DOI] [PMC free article] [PubMed] [Google Scholar]
- Weizman A, Weizman R. Serotonin transporter polymorphism and response to SSRIs in major depression and relevance to anxiety disorders and substance abuse. Pharmacogenomics. 2000;1:335–41. doi: 10.1517/14622416.1.3.335. [DOI] [PubMed] [Google Scholar]
- Whittaker VP. The Separation of Synaptic Vesicles from Nerve-Ending Particles (‘Synaptosomes’) Biochem. J. 1963;90:293–303. doi: 10.1042/bj0900293. [DOI] [PMC free article] [PubMed] [Google Scholar]
- Whittaker VP. Thirty years of synaptosome research. J Neurocytol. 1993;22:735–42. doi: 10.1007/BF01181319. [DOI] [PubMed] [Google Scholar]
- Wright AM, Bempong J, Kirby ML, Barlow RL, Bloomquist JR. Effects of haloperidol metabolites on neurotransmitter uptake and release: possible role in neurotoxicity and tardive dyskinesia. Brain Res. 1998;788:215–22. doi: 10.1016/s0006-8993(97)01551-5. [DOI] [PubMed] [Google Scholar]
- Wrona MZ, Dryhurst G. Electrochemical oxidation of 5-hydroxytryptamine in aqueous solution at physiological pH. Bioorg Chem. 1990;18:291–317. [Google Scholar]
- Zhou FC, Tao-Cheng JH, Segu L, Patel T, Wang Y. Serotonin transporters are located on the axons beyond the synaptic junctions: anatomical and functional evidence. Brain Res. 1998;805:241–54. doi: 10.1016/s0006-8993(98)00691-x. [DOI] [PubMed] [Google Scholar]
- Zhu CB, Steiner JA, Munn JL, Daws LC, Hewlett WA, Blakely RD. Rapid stimulation of presynaptic serotonin transport by A3 adenosine receptors. J Pharmacol Exp Ther. 2007 doi: 10.1124/jpet.107.121665. [DOI] [PubMed] [Google Scholar]