


Abstract
Although circulating DNA (ctDNA) could be an attractive tool for early cancer detection, diagnosis, prognosis, monitoring or prediction of response to therapies, knowledge on its origin, form and rate of release is poor and often contradictory. Here, we describe an experimental system to systematically examine these aspects. Nude mice were xenografted with human HT29 or SW620 colorectal carcinoma (CRC) cells and ctDNA was analyzed by Q–PCR with highly specific and sensitive primer sets at different times post-graft. We could discriminate ctDNA from normal (murine) cells and from mutated and non-mutated tumor (human) cells by using species-specific KRAS or PSAT1 primers and by assessing the presence of the BRAF V600E mutation. The concentration of human (mutated and non-mutated) ctDNA increased significantly with tumor growth. Conversely, and differently from previous studies, low, constant level of mouse ctDNA was observed, thus facilitating the study of mutated and non-mutated tumor derived ctDNA. Finally, analysis of ctDNA fragmentation confirmed the predominance of low-size fragments among tumor ctDNA from mice with bigger tumors. Higher ctDNA fragmentation was also observed in plasma samples from three metastatic CRC patients in comparison to healthy individuals. Our data confirm the predominance of mononucleosome-derived fragments in plasma from xenografted animals and, as a consequence, of apoptosis as a source of ctDNA, in particular for tumor-derived ctDNA. Altogether, our results suggest that ctDNA features vary during CRC tumor development and our experimental system might be a useful tool to follow such variations.
INTRODUCTION
Extracellular or cell-free nucleic acids (DNA and RNA) have been detected in several body fluids such as blood, urine, stools, milk, bronchial lavages or ascites. Circulating DNA (ctDNA) was first found in plasma samples by Mandel and Metais (1) and, only many years later, Stroun and coworkers determined that ctDNA in cancer patients’ plasma originated from tumor cells (2). Technical advances in the detection and quantification of RNA and DNA have widened the possibilities of molecular diagnosis and monitoring of diseases (3). Specifically, ctDNA was found to carry tumor-associated genetic alterations and thus, for more than a decade, it has been considered as a potential cancer diagnostic marker for a non-invasive test (3,4).
Indeed, many cancer patients present increased plasma/serum concentration of ctDNA in comparison to the majority of the healthy subjects tested (reviewed by Fleischhacker and Schmidt) (5), although inflammation, trauma or exhaustive exercise can lead to higher plasma/serum ctDNA concentrations also in controls. Moreover, increased amount of plasma ctDNA is observed as the tumor progresses (4–6) and high ctDNA level are found in patients with advanced disease (7–10) or metastases (7) and ctDNA levels higher than 1000 ng/ml significantly correlate with shorter survival (11). However, despite the numerous studies on this subject, there is no consensus about the correlation between ctDNA concentration and tumor stage, location and size (3,4,9).
In cancer patients, ctDNA originates from both normal and tumor cells since ctDNA containing cancer-related mutations appears to contribute only to a minor fraction of the total ctDNA detected in plasma (12). The presence of ctDNA in the circulation could be ascribed to different causes such as apoptosis, necrosis, direct release and release from macrophages/scavengers following absorption of necrotic cells (12,13). Such events might arise in tumor cells as well as in normal cells which surround the tumor (12). The relative contribution of such mechanisms in ctDNA release in blood circulation has not been clarified yet.
ctDNA half life has been estimated at about 16 min (10,12), suggesting that ctDNA is not ‘naked’ but rather complexed with cellular or non-cellular components. ctDNA physico-chemical characteristics are poorly documented but it might be associated with cell membrane parts, specific or non-specific DNA-binding proteins (14), apoptotic bodies (15) or multi-nucleosome complexes (16,17). Discrepancies about ctDNA size in serum/plasma exist in the literature certainly due to technical limitations. ctDNA size was found to range from 500 bp to >30 kb (18–20); however, recent studies described ctDNA fragments smaller than 250 bp (6,12,13). The size distribution of ctDNA fragments within the same plasma/serum sample has been poorly studied (20,21). Moreover, analysis of ctDNA size as a diagnostic marker is controversial and appears to be of limited value, especially for early diagnosis. Combining this parameter with more specific ones might eventually be beneficial.
ctDNA level is high in the blood circulation of patients with colorectal carcinoma (CRC). CRC is one of the most frequent cancers in adults and it is due to the cumulative effects of inherited genetic susceptibilities and environmental exposures (10,12,21,22). Accumulation of genetic alterations in a multistep process characterizes the development of sporadic CRC. Chromosomal instability, microsatellite instability and CIMP (CpG island methylator phenotype) are the different pathways that permit the progressive accumulation of gene mutations which will cause colon cancer. A CRC carcinogenesis model involves the successive accumulation of APC (Adenomatous Polyposis Coli), KRAS or BRAF and TP53 mutations during tumor progression from adenoma to advanced carcinoma (23). As a consequence, knowing the mutation status of a patient may be important for CRC management, and therefore many studies have focused on the analysis of DNA sequences from tumor sections and more recently also from ctDNA (24). Moreover, the demonstration that response to anti-endothelial growth factor receptor (EGFR) therapies are strongly limited or even abolished when the KRAS or BRAF oncogenes are mutated (35–50% of metastatic CRCs) (25,26), clearly boosts the development of a more rapid, less costly and non-invasive approach for determining the mutation status of metastatic CRC cells.
Analytical experimental tools, such as animal models, could help optimizing a less costly, rapid and non-invasive mutation detection test that makes use of ctDNA which is accessible through a blood test. However, when considering abnormal ctDNA as a biomarker of malignancy, crucial questions which remain unanswered, are hindering its development. We thus wanted to investigate the form/structure of ctDNA in animals xenografted with cancer cells and healthy controls. Indeed, these ctDNA features are poorly described while they might provide clues on (i) the mechanisms of its release; (ii) their influence on its extraction, analysis or pharmacokinetics; and (iii) the progression of the disease. In addition, neither the cell type (tumor or not) from which ctDNA originates nor the fraction of ctDNA that carries cancer-related mutations have been assessed so far. In order to use ctDNA as a diagnostic tool we developed a mouse animal model and molecular tools to systematically examine side by side those critical aspects.
Athymic nude mice xenografted with human CRC cells allowed us to unequivocally compare tumor- and non-tumor-derived ctDNA amounts released during CRC expansion. Using very specific and sensitive Q–PCR (Quantitative Polymerase Chain Reaction) systems we could discriminate sequences of human and mouse origin, quantify the proportion of mutated ctDNA and evaluate ctDNA fragmentation. Quantification of ctDNA derived either from mouse or human cells was carried out by targeting species-specific sequences in KRAS and PSAT1. KRAS (3,5) Single nucleotide polymorphism (SNP) mutations are frequently associated with CRC and PSAT1 is often over-expressed and implicated in CRC progression and chemoresistance (27). A refined method for quantifying ctDNA fragments that carry mutations was assayed in plasma of mice xenografted with HT29 cells and with primers that specifically detect the BRAF V600E SNP mutation which characterizes this CRC cell line. ctDNA fragmentation was evaluated in order to estimate the contribution of apoptosis to ctDNA release by using an original double integrated PCR system which targets two ACTB sequences of mouse or human origin. Finally, the clinical relevance of the determination of ctDNA fragmentation was preliminary assessed in plasma samples from a small number of CRC patients and healthy controls.
MATERIALS AND METHODS
The presentation of the data in this report follows the very recent MIQE (Minimum Information for Publication of Quantitative Real-Time PCR Experiments) guidelines (28).
Cell lines and reagents
Human HCT116-s, SW620 and HT29 cells and mouse MC38 CRC cells were maintained in RPMI + 10% fetal bovine serum. The HCT116-s cell line (29) is derived from the CRC HCT116 which has the heterozygous KRAS c.38G>A mutation. SW620 cells have the homozygous KRAS G12V mutation (GGT to GTT), whereas HT29 cells exhibit the heterozygous BRAF V600E mutation (30). The G12V mutation represents the most abundant KRAS SNP in CRC (35–45% of CRC cases) (31), and BRAF V600E (8–14% of CRC case) is highly predominant relative to other BRAF SNPs in CRC (85–95%) (30). This mutation was previously named V599E before newly available sequence data by the National Centre for Biotechnology Information (NCBI) gene bank. In addition to be highly representative of frequent mutations in CRC, both cell lines tend to form large solid tumors following s.c. injection.
Oligonucleotides
The sequences of the oligonucleotide primers used in this work—designed and selected here—are summarized in Table 1. Primers were designed and selected according to the following requirements: (i) Tm ranging from 57 to 64°C; (ii) GC% ranging from 45 to 65%; (iii) size ranging from 18 to 26 nt; (iv) amplicon size ranging from 190 to 230 bp, except for the ACTB primers used for the integrity index; (v) self-assembling or internal annealing energy <–5 kcal. They were designed using the Primer 3 software. We performed local-alignment analyses with the BLAST program. The genome annotation file for known and predicted genes (seq_gene.md) was obtained from NCBI. Sequences were checked for self- or inter-molecular annealing with nucleic-acid-folding software (mfold and oligoAnalyzer 1.2). Oligonucleotides were synthesized and purified on HPLC by MWG (Ebersberg, Germany). Quality control of the oligonucleotides was performed by MALDI TOF.
Table 1.
Characteristics of the selected primers and of the amplicons obtained
| Species | Gene | Location | Primer name | Orientation | Sequence 5′–3′ | Tm (°C) | Amplicon size (bp) | Amplicon Tm(°C) |
|---|---|---|---|---|---|---|---|---|
| Human | PSAT1 | intron 7 | PSAT1 Hf 5 | Sense | GGGTAGGTCCCGTCTACTCC | 63.5 | 219 | 80,5 |
| PSAT1 Hr 5 | Antisense | CCAAAGCCAATTCCATTCAC | 55.2 | |||||
| Mouse | PSAT1 | 5′ flanking sequence | PSAT1 Mf 4 | Sense | GGCTTCGTTCTTGTGCAACT | 57.3 | 230 | 84,5 |
| PSAT1 Mr 4 | Antisense | ATGAGCTGGTGGAACCTGAC | 59.4 | |||||
| Human | KRAS | intron 2 | KRAS Hf 2 | Sense | AATCCGTGTGGGTCAGAGAG | 59.4 | 189 | 76,5 |
| KRAS Hr 2 | Antisense | GAAACAATAGCCACCCTCCTT | 57.9 | |||||
| Mouse | KRAS | intron 2 | KRAS Mf 3 | Sense | GGCCAGGAGTGCATTAAGAC | 59.4 | 214 | 81,5 |
| KRAS Mr 3 | Antisense | GCACGTCAGATAGTCTCCAAA | 57.9 | |||||
| Human | ACTB | intron 8 | HuACTB4353f | Sense | GGGACTATTTGGGGGTGTCT | 60.05 | 133 | 83,7 |
| HuACTB4510f | Sense | ACCTATGGGATCGTGGCTGT | 61.70 | 290 | 77,8 | |||
| HuACTB4643r | Antisense | CCCCTACCCCAACTTGACTT | 60.22 | |||||
| Mouse | ACTB | intron 4 | MoACTB2156f | Sense | CTTCTGCCGTTCTCCCATAG | 59.83 | 120 | 82,5 |
| MoACTB2374f | Sense | GATGCACAGTAGGTCTAAGTGGAG | 59.37 | 338 | 83,5 | |||
| MoACTB2494r | Antisense | CACTCAGGGCAGGTGAAACT | 60.30 | |||||
| Human | BRAF | Exon 15 | BRAF human f | Sense | AGGTGATTTTGGTCTAGCTACAGT | 57.65 | 149 | 81.2 |
| BRAF V600E f | Sense | GATTTTGGTCTAGCTACAGA | 49.65 | 145 | 80.8 | |||
| BRAF human r | Antisense | TAGTAACTCAGCAGCATCTCAGG | 58.83 | |||||
| Human | Kras | Intron 2 | Kras 145 Hf | Sense | TGGGCTGTGACATTGCTG | 60.42 | 145 | 82.4 |
| Kras 300 Hf | Sense | GGTCCTTTTCCGTGTGTAGG | 59.45 | 300 | 83.6 | |||
| Kras 145-300 r | Antisense | TGACCAAGCAAAACAGACCA | 60.28 |
Xenograft model
Female athymic nude mice (6–8 weeks old) were purchased from Harlan (Gannat, France) and maintained in a specific pathogen-free facility in an accredited establishment (N° B-34-172-27; Institut de Recherche en Cancérologie de Montpellier-CRLC Val d’Aurelle-Paul Lamarque, Montpellier, France). All experiments complied with current national and institutional regulations and ethical guidelines and were performed by an accredited person (Dr B. ROBERT, N°34-156). Mice were xenografted subcutaneously with 1 × 10⁶ cancer cells. Mice were euthanized with CO2 at different time points post-graft. Tumors were collected and weighed. Peripheral blood was drawn into EDTA tubes and was immediately (within 1 h) used for plasma preparation.
Human blood samples
Blood samples from patients with untreated metastatic CRC (mCRC) and from selected healthy individuals (age <30 years) were collected in EDTA tubes (Convention EFS-PM: 21/PVNT/MTP/CNR14/2007-0046). The overall process from blood collection to plasma preparation did not exceeded 3 h and plasma was stored at −80°C.
Plasma and serum preparation
Following collection in 5 ml BD vacutainer KE35 tubes (Belliver Industrial), mouse blood samples were centrifuged at 2000 rpm at 4°C in a Heraeus Multifuge LR centrifuge with a CR 4j rotor for 10 min. Supernatants were collected in sterile 1.5 ml Eppendorf tubes and centrifuged at 14 000 rpm at 4°C for 10 min. Then supernatants were either immediately handled for DNA extraction or stored at −80°C. No significant difference was found in Q–PCR assays when comparing freshly isolated or stored plasma. Serum was prepared using the same two-step centrifugation process, but blood was drawn in tubes without EDTA which were then left at room temperature for 1 h. Mouse and human plasma and sera were handled within 3 h following sampling.
DNA extraction
ctDNA and genomic DNA from the different cell lines were extracted following the same procedure. DNA was purified from 200 µl plasma with the QIAmp DNA mini Blood kit (Qiagen, CA) according to the ‘Blood and body fluid protocol’ with an elution volume of 60 µl. Samples were kept at 4°C during plasma preparation. DNA samples were frozen at −20°C until use. No significant difference was found in Q–PCR assay when comparing freshly extracted or stored DNA. Human HCT116-s and mouse MC38 cells were grown to exponential phase and 5 × 10⁶ cells were rinsed and DNA extracted. DNA concentration was determined with a Nanodrop spectrophotometer and 50 µl aliquots of 1–2 µg/ml DNA were kept at −20°C until use.
CtDNA quantification by Q–PCR
DNA was quantified by Q–PCR assay. Real-time PCR amplifications were carried out in a reaction volume of 25 µl on a My iCycler IQ 5IQ or a Chromo4 instrument using the IQ5 Optical system software 2.0 and the MJ Opticon Monitor 3 software (Bio-Rad). Each PCR reaction mixture consisted of 12.5 µl mix PCR (Bio-Rad Super mix SYBR Green = Taq polymerase, MgCl2); 2.5 µl of each amplification primer (100 pmol/µl); 2.5 µl PCR-analyzed water and 5 µl DNA extract. Thermal cycling started by a first denaturation step of 3 min at 95°C, followed by 40 cycles of 95°C for 10 s and 60°C for 30 s. Melting curves were obtained from 55 to 90°C with reading every 0.2°C. As calibrators for quantification, serial dilutions of genomic DNA from HCT116-s and MC38 cells were used. Sample concentrations were extrapolated from the standard curve by the IQ 5 Optical system software 2.0 or MJ Opticon Monitor 3 software. The copy number was calculated assuming a DNA content of 6.6 pg per cell and a length of 6.6 × 10⁹ bp. We expressed the limit of detection as the concentration that can be detected with reasonable certainty (95% probability) as recommended in the MIQE guidelines (28). The final mean ctDNA calculation of a sample was made by excluding ‘non-amplification’ replicates from the sample mean value. Each sample was analyzed in duplicate and each assay repeated at least once. Details are provided in Supplementary Data (S4).
Q–PCR targeted sequences
In this study we examined the variation of the amount of various types of ctDNA in xenografted mice by Q–PCR analysis of regions from four different mouse or human genes: KRAS, BRAF, PSAT1 and ACTB. Comparison of human versus mouse ctDNA concentrations was carried out by targeting two different ‘one copy/genome’ genes (KRAS and PSAT1) in order to limit potential unexpected variations due to factors such as gene location or presence of pseudogenes. KRAS was targeted in intron 7 and PSAT1 in the 5′ flanking region. PSAT1 codes for a phosphoserine aminotransferase which was shown to be over-expressed in colon tumors (27). PSAT1 has also be implicated in colon cancer progression and chemoresistance (27). Quantification of mutated fragments was ascertained by detecting ctDNA containing the BRAF V600E mutation which is frequently associated with CRC. Evaluation of ctDNA fragmentation was assayed in an original double integrated PCR system that targets ACTB sequences of mouse or human origin. ACTB is a reference gene conventionally used for normalizing various biological assays, in particular PCR; human ACTB has been recently targeted in a single integrated PCR system for estimating ctDNA integrity (32). To improve direct comparison of the amplification values, the reverse primer for each amplification system (human or mouse) was the same for the short (133 and 120 bp, respectively) and the long fragment (290 and 338 bp). The non-species-specificity level of the oligonucleotide primer sets was determined as the percentage of DNA concentration obtained when analyzing a known concentration of DNA from the other species.
Detection of ctDNA that carries the BRAF V600E mutation
Detection of the BRAF V600E mutation was based on the refinement of the allele specific Q–PCR procedure (AS PCR, which uses a primer system containing a sense primer that includes the mutated nucleotide in the 3′ position, 28) which combines the addition of an oligonucleotide blocker (ASB–PCR, 33). Optimization of the conditions of the assay and of oligonucleotide design was based on the work by Morlan et al. (33). The selected blocker was an oligodeoxynucleotide complementary to the wild-type sequence but phosphorylated at the 3′-end: 5′-GCTACAGTGAAATCTCGATGG—PHO. Amplification and analysis by ASB Q–PCR was carried out as described earlier using SYBR green as detection system. The non-specificity level of the V600E ASB Q–PCR system was determined as the percentage of DNA concentration obtained when analyzing a known concentration of wild-type genomic DNA (i.e. 0.5 ng/µl, equivalent to 15 ng/ml plasma DNA). Data analysis showed that the V600E ASB–PCR system exhibited 0.2% non-specificity (Supplementary Data S3).
Estimation of the ctDNA fragmentation
We used two primer sets targeting ACTB in human or mouse ctDNA. Primers were designed as such that the annealing sites of the shorter DNA fragments were within the larger fragment. The degree of fragmentation of ctDNA was assessed by calculating an index we termed DNA Integrity Index (DII). DII was calculated as the ratio of larger/shorter fragment concentrations. DII is therefore theoretically 1 if the template DNA is not truncated and <1 if it is truncated into fragments smaller than the large fragment. Primer sets for the short fragments were designed as such that the size of the amplicon was smaller than the size of the DNA involved in one nucleosome (133 and 120 bp for human and mouse ctDNA quantification, respectively). The size of the larger amplicon was of 290 and 338 bp (corresponding to a DNA length lower than that involved in two successive nucleosomes) for human and mouse ctDNA quantification (Figure 8). DII determination in human plasma with the ACTB Q–PCR system was confirmed by using another two primer sets that target a KRAS intron region and generate 145 and 300 bp amplicons (Table 1). Values obtained were normalized with an internal control by determining the DII of human placenta DNA (Sigma Aldrich, Ref D 3035) that has a theoretical DII of 1.
Figure 8.

Schematic of the primer sets used for evaluating ctDNA fragmentation in plasma of xenografted mice by targeting mouse or human ACTB sequences. Numbers in italics represent the nucleotide position of the ACTB sequences according to the FASTA format (5 566 782 for HuACTB and 143 665 420 for MoACTB).
Statistical analysis
Data were expressed as mean ± SD. Statistical analyses were performed using the Student’s t-test for comparison of means. A probability of <0.05 was considered to be statistically significant; *P ≤ 0.05, **P ≤ 0.01, ***P ≤ 0.001.
RESULTS
Quality control of the selected Q–PCR primer sets
We first validated the different sets of primers (Table 1) to be used for ctDNA characterization by Q–PCR using genomic DNA from human (HCT116-s) and mouse (MC38) CRC cell lines and ctDNA from controls and CRC patients as well as from control and xenografted nude mice.
DNA quantification
The quantification of a given genomic DNA sample by Q–PCR under our experimental conditions showed some variation according to the primer set employed. This discrepancy was much higher when comparing the ACTB primer sets used to assess DNA fragmentation. Hence, we applied a correlation factor when determining the DNA amount with each primer set in order to precisely compare the quantification of specific DNA sequences in ctDNA from mouse blood. This correlation factor was calculated from the equation for Cq in y versus the concentration in the x-axis, respectively, and the R2 for each PCR primer set which are presented in Supplementary Data S1.
Sensitivity
Sensitivity of our quantification system was assayed using serially diluted genomic DNA from human HCT116-s and mouse MC38 cell genomic DNA and the primer sets KRAS H2 (human) (Figure 1) and KRAS M3 (mouse). Both assays produced log-linear curves (y = −3.217x + 23.698 with a R2 = 0.997; y = −3.424x + 24.065 with a R2 = 0.998, respectively). The number of PCR cycles required to detect one copy of the target gene, as theoretically indicated by the y intercepts, was 34.5 for KRAS H2 and 35.3 for KRAS M3. Figure 1 presents the values obtained from the standard curve of seven different Q–PCR experiments and illustrates the sensitivity of our assay when using the same HCT116-s genomic DNA sample and the KRAS H2 primer set. The linear dynamic range covered at least four orders of magnitude. Accuracy of quantification was evaluated using the limit of detection of the assay, which was seven DNA copies (10 pg/µl of DNA), as determined when 95% of the positive samples are detected. We optimized sample acquisition, handling and preparation to hinder experimental variability. No significant discrepancy concerning sensitivity was observed when analyzing DNA from blood samples or from cultured cells. A reproducibility test carried out on 12 experiments that used a ctDNA pool from four CRC patients’ sera and the PSAT1 M4 primer set showed a coefficient of variation of 19% (data not shown).
Figure 1.

Sensitivity of the Q–PCR assay determined by plotting Cq and ctDNA concentrations on the y and x axis, respectively. Q–PCR analysis was performed using the KRAS H2 primer set with HCT116-s cell genomic DNA. Data obtained from seven different experiments are combined; each value obtained during these seven experiments carried out in separate runs is represented. The mathematical trend curve was a line of the equation y = –1.3538 ln(x) + 25 353 (R2 = 0.8973). Each individual standard curve from the seven experiments exhibited a R2 > 0.99. ctDNA concentration was expressed as ng/ml plasma and copies/assay. A factor of 6.6 pg of DNA per diploid cell is used for copy number conversion. The absolute equivalent amount of DNA in each sample was determined by a standard curve with serial DNA dilutions in 5 µl (50 ng–0.05 pg) in 25 µl total reaction volume.
Species-specificity
KRAS H2 and PSAT1 H5 (human) and KRAS M3 and PSAT1 M4 (mouse) were chosen among 15 other Q–PCR primer sets because they could accurately, reproducibly and sensitively quantify human and mouse DNA, respectively. Specificity of these Q–PCR primer sets was evaluated using plasma ctDNA from control BALB/C mice (Figure 2A) and healthy human individuals (Figure 2B). ctDNA level averaged 1 ng/ml in healthy human plasma when using the KRAS H2 and PSAT1 H5 primer sets, while no detectable amount was observed with KRAS M3 and PSAT1 M4 (Figure 2B). Similarly, no detectable or very low amount (mean 0.1 ng/ml, <0.8%) was observed with KRAS H2 and PSAT1 H5, respectively, in control mouse plasma, contrary to the 13–23 ng/ml range found with KRAS M3 and PSAT1 M4 (Figure 2A). This high Q–PCR amplification specificity was further confirmed as no amplification could be detected using PSAT1 H5 and KRAS H2 with MC38 genomic DNA or using PSAT1 M4 and KRAS M3 with HCT116-s DNA extracts (data not shown).
Figure 2.

Evaluation of the specificity of the Q–PCR systems targeting KRAS and PSAT1. Human KRAS H2, mouse KRAS M3, human PSAT1 H5 and mouse PSAT1 M4 primer sets were tested using plasma ctDNA extracts either from BALB/C mice (A) or from healthy human individuals (B). Results of amplifications with these PCR systems were expressed as plasma ctDNA concentration (ng/ml). Dark and light histograms represent the values of ctDNA concentration assessed in duplicates.
DNA integrity
ctDNA fragmentation was evaluated using an original double integrated PCR system which targets two ACTB gene sequences of mouse or human origin (Figure 8). Twelve different ACTB primer sets were designed and tested according to the plan presented in Figure 8.
The species-specificity of the primer sets was assessed by determining the concentration values obtained from the amplification of genomic DNA extracts from mouse MC38 and HCT116-s colon cancer cells (Supplementary Data S2). The chosen human ACTB primer sets appeared to be highly specific (97.77 and 97.83%). Conversely, despite our efforts, we could not design similarly highly specific mouse ACTB primer sets (only 94.44 and 96.23%) and the concentration obtained with both mouse primer sets appeared over-estimated by about 2-fold. Thus, a correlation factor was applied.
Detection of mutated ctDNA fragments
Quantification of the BRAF V600E mutation was performed by Allele Specific Q–PCR with blocker (ASB–PCR) using an original oligonucleotide blocker and an original primer set specific for the mutation (Table 1) which demonstrated high specificity (99.8%). No mutation was detected in DNA extracts of mouse MC38 colon cancer cells (Supplementary Data S3A), or in the blood of control mice or mice xenografted with SW620 cells, which do not carry this mutation.
Plasma is a better source of tumor-derived ctDNA than serum
After having validated our Q–PCR system, we then compared plasma and serum as a possible source of ctDNA. For this we used nude mice xenografted with SW620 CRC cells from which blood was drawn on various days post-xenograft. Plasma ctDNA level (ranging from 0.5 to 12.2 ng/ml) did not vary greatly when using the mouse-specific KRAS or PSAT1 primer sets and ctDNA concentration was not related to the tumor weight (Figure 3A and B). Except for mouse 1 (Mo1), mouse-derived ctDNA level was higher in serum than in plasma. Conversely, the concentration of ctDNA of human origin highly varied (from 0.05 to 408 ng/ml and from 2 to 88 ng/ml) when using the KRAS H2 or PSAT1 H5 primer sets (Figure 3C and D, and data not shown). Moreover, the median values of human ctDNA was about 2- to 3.5-fold lower in serum than in plasma using either the KRAS or PSAT1 primer sets (3.7 and 4.5 versus 1.0 and 2.2 in plasma and serum, respectively). Finally, mouse 4 (Mo4) exhibited the highest tumor weight (2880 mg) and showed the highest ctDNA level. Thus, the tumor-derived ctDNA concentration was much higher in plasma than in serum (32-fold with the KRAS H5 and 5.3-fold with the PSAT1 primers), whereas mouse-derived ctDNA was higher in serum (2.5- and 2-fold, respectively). In addition, no human derived ctDNA was detected in the serum of the mouse with the smallest tumor (mouse 1, Mo1). These results also suggest that the concentration of human-derived ctDNA in plasma, and to a lesser extent in serum, is higher in mice with higher tumor weight. Our results indicate that plasma is a better blood fraction for discriminating tumor ctDNA by Q–PCR analysis. We accordingly decided to use plasma instead of serum for all the experiments described hereafter.
Figure 3.

Comparison of ctDNA amount from serum (light bars) and plasma (dark bars) preparations. ctDNA concentration in plasma and serum from SW620 xenografts was determined using the mouse KRAS M3 (A), mouse PSAT1 M4 (B), human KRAS H2 (C) and human PSAT1 H5 (D) primer sets. ctDNA concentration for each mouse (Mo1, Mo2, Mo3 and Mo4) and the corresponding tumor weight (210, 610, 710 and 2880 mg, respectively) are shown. Values were calculated from duplicate experiments carried out twice.
In xenografted mice the concentration of tumor-derived ctDNA is positively correlated with tumor weight
The previous results indicate that the concentration of tumor-derived (human) ctDNA can exhibit huge inter-sample differences. Since Q–PCR quantification did not show significant variations when the same genomic DNA samples from mouse or human origin were amplified with either the KRAS M3 or the PSAT1 M4 primer set or the KRAS H2 or PSAT1 H5 primer set, respectively (data not shown), we wanted to determine whether this difference was due to the type and the size of the tumor. For this, we quantified human and mouse ctDNA from plasma of mice xenografted with SW620 or HT29 CRC cells (obtained at various days post-graft) using the human and mouse KRAS and PSAT1 primer sets. Similar to the results obtained in mice xenografted with SW620 cells (Figure 3), in mice xenografted with HT29 cells (Mo6–Mo10) we observed a marked difference in the concentration of mouse and human (tumor-derived) ctDNA, not only when targeting the human and murine KRAS gene (Figure 4B), but also when using the PSAT1 primer sets (Figure 4A). Specifically, comparable ctDNA amounts (around 1 ng/ml) were found in all HT29 xenografted mice when mouse KRAS and PSAT1 were amplified (Figure 4D). In contrast, human ctDNA concentrations were highly variable and were noticeably higher in mice with bigger tumors (Figure 4A, B and C). Plasma ctDNA concentration determined using the KRAS H2 primer set was higher than the one obtained from PSAT1 H5, but in both cases the progressive increase of tumor-derived ctDNA relative to the tumor weight was clearly observed (Figure 4C). Indeed, the mouse with the highest tumor weight (>1000 mg, Mo10) showed the highest concentration difference between human-derived and mouse-derived ctDNA both with the KRAS H2 primer set (11.5-fold higher) and the PSAT1 H5 set (4-fold higher). Finally, no human-derived ctDNA was detected in the mouse with the smallest tumor (Mo6, 130 mg) when targeting human KRAS and PSAT1 (Figure 4C), while mouse-derived ctDNA was still detectable (Figure 4D).
Figure 4.

ctDNA concentration relative to tumor weight in plasma of HT29 xenografts. ctDNA concentrations determined by Q–PCR analysis targeting human or mouse PSAT1 (A), human or mouse KRAS (B), human PSAT1 or KRAS (C) and mouse PSAT1 or KRAS (D) sequences were plotted in linear regression curves. ctDNA values obtained with mouse PSAT1 M4 (open square), human PSAT1 H5 (closed square), mouse KRAS M3 (open circle) and human KRAS H2 (closed circle) primer sets were expressed versus HT29 xenograft tumor weight. Control mouse (Mo5) corresponds to a non-xenografted athymic nude mouse (tumor weight = 0). Mo6–Mo10 bore tumors weighing 130, 280, 380, 400 and 1090 mg. Values were calculated from duplicate experiments carried out twice.
Similar results were obtained in mice xenografted with SW620 cells when mouse KRAS or PSAT1 were targeted (∼0.5 ng/ml) (Figure 5A and B, respectively). No detectable human-derived ctDNA was observed in the non-xenografted control Mo11 and in Mo12 in which the graft was unsuccessful (following injection, SW620 cells did not proliferate and the tumor was undetectable even at autopsy) (Figure 5C and D). Human-derived ctDNA level was much higher (25- and 7-fold) in Mo14 (with the heaviest tumor) than in Mo13. ctDNA levels appeared higher when targeting KRAS sequences than when targeting PSAT1 in both HT29 or SW620 xenografts. Moreover, the tumor-related ctDNA level was slightly lower relative to the tumor weight in SW620 xenografts than in HT29 xenografts (Figure 4). The observations about the increase of tumor ctDNA amount with tumor weight and about the stability of the non-tumor ctDNA concentration irrespective of the tumor weight were confirmed when using the human ACTB primer sets (Table 2).
Figure 5.

Determination of ctDNA concentration in plasma of SW620 xenografts by Q–PCR analysis. Plasma ctDNA amounts were measured in a control non-xenografted mouse (Mo11), in an unsuccessfully xenografted mouse (Mo12), and in mice with tumor of 640 mg (Mo13) and 2470 mg (Mo14). Experiments were carried out in duplicate and confirmed twice. Mouse KRAS (A), mouse PSAT1 (B), human KRAS (C) and human PSAT1 (D) primers correspond to KRAS M3, PSAT1 M4, KRAS H2 and PSAT1 H5. Data shown here are from a representative experiment performed in a single run.
Table 2.
ctDNA fragmentation relative to tumor progression in xenografts
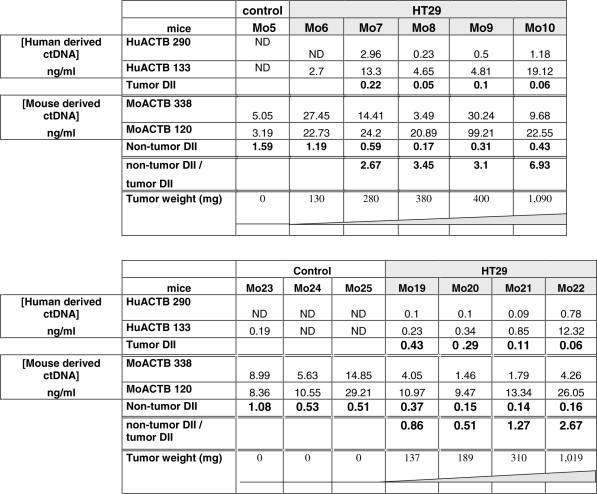 |
DII was calculated as the ratio of the ctDNA concentrations obtained from the amplification of a short/133 bp and a long/290 bp DNA fragment from the human ACTB gene, and a short/120 bp and a long/338 bp DNA fragment from the mouse ACTB gene. Two representative experiments are shown in upper and lower parts. Results of amplifications are expressed in terms of concentration (ng/ml of plasma) for each tested mouse with increasing tumor weight. Data represent values of ctDNA concentration assessed in duplicates. Each mouse was identified by a different number (Mo n). ND, not detected.
Mutated ctDNA is easily detectable
In order to assess whether tumor-derived ctDNA could be used to evaluate the mutation status of a tumor, we used ctDNA samples from mice xenografted with HT29 cells and specific human BRAF primer sets (Table 1) to detect the V600E mutation of BRAF which characterizes HT29 CRC cells (Figure 6). In a first experiment we used the same group of animals previously used to study tumor versus non-tumor ctDNA concentrations (Mo5–Mo10, Figure 4). Huge variability was observed in the concentration of ctDNA when mutated and non-mutated human BRAF sequences were targeted (Figure 6A). Conversely, comparable amounts were found in control and xenografted mice when targeting mouse-derived ctDNA with the mouse-specific KRAS primers. The BRAF V600E mutation was detected in every HT29 xenografted mouse, while four out of five ctDNA samples were positive when using the KRAS H2 primer set. These results were confirmed in a second group of mice (Mo15–Mo22, Figure 6B). The V600E PCR system is highly specific as determined using mice xenografted with SW620 cells which do not carry this mutation (S3). As observed earlier (Figure 4), mouse-derived ctDNA level in HT29 xenografts remained rather constant irrespective of the tumor weight (Figure 6B). To note, the concentration of mutated ctDNA seemed in general lower than that of total tumor ctDNA, particularly it was about half the total amount in mice with high weight tumors (Mo10 and Mo22). This can be explained by the monoallelic nature of the V600E mutation in HT29 cells (30,34). Human wild-type and mutated BRAF sequences could not be detected in three different control mice (Mo15–17).
Figure 6.

Discrimination of mouse, human wild-type and mutated ctDNA amounts in xenografted mice. Two representative experiments (A and B) are presented. Histograms describe the quantification of wild-type mouse (black bar) and human wild-type (hatched bar) and mutated V600E ctDNA (light bar). V600E BRAF mutated ctDNA amount was determined by ASB–PCR in Mo5–10, which had been xenografted with HT29 cells, and compared to mouse (KRAS M3 primer set) and human (wild-type BRAF primer set) derived ctDNA (A). In the second experiment, plasma samples of another five HT29 xenografted mice (Mo18–Mo22) and three non-xenografted control mice (Mo15–17) were used to quantify ctDNA using the PSAT1 M4, wild-type BRAF and V600E BRAF primer sets (B). Experiments were carried out in duplicate in a single run and confirmed twice. The total concentration of human ctDNA can be obtained by adding together the amount of mutated and non-mutated ctDNA as the V600E mutation is heterozygous in HT29 cells. ND, not detected.
Similar observations could be made when examining the concentration of ctDNA fragments harboring the KRAS G12V mutation in animals xenografted with SW620 CRC cells, except that human wild-type and mutated ctDNA exhibited comparable amounts in every mouse tested [according to the homozygous characteristic of that mutation in this cell line; (31,34)] (data not shown). Of course, the BRAF V600E mutation was not detected in this animal group and the KRAS G12V mutation was not detected in HT29 xenografts, confirming the specificity of the primer sets (data not shown). The ASB–PCR method (33) and the molecular tools used to detect these mutations (SYBR green and original primers) proved to be highly sensitive and specific (99.8% for the BRAF V600E) apparently as much as the Taqman Q–PCR assay for KRAS mutations described by Morlan et al. (31).
Only the tumor-derived ctDNA level varies according to the tumor burden
So far, we quantified the ctDNA concentration in the plasma of each mouse and then individually compared them relative to tumor growth or origin and targeted sequence. Theoretically the same ctDNA concentration should be obtained when targeting wild-type sequences within a species owing to the equivalency of the PCR primer system yield. In order to estimate in another way the relationship between tumor size and the ctDNA concentration determined by targeting mouse, human wild-type or mutated sequences, we separated—irrespective of the targeted gene—all our data in three categories based on tumor mass: high weight tumors (>500 mg), low weight tumors (100–500 mg) and control, non-xenografted nude mice (Figure 7). Due to the variation of ctDNA amounts previously observed (Figure 4) when targeting human PSAT1 and KRAS sequences, we calculated the mean values for all the ctDNA concentrations obtained using the KRAS and PSAT1 primers sets which fit within one of the three categories. Mouse-derived ctDNA level was comparable in all groups (Figure 7) and human-derived ctDNA was never detected in controls. In the group of xenografted mice with low weight tumors, almost equivalent levels of mouse and human ctDNA were found in plasma (∼2.25 and 2.68 ng/ml in HT29 xenografts). In mice with high weight tumors, both human wild-type and mutated ctDNA levels were statistically higher than in the low weight tumor group (P > 0.001 and P < 0.05, respectively). In the high weight tumor group, the mean concentration of human mutated ctDNA was nearly 2-fold lower than that of wild-type ctDNA, but the difference was not statistically significant.
Figure 7.

ctDNA concentration and tumor burden. All the data obtained in this study (A) were combined and separated in three categories: mice with high weight tumor (>500 mg, n = 5), low weight tumor (100–500 mg, n = 11) and non-xenografted nude mice (n = 8). Number of mouse plasma samples analyzed for each tumor mass category (B). In addition, we combined all KRAS and PSAT1 ctDNA concentrations obtained in this study from mouse plasma samples of HT29 xenografts. Human derived (tumor mutated and non-mutated) ctDNA as well as mouse derived ctDNAs were quantified in each category. Statistical evaluation of the significance of the differences among groups (P-values, from the Student’s t-test) is presented in Supplementary Data S5.
ctDNA fragmentation increases with ctDNA level
In order to assess ctDNA fragmentation in our animal model, we followed the procedure recently described by Ellinger et al. (32,35) who calculated an integrity index using two primer sets that target the same ACTB sequence. However, we could not use their primers as they were not human-specific and strong non-specificity was observed when they were used to analyze mouse-derived ctDNA. Thus, we designed two specific primer sets for human ACTB and two new ones for mouse ACTB in order to compare fragmentation in human- and mouse-derived ctDNA (Table 1 and Figure 8). A short (133 bp) and a long (290 bp) DNA fragment from human ACTB, and a short (120 bp) and a long (338 bp) DNA fragment from mouse ACTB were amplified by Q–PCR from the previously used plasma ctDNA samples (Mo6–Mo12) to determine the DII (i.e. long/short fragment ratio) within the same DNA sequence. Results are summarized in Table 2. No ctDNA was detected when the human ACTB primers were used to amplify the plasma sample of the control mouse (Mo5) (Table 2, panel A). It has to be noted that the ctDNA concentration range obtained when targeting mouse ACTB was 5- to 10-fold higher than when targeting mouse KRAS or PSAT1, while not being influenced by the tumor weight as in the previous experiments (Table 2 and Figure 4). In addition to differences in PCR efficiency, the presence of multiple detectable ACTB pseudogenes should account for this discrepancy (36). DII of human ctDNA ranged from 0.06 to 0.22 and was 2.7- to 6.9-fold lower than that of mouse ctDNA (0.17–1.19) (Table 2). Non-tumor DII of control mice and of the mouse with very low tumor weight (Mo6) were >1 in contrast to those of mice bearing high and medium weight HT29 tumors (0.05–0.06) (Table 2, panel A).
These observations were confirmed by data from a second experiment (Table 2, panel B). Human-derived ctDNA could not be detected in the three control healthy athymic nude mice (Mo23–25) while mouse ctDNA DII averaged 0.71. The non-tumor/tumor DII ratio in xenografted mice seemed to augment with the increase of the tumor mass in both experiments (2.67–6.93 and 0.86–2.67). Interestingly about a 2-fold increase of this ratio was observed when comparing HT29 xenografts bearing the two heaviest tumors in the first (0.4 and 1.09 g) and in the second experiment (0.31 and 1.02 g). To note, the non-tumor/tumor DII ratio was about 2-fold higher in the first experiment than in the second one possibly due to lower non-tumor DII values in the second experiment.
Clinical relevance of the DII values determined in the animal model
To assess the clinical relevance of the data we obtained in xenografted mice, we calculated the DII of ctDNAs extracted from plasma samples of healthy and mCRC subjects using the previously employed human ACTB primer sets (amplicons of 133 and 290 bp, Table 1) and the wild-type KRAS PCR primer sets (amplicons of 145 and 300 bp, Table 1). DII values obtained with the KRAS primer sets for the plasma samples from the three healthy individuals were 1.03, 1.76 and 2.75, whereas the DII of the ctDNAs from the three mCRC patients were 0.31, 0.77 and 0.80 (Table 3). Specifically, the DII median value (1.76) for plasma samples from healthy subjects was 2.3-fold higher than that of samples from mCRC patients (0.77). DII values obtained with the ACTB primer sets for the same three mCRC plasma samples were 0.12, 0.4 and 0.72. Those values are <1 and the plasma showing the significant highest ctDNA concentration (HCP003 sample) exhibited the lower DII, as observed when using the KRAS Q–PCR system.
Table 3.
ctDNA fragmentation in plasma samples from healthy subjects and mCRC patients
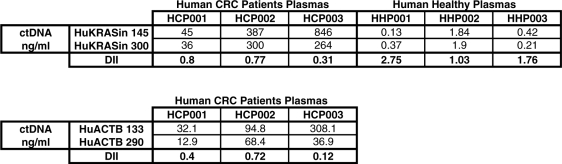 |
The DII was calculated as the ratio of the ctDNA concentrations obtained from the amplification of a long and a short DNA fragment from both human KRAS (300/145 bp) and ACTB (290/133 bp). Results are expressed in terms of concentration (ng/ml of plasma) in the plasma of three healthy individuals and three mCRC patients. Data represent the ctDNA concentration assessed in triplicate.
Whereas the DII median values of plasma samples from healthy human individuals and control mice were similar, the DII values determined in mCRC patients were slightly higher than those found in xenografted mice (Table 2). This discrepancy could be explained, at least partly, by the higher tumor mass/weight ratio in xenografted mice. Nevertheless, in both xenografted mice and mCRC patients the DII values determined in plasma were lower than those of healthy subjects/mice.
DISCUSSION
We optimized a fast and sensitive Q–PCR assay to specifically detect tumor (human) or non-tumor (mouse) ctDNA in nude mice xenografted with CRC cells. The use of our original primer sets for detecting KRAS, PSAT1, BRAF or ACTB sequences showed a high degree of discrimination for mouse/human sequences owing to the absence of false positive signals. Targeting KRAS, PSAT1 and BRAF in the same ctDNA plasma sample provided similar results in terms of quantification and therefore validated and strengthened the assay. This is crucial as discrepancies among genomic sequences might occur such as, in our study, for ACTB which can probably be explained by the presence of ACTB pseudogenes (36). Sensitivity and reproducibility of the results obtained with the different primer sets may be further enhanced by systematic optimization of Q–PCR reactions, but the level obtained in this study seems satisfactory relative to our objectives.
Our data indicate that plasma samples give more specific results than serum samples for tumor ctDNA quantification at least when originating from xenotransplanted CRC cells. Both plasma and serum samples have been frequently used for ctDNA analysis. Higher ctDNA levels were previously observed in serum than in plasma (37) certainly due to DNA release from blood cells following clotting. As a consequence plasma levels were increasingly used (4,5,9,22,38). Moreover, serum and plasma ctDNA levels were found not to be correlated, each being related in a different way to diagnosis and prognosis (39). Ellinger et al. (32) recently suggested that plasma and serum ctDNA concentrations might vary depending on the extraction kit employed. We carried out a rigorous two-step separation by centrifugation which completely removed cells from plasma samples intended for DNA extraction (data not shown). Then, we quantified wild-type and mutated ctDNA and evaluated ctDNA fragmentation. We detected tumor-derived ctDNA in all mice tested using different sets of primers. By MASA-PCR assay using a primer set that targeted mutated KRAS, Garcia-Olmo and co-workers (40) could detect tumor-derived ctDNA in only 17–46% of rats xenografted with DHD CRC cells. Rago et al. (41) described an elegant and sensitive model to determine tumor ctDNA level in xenografts by a direct PCR assay targeting the human Long Interspersed Nuclear Element-1 (LINE-1) retrotransposon. It has a 3- to 5-fold lower detection limit than ours and certainly higher robustness at very low ctDNA concentrations, for instance when quantifying ctDNA concentration after i.v. injection of tumor cells (41). Nevertheless, our system also requires small amounts of plasma (25 µl) allowing repeated measurements on the same animal when sampling at least 10 days post-injection (data not shown). Moreover, our animal model exhibits ctDNA levels/tumor weight ratios comparable to those obtained in the study by Rago and co-workers when the plasma samples came from xenografted animals with tumor weight >100 mg.
Plasma ctDNA determined by using specific murine primer sets did not vary much compared to tumor size especially up to 1000 mg of tumor weight. In contrast, ctDNA from human origin increased with tumor mass as it was just detectable in mice bearing low weight tumors (>100 and <500 mg), but could be eight times more concentrated in plasma from mice bearing high weight tumors. In mice with tumors of 1–2 g, total ctDNA amount (human- plus mouse-derived ctDNA) reached 38 ng/ml, a concentration that corresponds to 8400 copies/ml plasma. There is a variation of ctDNA mean values in the literature certainly due to the populations tested or the methods employed. ctDNA amount was shown in various reports (3,5,6,9,11,42–44) to vary from 5 to 24 ng/ml in healthy individuals. Variations of ctDNA concentration in cancer patients is primarily due to the type of neoplasia; for instance, the mean ctDNA concentration determined in plasma/serum of patients with small cell lung, prostate and colorectal cancer were respectively 25, 210 and 1157 ng/ml (43,44,11, respectively). In terms of fragment number, Diehl et al. (12) reported that 1350–230 000 fragments/ml were found in CRC patients’ plasma in comparison to the 1150–8280 fragments/ml in disease-free patients. This illustrates the overlap between ctDNA level in healthy and CRC individuals. A highly sensitive approach (flow cytometry BEAMing analysis of KRAS, PIK3CA, TP53 and APC) gave a median of 4000 fragments/ml plasma in 18 subjects with CRC. This value corresponds to the fragment number we found in xenografted mice bearing tumors >1000 mg, while it does not clearly match the tumor/body weight ratio. The ctDNA level in mice with tumors <1000 mg appears lower than the concentration found in human patients. Indeed, the ctDNA amount we found in mice with tumors of 1–2 g (5–10% body weight) was almost 10-fold lower than that found in advanced CRC patients. Moreover, the ctDNA level in non-xenografted nude mice was very low (0.3 ng/ml) when compared with that of healthy human individuals (∼15 ng/ml). Nevertheless, our experimental model highlights the increase of total ctDNA amount with tumor burden as observed in the clinic (3,11,12,38). Indeed, many authors proposed to quantify total ctDNA for cancer surveillance as the overall ctDNA level may depend on the tumor stage (11,37). Guadalajara et al. (35) found a statistically significant correlation between the concentration of ctDNA and the presence of metastases in CRC patients. Diehl et al. (13) recently proved that ctDNA measurements could be used to reliably monitor tumor dynamics in subjects with CRC who were undergoing surgery or chemotherapy. Our results suggest that ctDNA could be detected as early as 16 days after cell inoculation (tumor weight averaging 100 mg). Garcia et al. (40) described that the highest increase in plasma ctDNA concentration was observed from the end of the first week after inoculation to the end of the fifth week and remained stable thereafter. Animal model data thus seem to confirm the early presence of ctDNA after tumor cell inoculation.
It has to be noted that the ctDNA level/tumor weight ratio seems to be lower in SW620 cell xenografts than in HT29 cell xenografts. HT29 cells are derived from colorectal adenocarcinoma, whereas SW620 from a metastatic lymph node of a colorectal adenocarcinoma staged as Dukes’ type C. Increased number of mice in each group is needed to strengthen this observation, nevertheless this illustrates the ability of our system to specifically investigate and compare ctDNA release in different tumor cells, in particular relative to their original tumor stage.
The total ctDNA amount in CRC patients’ plasma may originate from the background level observed in healthy individuals, from cancer cells and from tumor-surrounding cells or tissues (12). As a consequence the total ctDNA includes DNA derived from normal and tumor cells. As tumor cell composition evolves with tumor progression, it is important to discriminate among the different sources of ctDNA. Only a few clinical studies tried to determine the mutated/wild-type ctDNA fragment ratio with very different results (13,39,40). Mutated KRAS was found in 83–86% of CRC patients’ plasma samples (38). The percentage of APC mutation varies with the disease stage with only 0.04% in patients with low stage tumor (Dukes’ A), 0.9% in patients without metastases (Dukes’ B) and 11% in advanced cases (Dukes’ D) (11), although no correlation was observed between percentage of mutant ctDNA and tumor burden (6,13). Jahr et al. (6) detected in breast cancer patients percentages of tumor-derived ctDNA going from 3 to 93%. This discrepancy may be explained by either the neoplasia type or the detection method employed (CDKN2A hypermethylation). Furthermore, non-tumor ctDNA level may depend on many variables, such as phagocyte efficiency to remove dead cells in and around tumors and DNA efficiency to reach the blood circulation. This may explain the large variation in the amounts and composition of DNA found in the circulation of cancer patients. Nevertheless, in CRC patients’ plasma a small proportion of mutated (tumor) ctDNA was observed. Rago et al. (41) confirmed that only a tiny fraction of the total plasma ctDNA from CRC tumor xenografts was of human (tumor) origin. Conversely, in our study, we found that while non-tumor ctDNA level did not appear to increase in mice with tumor weight, the tumor (human origin)/non tumor (mouse origin) ctDNA ratio significantly increased with the tumor size in both HT29 (1.2 and 13.9) and SW620 (1.3 and 11, data not shown) xenografted mice with low and high tumor weight, respectively. We postulate that this difference might be due to the immunodeficiency of nude mice. The ctDNA background level found in nude mice (0.5 ng/ml) is strikingly low compared to that of immunocompetent mice (10–50 ng/ml) or CRC clinical samples (10–100 ng/ml) (data not shown). Therefore we may assume that T-cells, in particular degenerating, tumor-infiltrating T lymphocytes, may account for a significant proportion of ctDNA in clinical samples. However, Jahr et al. (6) could demonstrate a contribution from T-cell DNA to the total ctDNA concentration only in 2 out of 18 patients with different cancers (and these two cases did not include the CRC patients whose plasma showed 10–1000 ng/ml of total ctDNA). Alternatively, the low levels of non-tumor-derived ctDNA observed in our model might be explained by other indirect physiological mechanisms due to the specific T-cell immunodeficiency in nude mice. Anyway, thanks to the low ctDNA background, our animal model facilitates the quantification of tumor-derived ctDNA, especially when studying mutant ctDNA. This is important when examining the mutated/wild-type fragment ratio and the number of fragments that carry different, coexisting mutations. Moreover, the ASB–PCR method we adapted from Morlan et al. (31) appears as an easy, sensitive and specific assay for detecting human SNPs in ctDNA of xenografted nude mice.
In this study, we further assessed the origin of ctDNA by analyzing the size of ctDNA fragments within the same DNA region using primer sets targeting human or mouse ACTB. Apoptosis is thought to be one of the major sources of ctDNA in cancer patients as well as in healthy individuals (10,45) or for fetal ctDNA (46). Apoptotic events lead to high fragmentation of cell DNA possibly to fragments of the DNA size contained in a nucleosome (∼180 bp) or multiples of it. ctDNA fragments of nucleosome and oligo-nucleosome size were previously found in high proportion in CRC patients’ plasma (15,16,47,48). Our results clearly demonstrate first that the integrity index as determined by this method is much higher in mouse-derived ctDNA than in human-derived ctDNA (2.7- to 6.9-fold) and second, they suggest that the integrity index decreases with tumor size. Thus, our system confirmed the high predominance of nucleosome-derived fragments in plasma from xenografted mice and, as a consequence, of apoptosis as a source of ctDNA. Moreover, our data indicate that the integrity index of non-tumor ctDNA does not vary much with tumor size. The integrity index of non-tumor ctDNA was 1.3–9 times lower than that of control mice, while it was 7–28 times lower for tumor ctDNA. Moreover, the integrity index could discriminate between tumor and non-tumor ctDNA in all mice tested except for one animal with a low weight tumor. Ellinger et al. (32) found an integrity index (384/106 bp ratio) of 0.348 and of 0.681 in 74 patients with testicular cancer and 35 healthy individuals, respectively. In their previous study (35), clear cut differences were observed in patients with benign prostatic hyperplasia (0.58), urothelial cell carcinoma (0.31) and prostate cancer (0.11). In addition, they found that increased ctDNA fragmentation in bladder cancer patients was correlated with mortality, suggesting that fragmentation could be an independent prognostic factor. Conversely, DNA integrity was not useful in a diagnostic setting for lung cancer patients (49). If DNA fragmentation is not a discriminating factor for all cancer types this means that the mechanisms of DNA release into circulation may change in different cancers. In order to better define the usefulness of the integrity index, such as the DII we designed in this study as a clinical diagnostic factor (complementary to ctDNA quantification), it is thus critical to take into consideration the cancer type.
Only a few reports focused on the use of animal models for studying ctDNA. Specifically, Garcia-Olmo’s group compared directly to tumor ctDNA concentration and number of circulating cancer cells in xenografted rats (40). Significant ctDNA amounts were detected earlier and more frequently than circulating tumor cells during the spread of CRC (40). This suggests a higher potential for ctDNA as a diagnostic tool than circulating tumor cells. Rago et al. (41) have developed an elegant and highly sensitive Q–PCR test to quantify ctDNA by targeting LINE-1 in mouse xenografts. They proved that this system enables in-life monitoring of systemic tumor burden and therefore the close examination of a variety of animal tumor models and the efficacy of therapeutic measures. In this work, we report for the first time the direct evaluation of the respective contribution of the amount of non-tumor, tumor and mutated ctDNA as well as the evaluation of ctDNA integrity in an animal model. Nevertheless, the animal model, we describe here, can not be fully transposed to human colorectal cancer. Indeed, human colon cell lines subcutaneously xenografted in nude mice do not display the same kinetics as CRC. Moreover, athymic nude mice do not have a functional immune system. Since none of the existing mouse models mimics all the characteristics of human CRC, each time the best model should be chosen based on the specific experimental questions (49). For instance, an orthotopic tumor model, like the ones described by Rago et al. (41) or Samos et al. (50), could possibly be more suitable for analyzing ctDNA relative to the pathogenesis of metastasis and for the study of tumor–host interactions. However, orthotopic tumor models might exhibit higher variability especially concerning tumor homing/infiltration in the host tissue and consequently allow lower reproducibility when quantifying and differentiating between non-tumor and tumor derived ctDNA. On the other hand, here we detected similar total ctDNA levels in plasma samples from xenografted animals and from mCRC patients, while a much higher proportion of tumor ctDNA was observed in the animal model than in mCRC patients (12,13). CRC tumor growth seems to lead to higher ctDNA fragmentation in both mice and patients as suggested by the DII values. The lowest DII value found in the plasma sample of a healthy subject was higher than the highest value observed in plasma samples of either CRC xenografted animals or mCRC patients. These results suggest that our animal model has some clinical relevance and that it could be a useful tool for the systematic study of the form/structure of ctDNA and for screening methods for ctDNA analysis.
Indeed, our tumor model makes possible the systematization of the analysis of ctDNA sources and already helped us to optimize blood sample manipulation and extraction procedures. Our results suggest that ctDNA mean size may vary during CRC tumor progression. This might be due to increased apoptosis. This conclusion is, however, not universally accepted as conflicting conclusions emerge in the literature (6,47,49,51–53). Jahr et al. (6) could easily detect both large and short ctDNA molecules upon injection of compounds inducing necrosis and apoptosis in mice and suggested that large DNA fragments of apparently necrotic origin can best discriminate cancer patients from healthy individuals. The morphological assessment of tumors (invasion, differentiation, degree of apoptosis) relative to ctDNA fragmentation would also be informative and could help to resolve this issue. Moreover, accurate and standardized sampling procedures, specific and sensitive detection of ctDNA along with the use of animal models, like the one used in this study, might elucidate tumor/non tumor or apoptotic/necrotic origins of ctDNA relative to variables such as mutation or tumor location. More has to be done to better study ctDNA size to establish whether, or to which extent, a relationship can be drawn between ctDNA size and tumor stage or tumor types. In addition, our experimental system might be used to differentiate among the various forms of ctDNA complexes (specific or unspecific nucleo-proteic, proteo-lipidic, particle-like, etc.) and to explore the fate of other nucleic acid molecules such as miRNA, RNA or apoptotic bodies which should provide precious indications on tumor development. Ultimately this animal model might be useful for developing accurate and sensitive diagnostic tests for SNPs detection which are required for predicting the response to new potent anti-cancer compounds (25,26) and to determine whether ctDNA has any function or pathological effects (37,54,55).
SUPPLEMENTARY DATA
Supplementary Data are available at NAR Online.
FUNDING
INSERM (Institut National de la Santé et de la Recherche Médicale, France) support (to A.R.T.); CNRS (Centre National de la Recherche Scientifique) and the Region of Languedoc-Roussillon grant (CNRS044406 to F.M.) Funding for open access charge: Sysdiag UMR3145 – CNRS/BIO-RAD.
Conflict of interest statement. None declared.
Supplementary Material
ACKNOWLEDGEMENTS
The authors wish to thank Dr J. Ellinger, Dr J. Morlan, Dr E. Crapez and Dr A. Jarry for useful discussions. The authors thank S. Cobo and I. Molina (Sysdiag CNRS-BioRad) for their help with plasma collection.
REFERENCES
- 1.Mandel P, Metais P. Les acides nucleiques du plasma sanguin chez l’homme. C. R. Seances Soc. Biol. Fil. 1948;142:241–243. [PubMed] [Google Scholar]
- 2.Stroun M, Anker P, Lyautey J, Lederrey C, Maurice PA. Isolation and characterization of DNA from the plasma of cancer patients. Eur J. Cancer Clin. Oncol. 1987;23:707–712. doi: 10.1016/0277-5379(87)90266-5. [DOI] [PubMed] [Google Scholar]
- 3.Gormally E, Hainaut P, Caboux E, Airoldi L, Autrup H, Malaveille C, et al. Amount of DNA in plasma and cancer risk: a prospective study. Int. J. Cancer. 2004;111:746–749. doi: 10.1002/ijc.20327. [DOI] [PubMed] [Google Scholar]
- 4.Sawyers CL. The cancer biomarker problem. Nature. 2008;452:548–552. doi: 10.1038/nature06913. [DOI] [PubMed] [Google Scholar]
- 5.Fleischhacker M, Schmidt B. Circulating nucleic acids (CNAs) and cancer–a survey. Biochim. Biophys. Acta. 2007;1775:181–232. doi: 10.1016/j.bbcan.2006.10.001. [DOI] [PubMed] [Google Scholar]
- 6.Jahr S, Hentze H, Englisch S, Hardt D, Fackelmayer FO, Hesch RD, Knippers R. DNA fragments in the blood plasma of cancer patients: quantitations and evidence for their origin from apoptotic and necrotic cells. Cancer Res. 2001;61:1659–1665. [PubMed] [Google Scholar]
- 7.Leon SA, Shapiro B, Sklaroff DM, Yaros MJ. Free DNA in the serum of cancer patients and the effect of therapy. Cancer Res. 1977;37:646–650. [PubMed] [Google Scholar]
- 8.Stroun M, Anker P, Maurice P, Lyautey J, Lederrey C, Beljanski M. Neoplastic characteristics of the DNA found in the plasma of cancer patients. Oncology. 1989;46:318–322. doi: 10.1159/000226740. [DOI] [PubMed] [Google Scholar]
- 9.Butt AN, Swaminathan R. Overview of circulating nucleic acids in plasma/serum. Ann. NY Acad. Sci. 2008;1137:236–242. doi: 10.1196/annals.1448.002. [DOI] [PubMed] [Google Scholar]
- 10.Fournie GJ, Courtin JP, Laval F, Chale JJ, Pourrat JP, Pujazon MC, Lauque D, Carles P. Plasma DNA as a marker of cancerous cell death. Investigations in patients suffering from lung cancer and in nude mice bearing human tumours. Cancer Lett. 1995;91:221–227. doi: 10.1016/0304-3835(95)03742-f. [DOI] [PubMed] [Google Scholar]
- 11.Schwarzenbach H, Stoehlmacher J, Pantel K, Goekkurt E. Detection and monitoring of cell-free DNA in blood of patients with colorectal cancer. Ann. NY Acad. Sci. 2008;1137:190–196. doi: 10.1196/annals.1448.025. [DOI] [PubMed] [Google Scholar]
- 12.Diehl F, Li M, Dressman D, He Y, Shen D, Szabo S, Diaz LA, Jr, Goodman SN, David KA, Juhl H, et al. Detection and quantification of mutations in the plasma of patients with colorectal tumors. Proc. Natl Acad. Sci. USA. 2005;102:16368–16373. doi: 10.1073/pnas.0507904102. [DOI] [PMC free article] [PubMed] [Google Scholar]
- 13.Diehl F, Schmidt K, Choti MA, Romans K, Goodman S, Li M, Thornton K, Agrawal N, Sokoll L, Szabo SA, et al. Circulating mutant DNA to assess tumor dynamics. Nat. Med. 2008;14:985–990. doi: 10.1038/nm.1789. [DOI] [PMC free article] [PubMed] [Google Scholar]
- 14.Kawamura MT, Paschoal ME, Carvalho Mda G. Profile of proteins complexed with circulating DNA of a lung cancer patient. Ann. NY Acad. Sci. 2000;906:51–54. doi: 10.1111/j.1749-6632.2000.tb06590.x. [DOI] [PubMed] [Google Scholar]
- 15.Nagata S. Apoptotic DNA fragmentation. Exp. Cell Res. 2000;256:12–18. doi: 10.1006/excr.2000.4834. [DOI] [PubMed] [Google Scholar]
- 16.Holdenrieder S, Nagel D, Schalhorn A, Heinemann V, Wilkowski R, von Pawel J, Raith H, Feldmann K, Kremer AE, Muller S, et al. Clinical relevance of circulating nucleosomes in cancer. Ann. NY Acad. Sci. 2008;1137:180–189. doi: 10.1196/annals.1448.012. [DOI] [PubMed] [Google Scholar]
- 17.Deligezer U, Erten N, Akisik EE, Dalay N. Circulating fragmented nucleosomal DNA and caspase-3 mRNA in patients with lymphoma and myeloma. Exp. Mol. Pathol. 2006;80:72–76. doi: 10.1016/j.yexmp.2005.05.001. [DOI] [PubMed] [Google Scholar]
- 18.Dennin RH. DNA of free and complexed origin in human plasma: concentration and length distribution. Klin. Wochenschr. 1979;57:451–456. doi: 10.1007/BF01477498. [DOI] [PubMed] [Google Scholar]
- 19.Giacona MB, Ruben GC, Iczkowski KA, Roos TB, Porter DM, Sorenson GD. Cell-free DNA in human blood plasma: length measurements in patients with pancreatic cancer and healthy controls. Pancreas. 1998;17:89–97. doi: 10.1097/00006676-199807000-00012. [DOI] [PubMed] [Google Scholar]
- 20.Chan KC, Zhang J, Hui AB, Wong N, Lau TK, Leung TN, Lo KW, Huang DW, Lo YM. Size distributions of maternal and fetal DNA in maternal plasma. Clin. Chem. 2004;50:88–92. doi: 10.1373/clinchem.2003.024893. [DOI] [PubMed] [Google Scholar]
- 21.Fan HC, Blumenfeld YJ, Chitkara U, Hudgins L, Quake SR. Noninvasive diagnosis of fetal aneuploidy by shotgun sequencing DNA from maternal blood. Proc. Natl Acad. Sci. USA. 2008;105:16266–16271. doi: 10.1073/pnas.0808319105. [DOI] [PMC free article] [PubMed] [Google Scholar]
- 22.Khanna M, Park P, Zirvi M, Cao W, Picon A, Day J, Paty P, Barany F. Multiplex PCR/LDR for detection of K-ras mutations in primary colon tumors. Oncogene. 1999;18:27–38. doi: 10.1038/sj.onc.1202291. [DOI] [PubMed] [Google Scholar]
- 23.Fearon ER, Vogelstein B. A genetic model for colorectal tumorigenesis. Cell. 1990;61:759–767. doi: 10.1016/0092-8674(90)90186-i. [DOI] [PubMed] [Google Scholar]
- 24.Chin L, Gray JW. Translating insights from the cancer genome into clinical practice. Nature. 2008;452:553–563. doi: 10.1038/nature06914. [DOI] [PMC free article] [PubMed] [Google Scholar]
- 25.Lievre A, Bachet JB, Boige V, Cayre A, Le Corre D, Buc E, Ychou M, Bouche O, Landi B, Louvet C, et al. KRAS mutations as an independent prognostic factor in patients with advanced colorectal cancer treated with cetuximab. J. Clin. Oncol. 2008;26:374–379. doi: 10.1200/JCO.2007.12.5906. [DOI] [PubMed] [Google Scholar]
- 26.Di Nicolantonio F, Martini M, Molinari F, Sartore-Bianchi A, Arena S, Saletti P, De Dosso S, Mazzucchelli L, Frattini M, Siena S, et al. Wild-type BRAF is required for response to panitumumab or cetuximab in metastatic colorectal cancer. J. Clin. Oncol. 2008;26:5705–5712. doi: 10.1200/JCO.2008.18.0786. [DOI] [PubMed] [Google Scholar]
- 27.Vie N, Copois V, Bascoul-Mollevi C, Denis V, Bec N, Robert B, Fraslon C, Conseiller E, Molina F, Larroque C, et al. Overexpression of phosphoserine aminotransferase PSAT1 stimulates cell growth and increases chemoresistance of colon cancer cells. Mol. Cancer. 2008;7:14. doi: 10.1186/1476-4598-7-14. [DOI] [PMC free article] [PubMed] [Google Scholar]
- 28.Bustin SA, Benes V, Garson JA, Hellemans J, Huggett J, Kubista M, Mueller R, Nolan T, Pfaffl MW, Shipley GL, et al. The MIQE guidelines: minimum information for publication of quantitative real-time PCR experiments. Clin. Chem. 2009;55:611–622. doi: 10.1373/clinchem.2008.112797. [DOI] [PubMed] [Google Scholar]
- 29.Gongora C, Candeil L, Vezzio N, Copois V, Denis V, Breil C, Molina F, Fraslon C, Conseiller E, Pau B, et al. Altered expression of cell proliferation-related and interferon-stimulated genes in colon cancer cells resistant to SN38. Cancer Biol. Ther. 2008;7:822–832. doi: 10.4161/cbt.7.6.5838. [DOI] [PubMed] [Google Scholar]
- 30.Jarry A, Masson D, Cassagnau E, Parois S, Laboisse C, Denis MG. Real-time allele-specific amplification for sensitive detection of the BRAF mutation V600E. Mol. Cell Probes. 2004;18:349–352. doi: 10.1016/j.mcp.2004.05.004. [DOI] [PubMed] [Google Scholar]
- 31.Einspahr JG, Martinez ME, Jiang R, Hsu CH, Rashid A, Bhattacharrya AK, Ahnen DJ, Jacobs ET, Houlihan PS, Webb CR, et al. Associations of Ki-ras proto-oncogene mutation and p53 gene overexpression in sporadic colorectal adenomas with demographic and clinicopathologic characteristics. Cancer Epidemiol. Biomarkers Prev. 2006;15:1443–1450. doi: 10.1158/1055-9965.EPI-06-0144. [DOI] [PMC free article] [PubMed] [Google Scholar]
- 32.Ellinger J, Wittkamp V, Albers P, Perabo FG, Mueller SC, von Ruecker A, Bastian PJ. Cell-free circulating DNA: diagnostic value in patients with testicular germ cell cancer. J. Urol. 2009;181:363–371. doi: 10.1016/j.juro.2008.08.118. [DOI] [PubMed] [Google Scholar]
- 33.Morlan J, Baker J, Sinicropi D. Mutation detection by real-time PCR: a simple, robust and highly selective method. PLoS ONE. 2009;4:e4584. doi: 10.1371/journal.pone.0004584. [DOI] [PMC free article] [PubMed] [Google Scholar]
- 34.Ikediobi ON, Davies H, Bignell G, Edkins S, Stevens, et al. Mutation analysis of 24 known cancer genes in the NCI-60 cell line set. Mol. Cancer Ther. 2006;5:2606–2612. doi: 10.1158/1535-7163.MCT-06-0433. [DOI] [PMC free article] [PubMed] [Google Scholar]
- 35.Ellinger J, Bastian PJ, Ellinger N, Kahl P, Perabo FG, Buttner R, Muller SC, Ruecker A. Apoptotic DNA fragments in serum of patients with muscle invasive bladder cancer: a prognostic entity. Cancer Lett. 2008;264:274–280. doi: 10.1016/j.canlet.2008.01.038. [DOI] [PubMed] [Google Scholar]
- 36.Ng SY, Gunning P, Eddy R, Ponte P, Leavitt J, Shows T, Kedes L. Evolution of the functional human beta-actin gene and its multi-pseudogene family: conservation of noncoding regions and chromosomal dispersion of pseudogenes. Mol. Cell Biol. 1985;5:2720–2732. doi: 10.1128/mcb.5.10.2720. [DOI] [PMC free article] [PubMed] [Google Scholar]
- 37.Guadalajara H, Dominguez-Berzosa C, Garcia-Arranz M, Herreros MD, Pascual I, Sanz-Baro R, Garcia-Olmo DC, Garcia-Olmo D. The concentration of deoxyribonucleic acid in plasma from 73 patients with colorectal cancer and apparent clinical correlations. Cancer Detect Prev. 2008;32:39–44. doi: 10.1016/j.cdp.2008.01.002. [DOI] [PubMed] [Google Scholar]
- 38.Frattini M, Gallino G, Signoroni S, Balestra D, Lusa L, Battaglia L, Sozzi G, Bertario L, Leo E, Pilotti S, et al. Quantitative and qualitative characterization of plasma DNA identifies primary and recurrent colorectal cancer. Cancer Lett. 2008;263:170–181. doi: 10.1016/j.canlet.2008.03.021. [DOI] [PubMed] [Google Scholar]
- 39.Thijssen MA, Swinkels DW, Ruers TJ, de Kok JB. Difference between free circulating plasma and serum DNA in patients with colorectal liver metastases. Anticancer Res. 2002;22:421–425. [PubMed] [Google Scholar]
- 40.Garcia-Olmo DC, Gutierrez-Gonzalez L, Ruiz-Piqueras R, Picazo MG, Garcia-Olmo D. Detection of circulating tumor cells and of tumor DNA in plasma during tumor progression in rats. Cancer Lett. 2005;217:115–123. doi: 10.1016/j.canlet.2004.06.043. [DOI] [PubMed] [Google Scholar]
- 41.Rago C, Huso DL, Diehl F, Karim B, Liu G, Papadopoulos N, Samuels Y, Velculescu VE, Vogelstein B, Kinzler KW, et al. Serial assessment of human tumor burdens in mice by the analysis of circulating DNA. Cancer Res. 2007;67:9364–9370. doi: 10.1158/0008-5472.CAN-07-0605. [DOI] [PubMed] [Google Scholar]
- 42.Beck J, Urnovitz HB, Riggert J, Clerici M, Schutz E. Profile of the circulating DNA in apparently healthy individuals. Clin. Chem. 2009;55:730–738. doi: 10.1373/clinchem.2008.113597. [DOI] [PubMed] [Google Scholar]
- 43.Board RE, Williams VS, Knight L, Shaw J, Greystoke A, Ranson M, Dive C, Blackhall FH, Hughes A. Isolation and extraction of circulating tumor DNA from patients with small cell lung cancer. Ann. NY Acad. Sci. 2008;1137:98–107. doi: 10.1196/annals.1448.020. [DOI] [PubMed] [Google Scholar]
- 44.Cherepanova AV, Tamkovich SN, Bryzgunova OE, Vlassov VV, Laktionov PP. Deoxyribonuclease activity and circulating DNA concentration in blood plasma of patients with prostate tumors. Ann. NY Acad. Sci. 2008;1137:218–221. doi: 10.1196/annals.1448.016. [DOI] [PubMed] [Google Scholar]
- 45.Suzuki N, Kamataki A, Yamaki J, Homma Y. Characterization of circulating DNA in healthy human plasma. Clin. Chim. Acta. 2008;387:55–58. doi: 10.1016/j.cca.2007.09.001. [DOI] [PubMed] [Google Scholar]
- 46.Chan KC, Zhang J, Hui AB, Wong N, Lau TK, Leung TN, Lo KW, Huang DW, Lo YM. Size distributions of maternal and fetal DNA in maternal plasma. Clin. Chem. 2004;50:88–92. doi: 10.1373/clinchem.2003.024893. [DOI] [PubMed] [Google Scholar]
- 47.Su YH, Wang M, Brenner DE, Ng A, Melkonyan H, Umansky S, Syngal S, Block TM. Human urine contains small, 150 to 250 nucleotide-sized, soluble DNA derived from the circulation and may be useful in the detection of colorectal cancer. J. Mol. Diagn. 2004;6:101–107. doi: 10.1016/S1525-1578(10)60497-7. [DOI] [PMC free article] [PubMed] [Google Scholar]
- 48.Wang M, Block TM, Steel L, Brenner DE, Su YH. Preferential isolation of fragmented DNA enhances the detection of circulating mutated k-ras DNA. Clin. Chem. 2004;50:211–213. doi: 10.1373/clinchem.2003.026914. [DOI] [PubMed] [Google Scholar]
- 49.Heijstek MW, Kranenburg O, Borel Rinkes IH. Mouse models of colorectal cancer and liver metastases. Dig. Surg. 2005;22:16–25. doi: 10.1159/000085342. [DOI] [PubMed] [Google Scholar]
- 50.Samos J, Garcia-Olmo DC, Picazo MG, Rubio-Vitaller A, Garcia-Olmo D. Circulating nucleic acids in plasma/serum and tumor progression: are apoptotic bodies involved? An experimental study in a rat cancer model. Ann. NY Acad. Sci. 2006;1075:165–173. doi: 10.1196/annals.1368.022. [DOI] [PubMed] [Google Scholar]
- 51.Schmidt B, Weickmann S, Witt C, Fleischhacker M. Integrity of cell-free plasma DNA in patients with lung cancer and nonmalignant lung disease. Ann. NY Acad. Sci. 2008;1137:207–213. doi: 10.1196/annals.1448.034. [DOI] [PubMed] [Google Scholar]
- 52.Mamon H, Hader C, Li J, Wang L, Kulke M, Amicarelli G, Shehi E, Adlerstein D, Roper K, Killion L, et al. Preferential amplification of apoptotic DNA from plasma: potential for enhancing detection of minor DNA alterations in circulating DNA. Clin. Chem. 2008;54:1582–1584. doi: 10.1373/clinchem.2008.104612. [DOI] [PMC free article] [PubMed] [Google Scholar]
- 53.Umetani N, Giuliano AE, Hiramatsu SH, Amersi F, Nakagawa T, Martino S, Hoon DS. Prediction of breast tumor progression by integrity of free circulating DNA in serum. J. Clin. Oncol. 2006;24:4270–4276. doi: 10.1200/JCO.2006.05.9493. [DOI] [PubMed] [Google Scholar]
- 54.Gahan PB. Circulating DNA: intracellular and intraorgan messenger? Ann. NY Acad. Sci. 2006;1075:21–33. doi: 10.1196/annals.1368.003. [DOI] [PubMed] [Google Scholar]
- 55.Garcia-Olmo DC, Dominguez C, Garcia-Arranz M, Anker P, Stroun M, Garcia-Verdugo JM, Garcia-Olmo D. Cell-free nucleic acids circulating in the plasma of colorectal cancer patients induce the oncogenic transformation of susceptible cultured cells. Cancer Res. 2010;70:560–567. doi: 10.1158/0008-5472.CAN-09-3513. [DOI] [PubMed] [Google Scholar]
Associated Data
This section collects any data citations, data availability statements, or supplementary materials included in this article.