


Abstract
Gene expression circuitries, which enable cells to detect precise levels within a morphogen concentration gradient, have a pivotal impact on biological processes such as embryonic pattern formation, paracrine and autocrine signalling, and cellular migration. We present the rational synthesis of a synthetic genetic circuit exhibiting band-pass detection characteristics. The components, involving multiply linked mammalian trans-activator and -repressor control systems, were selected and fine-tuned to enable the detection of ‘low-threshold’ morphogen (tetracycline) concentrations, in which target gene expression was triggered, and a ‘high-threshold’ concentration, in which expression was muted. In silico predictions and supporting experimental findings indicated that the key criterion for functional band-pass detection was the matching of componentry that enabled sufficient separation of the low and high threshold points. Using the circuitry together with a fluorescence-encoded target gene, mammalian cells were genetically engineered to be capable of forming a band-like pattern of differentiation in response to a tetracycline chemical gradient. Synthetic gene networks designed to emulate naturally occurring gene behaviours provide not only insight into biological processes, but may also foster progress in future tissue engineering, gene therapy and biosensing applications.
INTRODUCTION
The quest to understand how temporal and spatial dynamics at the molecular level give rise to biological structure and pattern has been a widely pursued goal of developmental biologists (1–3). Central to these efforts is the concept of the morphogen which, generally defined, is any substance that can cause pattern organization by diffusion through a multicellular structure (3). Critically, the morphogen does not just carry a signal, but rather one that differs depending on its concentration. Embryonic pattern formation is an oft-cited example in which multiple intra-and extra-cellular morphogens have been identified, particularly as they relate to Drosophila development (4–6). Other examples in which morphogen gradients drive physiological responses include paracrine and autocrine signalling, the chemoattractant-dependent control of cell shape and movement, and the impact of intracellular signalling on cellular structure and shape (3,7).
According to classic morphogen theory (8), a cell’s physiological behaviour is the outcome of its interpretation of a single biochemical variable (i.e. morphogen concentration) in which interpretation of positional information is thought to rely on direct, concentration-threshold-dependent mechanisms. A significant body of work has expanded this classical theory to include a range of additional mechanisms, such as feedback loops (9) and multi-interdependent combinatorial morphogen interactions, that ensure morphogen gradients are adequately regulated and interpreted with sufficient robustness (3,10–11). Staying at the classic level, we sought to determine whether it is possible to engineer a mammalian genetic circuitry that is capable of sensing a specific concentration within a morphogen gradient as a pre-condition for positional-specification and subsequent organized pattern formation.
The creation of synthetic designer gene networks has been increasingly used to interconnect gene regulation systems to re-create and gain insights into naturally occurring gene phenomena. Non-exhaustive examples include the creation of epigenetic toggle switches (12,13), oscillatory networks (12,14) and amplificatory (15), pulse-generating (16) and band-pass like networks (17–18). In many cases, these synthetic recreations have enabled researches to understand the role of specific gene control mechanisms, such as negative and forward feedback, noise and transcriptional cascades, in producing highly specific forms of gene expression (19).
In the band-detection network described by Basu et al., mathematical analysis was used to design modular components that enabled the detection of a low-threshold, a high threshold and a means of integrating the two thresholds. In their configuration LuxR, an acyl-homoserine lactone (AHL)-dependent transcriptional activator, was used to drive expression the λcI repressor and a weakened form of the LacI repressor (LacIM1). The λcI repressor was coupled to a further regulatory cascade which repressed the expression of wild-type LacI. Both the weakened and wild-type LacI repressed expression, to a different extent, of a green fluorescent protein (GFP) reporter. At low AHL concentrations, LuxR was not active such that only basal levels of both LacIM1 and λcI repressors were produced. The absence of λcI ensured that wild-type LacI was fully expressed which consequently repressed GFP expression. At high AHL concentrations, the LuxR activator drove both high LacIM1 and λcI expression. The presence of λcI ensured that wild-type LacI was completely repressed. However, as sufficiently high concentrations of LacIM1 were expressed, GFP expression remained nonetheless repressed. It was only at intermediate concentrations of AHL that a balance was reached between sufficiently low expression of LacIM1 to prevent LacIM1-mediated repression of PLac, and sufficiently high expression of λcI to prevent LacI expression and consequent LacI-mediated repression of PLac. At this point, insufficient repression from either LacI repressor resulted in GFP expression (18).
Whilst prototype studies have been predominantly conducted using prokaryotic systems, the development of inter-operable gene regulation systems in higher organisms has enabled the successful application of these efforts to mammalian systems. In addition to providing validation of underlying theories of natural phenomena, these applications pave the way for a future generation of biomedical gene-control technology in which gene expression is finely controlled spatially and temporally through an array of sophisticated synthetic gene control modalities. In a step-change to standard gradiated on or off gene control systems [such as the widely popular Tet system (20)], successfully demonstrated applications within a mammalian context include toggle and hysteretic switches (21,22), multi-input logic sensors (23,24), time-delay circuits (25,26) and oscillatory networks (27,28).
Employing the relatively well-characterized and inter-operable tetracycline- (20), macrolide- (29) and streptrogramin- (30) gene regulation systems as building blocks, we report the rational design and characterization of a synthetic gene network exhibiting band-pass processing and output properties. The system utilizes the same topology as the prokaryotic system described above involving multiple transcriptional control mechanisms including autoregulation, and double and triple-level transcriptional cascades. By inter-changing elements of the network, and by fine-tuning the quantity of interacting elements, we were able to optimize the network so that it could be used to sense and respond to a stimuli gradient whereby gene expression was only evidenced at intermediate levels of stimuli. We regard to the development of sophisticated gene networks, such as the band-pass filter, and their successful application within high-order organisms as a pre-requisite for future gene therapy strategies within which gene expression must be highly controlled and tailorable.
METHODS
Expression vector design and construction
The expression vectors used in this study are depicted in Figure 1. pDG178 (PhCMV*-1-tTA-pA), in which the tetracycline-dependent transactivator tTA is expressed in an autoregulatory manner from a tTA-inducible promoter (PhCMV*-1), has been previously described (31). pDG200 (PhCMV*-1-E-KRAB-pA), engineered for PhCMV*-1-driven expression of the erythromycin-dependent transrepressor E-KRAB; pDG202 (PhCMV*-1-Pip-pA), engineered for similarly driven expression of the pristinamycin-dependent transrepressor Pip; and pDG205 (PhCMV*-1-Pip-KRAB-pA), encoding the pristinamycin-dependent transrepressor Pip-KRAB again under PhCMV*-1-driven expression control, were constructed by replacing PSV40 of pWW43 (PSV40-E-KRAB-pA) (29), PhCMV of pMF150 (PhCMV-Pip-pA) (30) and PSV40 of pMF207 (PSV40-Pip-KRAB-pA) (30), respectively, with PhCMV*-1 from pMF111 (PhCMV*-1-SEAP-pA) (32) using SspI/EcoRI. pDG218 (PhCMV*-1-E-pA), in which the erythromycin-dependent transrepressor E is expressed from PhCMV*-1, was created by polymerase chain reaction (PCR) amplification of E from pWW29 (PhCMV-E-pA) (29) using primers OWW18 (TACGAATTCCCACCATGCCCCGCCCCAAGCTCAA; EcoRI site underlined) and ODG68 (CGTCCGCGTACAGCCGCGCGCAATAAGCTTGGGAT; HindIII site underlined) primers, followed by EcoRI/HindIII restriction and cloning into similarly digested pSAM203 (PhCMV*-1-tTA-IRES-IRES-pA) (33) to replace tTA-IRES-IRES. pDG237 (PPIRON-E-pA), encoding E under control of the Pip- or Pip-KRAB-repressible promoter (PPIRON), was created by excising PhCMV*-1 from pDG218 and replacing it with PPIRON excised from pTRIDENT11 (PPIRON-IRES-IRES-IRES) (34) using SspI/EcoRI. pDG238 (PETRON-Pip) encoding Pip under PETRON expression control was created by excising PhCMV*-1 and replacing it with PETRON excised from pWW72 (PETRON-MCS) (35) using SspI/EcoRI. pBP62 (PPIRON-E-KRAB-pA) (22), and pWW56 (PETRON-SEAP-pA) (29) encoding SEAP under control of the E- or E-KRAB-repressible promoter PETRON, have been previously described. Similarly, pBP92 (PETRON-Pip-KRAB-pA) (22) and pMF208 (PPIRON-SEAP-pA) (30) have been previously described. pND9 (PETRON-Ubv76-GFP-pA) (36) encodes a Ubv76 destabilized variant of GFP under PETRON expression control. pDG295 (PhCMV*-1-Ubv76-GFP-pA) was constructed by excising Pip from pDG202 with EcoRI/NotI and replacing it with Ubv76-GFP excised from EcoRI (partial)/NotI digested pND9. pLEGFP-N1 (PhCMV-GFP-pA) and pSEAP2-Control (PSV40-SEAP-pA) in which GFP and SEAP, respectively, are constitutively expressed were commercially sourced (Clontech).
Figure 1.

Schematic illustration of plasmid expression constructs used in this study. E, E. coli-derived repressor of the macrolide resistance gene mphA; E-KRAB, macrolide-dependent transsilencer; ETR, operator sequence specific for E binding; GFP, enhanced green fluorescence protein; KRAB, human kox-1 gene transcriptional silencer; PETRON, macrolide-responsive ON-type promoters containing eight ETR modules downstream of PSV40 constitutive promoter; PhCMV, constitutive human cytomegalovirus immediate early promoter; PhCMV*-1, tetracycline responsive promoter containing seven TetO modules upstream of PhCMVmin; PhCMVmin, minimal PhCMV; Pip, S. coelicolor-derived repressor of the streptogramin resistance operon; Pip-KRAB, streptogramin-dependent transsilencer; PIR, operator sequence specific for Pip binding; PPIRON, streptrogramin-responsive ON-type promoter containing three PIR modules downstream of PSV40; PSV40, constitutive simian-40 virus derived promoter with ESV40; SEAP, human placental secreted alkaline phosphatase; TetO, operator sequence specific for TetR binding; TetR, E. coli-derived repressor of the TN10 tetracycline resistance operon; tTA, tetracycline-dependent transactivator (TetR-VP16); Ubv76, Proteasome targeting substrate; Ubv76-GFP, Ubv76 tagged GFP; VP16, Herpes simplex virus-derived transcriptional activator.
Cell culture, transfection and construction of stable cell lines
The monoclonal Chinese hamster ovary cell line (CHO-K1, ATCC CCL 61) derivative, CHOtTA, was cultivated in ChoMaster® HTS (Cell Culture Technologies, Gravesano Switzerland) supplemented with 5% fetal calf serum (FCS; Pan Biotech GmbH, Aidenbach Germany, Cat. No. 3302-P231902, Lot No. P231902) and 1% (v/v) penicillin/streptomycin solution (Sigma, St Louis USA, Cat. No. P4458). Cells were always cultivated in a humidified 5% CO2, 37°C incubator. CHOtTA, containing pDG178 (PhCMV*-1-tTA-pA), was created by co-transfecting pDG178 and pPUR (PSV40-Puror-pA; Clontech) in a 15:1 ratio into wild-type CHO-K1 followed by a 2-week cultivation in puromycin-containing media (Calbiochem, Israel, Cat. No. 540411; final concentration 6 µg/ml). Integration of the pDG178 expression cassette and suitability of tetracycline induction kinetics, of single-cell clones obtained by limiting dilution, were tested by transient co-transfection with pMF111 (PhCMV*-1-SEAP-pA) followed by tetracycline dose profiling of SEAP reporter gene expression. Clone 27, exhibiting an induction ratio in excess of 100-fold, was selected for all further work and designated CHOtTA. Transfection of plasmid DNA expression vectors was performed using FuGENE®6 transfection reagent (Roche, Mannheim Germany, Cat. No. 11814443001), according to the manufacturer’s instructions. The regulating antibiotics tetracycline (Sigma Chemicals, St. Louis USA, Cat. No. T3383), pristinamycin 1 (Sanofi-Aventis Inc., Pyostacin®, Zurich Switzerland) and erythromycin (Fluka, Buchs Switzerland) were prepared as previously described stock solutions (37).
For experiments involving agarose gel overlays CHO cells were initially cultivated, seeded and transfected as described above. Six hours post-transfection, media was withdrawn and substituted with freshly prepared media containing 2% low melt agarose (PeqGold, Erlangen Switzerland, Cat. No. 35-2010), that was prepared according to the manufacturer’s instructions. A tetracycline concentration gradient was subsequently established by pipetting tetracycline stock solution onto 6.5-mm blank absorbent discs (Mast Group, Merseyside UK, Cat. No. BD0638 W) that were placed on top of the set agarose.
Quantification of reporter gene expression
Production of human placental-secreted alkaline phosphatase (SEAP) was quantified using a p-nitrophenylphosphate-based light absorbance kinetic assay as previously described (38,39) with results expressed in units per litre (U/L). Fluorescence microscopy of GFP expression was performed using an inverted fluorescence microscope (Leica Microsystems DMI 6000B, 11888107) equipped with a DFC350FX R2 digital camera (Leica, Cat. No: 112730043), a 10× objective (Leica, Obj. HC PL FL 10 x/0.30 PH1 -/D 11.0, Cat. No. 11506507) and an excitation/emission filter set for 488/509 nm (B/G/R, Cat. No. 11513886). Adjoining images were assembled into larger mosaic strips, enabling a complete view across the diameter of a single well of a 6 well plate, using LAS AF imaging software (Leica FW4000-TZ, Cat. No. 12723979).
Modelling
Model equations were solved using the simulation program Berkeley Madonna (www.berkeleymadonna.com). Machine implementable versions of the equations used in this study can be accessed at http://mfdata.ethz.ch/Model_Equations.doc.
RESULTS AND DISCUSSION
Rational design of a band-pass network
To design a network capable of responding to an inducer within a given concentration range, it is necessary to engineer modular components that enable the detection of a low-threshold (point at which target gene expression is triggered), a high-threshold (point at which expression is muted) and, of course, a means of integrating the two detection thresholds. A generic synthetic biologic circuit, involving multiply linked trans-activator and -repressor control systems, was designed to reflect this functional criteria.
A constitutively expressed TA, which triggers PTA-driven expression of a gene product in response to a small molecule inducer (Ab), was selected as the common input sensing point of the system. In a typical gradated configuration, whereby a gene of interest (GOI) is placed immediately downstream of PTA, increasing Ab concentrations progressively switches GOI expression off (Figure 2A). To create a signal inverting function, and thereby create the low-threshold sensing module, a transrepressor (TR1) was substituted under PTA-control. TR1 then represses PTR1/3-driven expression of the GOI. At low Ab concentrations, TA drives TR1 expression which represses GOI expression. Conversely, at high Ab concentrations, TR1 expression is inactivated, the absence of which results in GOI expression (Figure 2B). The high-threshold sensing module was created by placing an additional transrepressor (TR2) under PTA-control, which represses PTR2-driven expression of a third transrepressor (TR3). TR3 also controls PTR1/3-driven expression, but with differing efficacy than TR1. The high-threshold module involves a double cascade of two inverting functions, thereby providing a mechanism for switching off gene expression in response to elevated Ab levels (Figure 2 C).
Figure 2.

Schematic of differing genetic configurations with expected response profiles to varying inducer (Ab) concentrations. In a standard gradated configuration (A) expression of the gene of interest (GOI) is directly under PTA control which is influenced, in an inducer-dependent manner, by the activity and binding-affinity levels of its cognate transactivator (TA). Within the single cascade configuration (B), PTA is used drive expression of a repressor (TR) that prevents GOI expression from a TR-dependent PTR promoter. In the absence of TR, as occurs during induce presence, PTR-driven expression is enabled, thereby inverting the standard gradated signal. The double cascade configuration (C) is similar but involves the serial insertion of an additional repressor and repressor-dependent promoter downstream of the first repressor. Double inversion of the inducer signal results in a response profile with similar shape but shifted response mid-point to the original gradated signal. The band-pass (D) configuration simply represents the combination of the single and double-cascade configurations in which the end repressor of both cascades are cognate for the same GOI-driving promoter.
Placed together, the two modules create a network in which GOI expression is repressed at low Ab concentrations, through TR1 expression and also at high Ab concentrations, through TR3 expression. The key to switching on gene expression, and creating a functional band-pass, is to separate the Ab boundaries at which the low- and high-threshold sensing modules operate. By doing so, it is possible, at an intermediate Ab concentration, to reach a balance between sufficiently low expression of TR1, to prevent TR1-mediated repression of PTR1/3 and sufficiently high expression of TR2 to prevent TR3 expression, and consequent TR3-mediated repression of PTR1/3 (Figure 2D). The key parameters that impact whether the system will exhibit band-pass properties are the relative activities of the interacting components.
Qualitative model
To conduct a qualitative analysis of this circuit topology we derived a dimension-less mathematical model to simulate concentrations and interactions between the various modular elements.
Constitutive expression of the common ‘input sensing’ TA can be simply described, (PCON and DegTA describe production and degradation rate, respectively) and is expected to rapidly reach steady state concentrations once the degradation rate equals the production rate (d(DT)/dt = 0) [Equation (1)]:
| (1) |
The impact of TA upon subsequent events is determined by the degree to which TA is activated (TAa) which is a function of the input [Ab] concentration, and KAB which represents the inverse concentration at which 50% of TA molecules are in their activated conformation [Equation (2)].
| (2) |
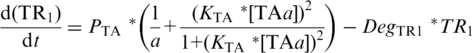
PTA-driven expression of TR1 [Equation (3)] and TR2 [Equation (4)] follows TA-based Monod kinetics (22) which is dependent upon (i) PTA maximum velocity (PTA), (ii) basal, or leaky expression in the absence of TA, of PTA (1/a), (iii) the relative concentration of TAa whose affect is described by the Hill-coefficient term, in which the exponent 2 reflects co-operating binding of TA dimers to their palindromic binding sites with KTA describing the inverse TAa concentration at which PTA reaches 50% of maximum velocity. Degradation rates for TR1 and TR2 are described by DegTR1 and DegTR2 respectively:
 |
(3) |
 |
(4) |
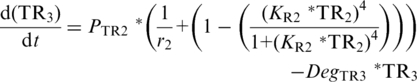
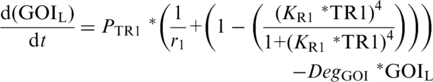
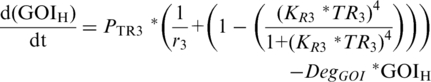
PTR-driven expression of either the downstream repressor TR3 [Equation (5)] or GOI Equations (6) and (7) follows TR-based expression kinetics (22) and is dependent upon (i) the maximum velocity of PTR1–3, (ii) leaky expression of PTR1–3 (1/r1–3) and (iii) the relative concentration of TR1–3 whose affect is described by the Hill-coefficient term, in which the exponent 4 again reflects cooperative binding of TR, and KR1–3, which describes the inverse TR1–3 concentrations at which PTR1–3 reaches 50% of maximum velocity, respectively (40). To differentiate between GOI expression driven by the low- and high-threshold modules, and to enable manipulation of their interacting components, separate equations were described for each [GOIL (Equation (6); GOIH (Equation (7)].
 |
(5) |
 |
(6) |
 |
(7) |
Total GOI expression was provided by aggregating GOIL and GOIH [Equation (8)].
| (8) |
For numerical analysis of Equations (1–8), experimentally determined constraints were used where possible to specify parameters. Promoter strengths (PCON, PTA and PTR1–3) were arbitrarily initially set at 10. Degradation rates (DegTA, DegTR1–3 and DegGOI) were set to 10−4 of the relevant expression-controlling promoter (21). Leakiness terms (a, and r1–3) were initially set at 32 consistent with the typical observed leakiness of mammalian gene expression systems (41). Given the promoter and degradation assumptions the Michaelis–Menton constants (KTA and KTR1–3) were initially set at 10−3 (21). Finally, KAB was arbitrarily set at 0.02.
Initial simulations focused upon understanding the relative sensitivity of the first downstream expression product, TR1, to changes in a, PTA and KTA constants (Figure 3A–C), whereas changes in leakiness impacted residual and maximal gene expression by a fixed amount, thereby significantly impacting induction characteristics, changes in promoter strength altered both residual and maximal gene expression proportionately, thereby only influencing the quantum of gene product produced and not the induction window. In terms of parameters impacting dose–response characteristics the KTA parameter was clearly the most critical. Increasing the activation threshold of TTa for its cognate promoter, PTA, by decreasing the response mid-point of the cognate promoter (i.e. decreasing K constant), shifted the induction threshold to the left (i.e. decreasing [Ab] threshold). Conversely, decreasing the activation threshold (i.e. increasing K constant) had the opposite effect and shifted the induction threshold to the right. These initial simulations suggested that one could optimize detection thresholds for low- and high-detection componentry by altering K constants. Further simulations on GOI expression driven by the low- and high-threshold detecting components corroborated this hypothesis (Figure 3D and E), whilst providing important constraints regarding the requirement for downstream K constants to possess an appropriate response mid-point (i.e. not lower than K = 0.001), with the relative response mid-point of the upstream K constant determining the threshold shift. Selection of downstream K constants without the appropriate response mid-point negatively impacted the functionality of the respective threshold detection system. Finally simulations with K constants selected to separate detection thresholds for the low- and high-detection componentry resulted in functional band-detection networks (Figure 3F). Time-course analysis indicated that the appearance of band detection characteristics would not be immediate, but would be a function of the delay due to the transcriptional cascades inherent to both the low- and high-threshold detection componentry, with the longer delay occurring for the high-threshold (Figure 3G and H).
Figure 3.


In silico analysis of the synthetic band detection componentry. In each case, dose–response profiles in response to varying concentrations of inducer antibiotic [(Ab)] were modelled using parameters described in results section. Impact of changes in PTA leakiness (input a) (A), PTA promoter strength (B), and the Michaelis–Menten constant KTA (C), on expression read-out of the first downstream repressor TR1. (D) Impact of differing ratios of the Michaelis–Menten constants, KTA and KTR1, on GOI expression from the low-threshold detection componentry [GOI (low)]. (E) Impact of differing ratios of the Michaelis–Menten constants, KTA, KTR2 and KTR3, on GOI expression from the high-threshold detection componentry [GOI (high)]. (F) Kinetic evolution of band-pass network driven expression of GOI (total) at differing time points (arbitrary time units) in which parameters for low (KTA = 0.0001; KTR1 = 0.001)- and high-threshold componentry (KTA, KTR2, KTR3 = 0.001) have been selected for optimal performance. (G,H) Kinetic evolution of low- (G) and high- (H) threshold detection componentry at differing time points (arbitrary time units) using the same optimized parameters.
Taken together, these simulations indicated that the emergence of band-pass characteristics would be highly dependent upon fine-tuning of the various cascade elements. Significant factors include: (i) the importance of tight induction ranges, and minimal leakiness, for all systems within the cascade. While leakiness interferes with network performance at any stage of the cascade, this is most critical for upstream components as any leakiness there cannot be ‘recovered’ through subsequent tighter downstream components. (ii) Relative promoter strengths are notionally important, but given changes in promoter strength impact both residual and maximal expression equally, this is less critical than changes in other parameters. (iii) The concentration of regulator at which the respective cognate promoter is activated (designated by Michaelis–Menton constants) is critical in determining the inducer concentration range within which the specified system responds. Significantly, these simulations suggested that changes in the relative response mid-points of gene control systems could be exploited to create low- and high-threshold detecting modules that operated at differing inducer concentrations; a necessary pre-condition for the formation of viable band-detection networks. Moreover, by tailoring response mid-points for both low- and high-threshold componentry it would be possible to fine-tune the response range of the system both in terms of the ‘range’ over which the system responds as well as the exact concentration at which it produces maximal expression.
In vivo implementation of band-pass network in CHO cells
Recent advances in the development of inter-operable mammalian gene control systems provide the opportunity to test the above mathematical predictions by linking together different systems that possess differing regulation characteristics (42). To construct a mammalian band-pass network, the tTA (20), E-ON (29) and Pip-ON (30) heterologous gene control systems were selected. Tetracycline-sensitive tTA was selected as the ‘input’ sensing point of the system which controlled expression, via a tTA responsive promoter (PhCMV*-1), of either the macrolide-dependent transrepressor E or streptogramin-dependent transrepressor Pip. Expression plasmids were selected in which the repressor could be expressed in its nascent form (E; pDG218, Pip; pDG202) or conjugated to a KRAB transcription silencing domain (E-KRAB; pDG200, Pip-KRAB, pDG205). For the low-threshold sensing module, the system's output was monitored via reporter gene expression (SEAP) which was placed under expression control of the respective PETRON or PPIRON promoters (pWW56 and pMF208, respectively). The high-threshold detection module was created by introducing a serially linked secondary repressor into one of the low-threshold sensing modules to create a two-step cascade. For this purpose, the secondary repressor (E, E-KRAB, Pip or Pip-KRAB) was placed under expression control of the respective PPIRON or PETRON promoter (pDG237, pBP62 and pDG238, pBP92, respectively).
Given the model requirements for a tightly controlled, but relatively wide induction window for the ‘input sensing’ tTA module, a stable cell line expressing tTA in an autoregulated manner from its own cognate PhCMV*-1-driven promoter (CHOtTA containing pDG178) was constructed. While the use of an autoregulated construct reduced maximal gene expression, it significantly reduced ‘leakiness’, thereby increasing the effective induction range (33). It additionally minimized the influence of extraneous noise on the system (43). Transient transfections of CHOtTA with a PhCMV*-1-driven SEAP reporter gene (pMF111) confirmed an induction range in excess of 100-fold. ON to OFF gene expression was mediated most significantly between tetracycline (Tet) concentrations of 10 and 50 ug/ml (Figure 4).
Figure 4.

Tetracycline (Tet) dose–response profile of CHOtTA (PhCMV*-1-tTA) transiently transfected with pMF111 (PhCMV*-1-SEAP-pA).
Initial experiments to construct the band-pass network focused on determining the relative differences in reporter gene expression levels for different combinations of repressors (E, E-KRAB, Pip and Pip-KRAB) for both the low- and high-threshold detection components (Figure 5). Differences in the inherent ability of E and Pip to repress expression from their cognate promoters (PETRON and PPIRON, respectively) were reflected in the differing induction characteristics of the various low-threshold configurations (Figure 5A). In both its native form, and when fused with the KRAB transcriptional silencer domain, Pip was a stronger repressor than E, as evident by comparing SEAP expression in the absence of Tet. However, this was also reflected in lower maximal expression levels, which occurred in the presence of Tet, which were caused by residual repression of the respective repressor from their PhCMV*-1-driven promoters. Coupling each repressor with the KRAB domain significantly exacerbated this affect (29,30). Taken together, the E-KRAB and native Pip utilizing configurations provided the greatest dynamic induction range. Accordingly, these configurations were further used to determine the optimal configuration for the high-threshold componentry.
Figure 5.

Configuration testing of low-threshold (A) and high-threshold (B) detection components. In all cases, CHOtTA (PhCMV*-1-tTA) cells were transiently transfected with indicated constructs and grown in the presence or absence of 1 mg/ml tetracycline (Tet).
Two sets of high-threshold configurations were tested for each of E-KRAB and native Pip. In the first set, PhCMV*-1-driven E-KRAB (pDG200) was linked to PETRON-driven expression of either Pip (pDG238) or Pip-KRAB (pBP92), with final read-out provided by PPIRON-driven SEAP expression (pMF208). In the second set, PhCMV*-1-driven Pip (pDG202) was linked to PPIRON-driven expression of either E (pDG237) or E-KRAB (pBP62), with corresponding final read-out provided by PETRON-driven SEAP expression (pWW56). Of these configurations, only the second set, with native Pip as intermediary repressor, resulted in directionally correct readout for a double inversion function in which SEAP expression was reduced in the presence of Tet (Figure 5B). Of these, the Pip to E-KRAB cascade resulted in the greatest fold decrease, compared to the configuration utilizing E as the secondary repressor. Significantly these configurations either did not exhibit the double inversion function (E-KRAB to Pip cascade), or resulted in non-expression irrespective of Tet presence (E-KRAB to Pip-KRAB cascade). These results are consistent with model predictions in which a double inversion is dependent upon the strength of the intermediary repressor (TR2) relative to the secondary repressor (TR3) (see also Figure 3E). Critically, an intermediary repressor that represses too tightly will not result in inversion of the input signal as the resulting K constants for the respective systems would not be sufficiently far apart.
Based on these initial componentry observations, a putative band-pass network was tested by utilizing E-KRAB as the low-threshold TR1 repressor, and Pip and E-KRAB as the TR2 and TR3 high-threshold repressors, respectively (Figure 6A). In this arrangement, the final repressors of each threshold (TR1 and TR3) operated on the same cognate promoter (PETRON) to drive SEAP expression. Expression profiling across a Tet concentration gradient revealed an expression read-out in which SEAP expression was repressed at Tet concentrations below 25 ng/ml; and again at concentrations above 250 ng/ml, indicating that the low and high-threshold componentry were inter-operable (Figure 6B). Significantly, at intermediate concentrations SEAP expression increased to levels that were ∼5- and 2-fold greater than at the respective lower and upper Tet concentration ranges. Override of both the low- and high-component thresholds, through the addition of the E-KRAB responsive inducer erythromycin, resulted in SEAP expression of 8.49 U/L (±1.36 U/L) which was 2-fold higher than the maximum observed band-pass. This suggests some degree of repression, from either the low or high componentry, was in existence across the entire Tet concentration range with the observed positive band-pass expression pattern reflecting the existence of an intermediate Tet concentration range in which the low-threshold componentry depression was not completely offset by activated repression of the high-threshold componentry.
Figure 6.

(A) Schematic depiction of band-pass network including both low- and high-threshold componentry. (B) Tetracycline (Tet) dose–response profile of CHOtTA transiently transfected with band-pass network componentry pDG200, pDG202, pBP62 and pWW56.
Network optimization of band-pass characteristics
As both low- and high-componentry characteristics, and the resulting band-pass network, are dependent upon the relative repression characteristics of the underlying components, we sought to further optimize the band-pass network by altering plasmid ratios during transfection. Decreasing the relative expression level of E-KRAB within the low-threshold componentry (by reducing pDG200 during transfections) resulted in an increase in de-repressed maximal SEAP expression with a relatively lower increase in fully repressed SEAP expression (Figure 7A). This was manifested most when the ratio of SEAP reporter plasmid (pWW56) to E-KRAB expressing plasmid (pDG200) reached 5 to 1 at which point maximal expression had increased 81% with only a 41% increase in residual expression (resulting in a differential expression of 11-fold). Beyond this ratio, maximal SEAP expression did not significantly increase while repressed SEAP expression did, thus indicating that at higher than 5:1 ratios E-KRAB was present in insufficient quantity to effectively repress PETRON-driven SEAP expression.
Figure 7.

Ratio optimization of band-pass components and network. (A) Low-threshold performance assessed by varying target gene controlling E-KRAB (pDG200; PhCMV*-1-E-KRAB) plasmid concentration while maintaining target gene encoding plasmid (pWW56; PETRON-SEAP) at fixed concentration. (B) High-threshold performance assessed by varying PPIRON controlling Pip (pDG202; PhCMV*-1-Pip), and target gene controlling E-KRAB (pDG200; PPIRON-E-KRAB), plasmid concentrations while maintaining target gene encoding plasmid (pWW56; PETRON-SEAP) at fixed concentration. (C) Band-pass performance assessed by varying ratio of total low-threshold optimized componentry (0.2:1; pDG200:pWW56) to total high-threshold optimized componentry (0.25:0.5:1; pDG202:pBP62:pWW56).
Similar experiments performed on the high-threshold componentry revealed that the dynamic expression range could also be expanded by reducing upstream components on the double repressor cascade (Pip and E-KRAB) (Figure 7B). An optimal expression range was evidenced at a PETRON-SEAP to PPIRON-E-KRAB to PhCMV*-1-Pip ratio of 4:2:1. In a final optimization step, the optimized low-and high-threshold components were combined in differing ratios to test which produced the most robust band-pass functionality (Figure 7C). Of the three combinations tested, the 1:1 combination produced the most balanced band-pass functionality with peak SEAP expression of 8.7 U/L (±0.6 U/L) at 50 ng/ml which was 6- and 4-fold higher than SEAP expression at low (0) and high (1000 ng/ml) Tet concentrations, respectively. The other two combinations also produced band-pass functionality but with expression profiles that reflected the relative concentration difference of each threshold component. Thus, a higher concentration of low-threshold components produced an expression profile in which SEAP repression was effective at low Tet concentrations but less so at high Tet concentrations. The opposite occurred when high-threshold components were expressed at relatively higher concentrations. Differences in the Tet concentration at which peak SEAP expression occurred were also evident between the different combinations with stronger low-threshold componentry drawing the peak lower and vice versa for stronger high-threshold componentry. The ability to alter the sensing capability of the system to either expands its dynamic range or move its maximal sensing point suggests that the system is amenable to being tuned to differing input concentrations.
Kinetic evolution of band-pass functionality
The existence of an intermediate Tet concentration range, in which the low-threshold componentry depression was not completely offset by activated repression of the high-threshold componentry, could only occur if de-repression of the low-threshold componentry occurred at a faster rate or lower Tet concentration than activated repression of the high-threshold componentry. To further explore the underlying dynamic driving this outcome, a kinetic study of the optimized band-pass network was performed (Figure 8). Expression profiling revealed differences in the Tet concentration range within which expression switching occurred. Whereas induction from the low-threshold componentry occurred consistently around 50 ng/ml Tet (Figure 8A), effective repression from the high-threshold componentry occurred at lower Tet concentrations earlier during the time course compared to later in the time course (Figure 8B). A similar shift was observed for the band-pass network (Figure 8C) in which positive band-pass behaviour only became observable from 24 h onwards. However, at this time point, the band peak was manifested at a lower Tet concentration (50 ng/ml) compared to 36 h and beyond where it stabilized at around 100 ng/ml. This is consistent with modelling predictions due to the ‘lag’ time inherent to the double-level high-threshold cascade being longer than that of the single level low-threshold cascade (Figure 3G and H).
Figure 8.

Kinetic study of target gene expression at 15, 26, 39 and 48 h post-transfection of optimized low-threshold (A), high-threshold (B) and band-pass network (C) components. Dose–response profile at varying tetracycline (Tet) concentrations depicted.
Spatio-temporal band formation in CHO cells
We next sought to assess whether the optimized band-pass network could respond to a mock ‘morphogen-like’ gradient to produce a differentiation-like pattern across a layer of CHO cells (Figure 9). In an adaptation of the Kirby–Bauer Disc Diffusion Methodology, a uniform transfected layer of CHO cells were exposed to a tetracycline concentration gradient which was established by cultivating the cell layer in solidified culture media, and allowing known aliquots of tetracycline to diffuse through the solid media (44). Using an Ubv76 destabilized variant of GFP as the target reporter gene it was possible to discern differences in expression levels, for both standard gradated gene control (Figure 9D) and for the low and high thresholds and for the complete band-pass network, in response to physical cellular position along the concentration gradient (Figure 9E–H). Significantly, by altering the concentration of tetracycline initially applied, and therefore changing the strength of the concentration gradient, it was possible observe differences in band formation position therefore indicating that the network was capable of detecting a specific inducer concentration within a gradient. Identical experiments using native GFP also produced similar patterns, although these were less discernible from background GFP expression levels (data not shown). Given the shorter half-life of Ubv76 destabilized GFP, we suggest that it more accurately reflects the expression status of a cell at any given point along the concentration gradient thereby producing a more discernable pattern from background expression levels.
Figure 9.

(A) Schematic depiction of experimental set-up for band-pass pattern formation across a ‘morphogen-like’ concentration gradient. Agarose containing media was laid over transfected CHOtTA cells with a tetracycline concentration gradient established via diffusion of tetracycline from a central absorbent disc. Target gene expression was assessed 48 h post-transfection. (B) Phase-contrast and (C) fluorescence microscopy mosaic images of CHOtTA cells transfected with constitutively expressed GFP (pLEGFP-NI). (D) CHOtTA cells transfected with tTA-driven expression of GFP (pDG295; PhCMV*-1-Ubv76-GFP). Expression profiling of CHOtTA transfected with low-threshold (E; pDG200; PhCMV*-1-E-KRAB and pND9; PETRON- Ubv76-GFP), high-threshold (F; pDG202; PhCMV*-1-Pip; pBP62; PPIRON-E-KRAB and pND9; PETRON- Ubv76-GFP) and complete band-pass componentry (G and H; pDG200; PhCMV*-1-E-KRAB, pDG202; PhCMV*-1-Pip; pBP62; PPIRON-E-KRAB and pND9; PETRON- Ubv76-GFP) at low [5 ug; (E–G)] and high (50 ug; H) tetracycline starting concentrations.
In this study, we have designed a synthetic gene network that is capable of detecting intermediate concentrations of a stimulus molecule. The system utilized multiple well-known transcriptional control modalities which were selected and optimized in their interaction with one another to produce the requisite band-pass characteristics. By engineering a mammalian genetic circuitry that is capable of sensing a specific concentration within a morphogen gradient we have emulated a mechanism that serves as a pre-condition for positional-specification and subsequent organized pattern formation. We see the design of this and similar systems as critical steps towards creating designer cells and tissues that will ultimately foster advances in next-generation therapeutic and bioprocessing applications.
FUNDING
The Swiss National Science Foundation (grant no. 31003 A-126022); and in part by the EC Framework 7 (Persist). Funding for open access charge: ETH Zurich.
Conflict of interest statement. None declared.
REFERENCES
- 1.Ashe HL, Briscoe J. The intepretation of morphogen gradients. Development. 2006;133:385–394. doi: 10.1242/dev.02238. [DOI] [PubMed] [Google Scholar]
- 2.Jaeger J, Irons D, Monk N. Regulative feedback in pattern formation: towards a general relativistic theory of positional information. Development. 2008;135:3175–3183. doi: 10.1242/dev.018697. [DOI] [PubMed] [Google Scholar]
- 3.Lander AD. Morpheus unbound: reimagining the morphogen gradient. Cell. 2007;128:245–256. doi: 10.1016/j.cell.2007.01.004. [DOI] [PubMed] [Google Scholar]
- 4.Driever W, Nusslein-Volhard C. The bicoid protein determines position in the Drosophila embryo in a concentration-dependent manner. Cell. 1988;54:95–104. doi: 10.1016/0092-8674(88)90183-3. [DOI] [PubMed] [Google Scholar]
- 5.Ferguson EL, Anderson KV. Decapentaplegic acts as a morphogen to organize dorsal-ventral pattern in the Drosophila embryo. Cell. 1992;71:451–461. doi: 10.1016/0092-8674(92)90514-d. [DOI] [PubMed] [Google Scholar]
- 6.Nellen D, Burke R, Struhl G, Basler K. Direct and long range action of a DPP morphogen gradient. Cell. 1996;85:357–368. doi: 10.1016/s0092-8674(00)81114-9. [DOI] [PubMed] [Google Scholar]
- 7.Lechner H, Josten F, Fuss B, Bauer R, Hoch M. Cross regulation of intercellular gap junction communication and paracrine signaling pathways during organogenesis in Drosophila. Dev. Biol. 2007;310:23–34. doi: 10.1016/j.ydbio.2007.07.008. [DOI] [PubMed] [Google Scholar]
- 8.Wolpert L. Positional information and the spatial pattern of cellular differentiation. J. Theor. Biol. 1969;25:1–47. doi: 10.1016/s0022-5193(69)80016-0. [DOI] [PubMed] [Google Scholar]
- 9.Jaeger J, Surkova S, Blagov M, Janssens H, Kosman D, Kozlov KN, Manu Myasnikova E, Vanario-Alonso CE, Samsonova M. Dynamic control of positional information in the early Drosophila embryo. Nature. 2004;430:368–371. doi: 10.1038/nature02678. [DOI] [PubMed] [Google Scholar]
- 10.Giurumescu CA, Asthagiri AR. Signal processing during developmental multicellular patterning. Biotechnol. Prog. 2008;24:80–88. doi: 10.1021/bp070127t. [DOI] [PubMed] [Google Scholar]
- 11.Meinhardt H, Gierer A. Pattern formation by local self-activation and lateral inhibition. BioEssays. 2000;22:753–760. doi: 10.1002/1521-1878(200008)22:8<753::AID-BIES9>3.0.CO;2-Z. [DOI] [PubMed] [Google Scholar]
- 12.Atkinson MR, Savageau MA, Myers JT, Ninfa AJ. Development of genetic circuitry exhibiting toggle switch or oscillatory behavior in Escherichia coli. Cell. 2003;113:597–607. doi: 10.1016/s0092-8674(03)00346-5. [DOI] [PubMed] [Google Scholar]
- 13.Gardner TS, Cantor CR, Collins JJ. Construction of a genetic toggle switch in Escherichia coli. Nature. 2000;403:339–342. doi: 10.1038/35002131. [DOI] [PubMed] [Google Scholar]
- 14.Elowitz MB, Leibler S. A synthetic oscillatory network of transcriptional regulators. Nature. 2000;403:335–338. doi: 10.1038/35002125. [DOI] [PubMed] [Google Scholar]
- 15.Karig D, Weiss R. Signal-amplifying genetic circuit enables in vivo observation of weak promoter activation in the Rhl quorum sensing system. Biotechnol. Bioeng. 2005;89:709–718. doi: 10.1002/bit.20371. [DOI] [PubMed] [Google Scholar]
- 16.Basu S, Mehreja R, Thiberge S, Chen MT, Weiss R. Spatiotemporal control of gene expression with pulse-generating networks. Proc. Natl Acad. Sci. USA. 2004;101:6355–6360. doi: 10.1073/pnas.0307571101. [DOI] [PMC free article] [PubMed] [Google Scholar]
- 17.Basu S, Karig D, Weiss R. Engineering signal processing in cells. Towards molecular concentration band detection. Nat. Comput. 2003;2:463–478. [Google Scholar]
- 18.Basu S, Gerchman Y, Collins CH, Arnold FH, Weiss R. A synthetic multicellular system for programmed pattern formation. Nature. 2005;434:1130–1134. doi: 10.1038/nature03461. [DOI] [PubMed] [Google Scholar]
- 19.Hasty J, McMillen D, Collins JJ. Engineered gene circuits. Nature. 2002;420:224–230. doi: 10.1038/nature01257. [DOI] [PubMed] [Google Scholar]
- 20.Gossen M, Bujard H. Tight control of gene expression in mammalian cells by tetracycline-responsive promoters. Proc. Natl Acad. Sci. USA. 1992;89:5547–5551. doi: 10.1073/pnas.89.12.5547. [DOI] [PMC free article] [PubMed] [Google Scholar]
- 21.Kramer BP, Fussenegger M. Hysteresis in a synthetic mammalian gene network. Proc. Natl Acad. Sci. USA. 2005;102:9517–9522. doi: 10.1073/pnas.0500345102. [DOI] [PMC free article] [PubMed] [Google Scholar]
- 22.Kramer BP, Viretta AU, Daoud-El-Baba M, Aubel D, Weber W, Fussenegger M. An engineered epigenetic transgene switch in mammalian cells. Nat. Biotechnol. 2004b;22:867–870. doi: 10.1038/nbt980. [DOI] [PubMed] [Google Scholar]
- 23.Kramer BP, Fischer C, Fussenegger M. BioLogic gates enable logical transcription control in mammalian cells. Biotechnol. Bioeng. 2004a;87:478–484. doi: 10.1002/bit.20142. [DOI] [PubMed] [Google Scholar]
- 24.Rinaudo K, Bleris L, Maddamsetti R, Subramanian S, Weiss R, Benenson Y. A universal RNAi-based logic evaluator that operates in mammalian cells. Nat. Biotechnol. 2007;25:795–801. doi: 10.1038/nbt1307. [DOI] [PubMed] [Google Scholar]
- 25.Weber W, Kramer BP, Fussenegger M. A genetic time-delay circuitry in mammalian cells. Biotechnol. Bioeng. 2007a;98:894–902. doi: 10.1002/bit.21463. [DOI] [PubMed] [Google Scholar]
- 26.Weber W, Stelling J, Rimann M, Keller B, Daoud-El Baba M, Weber CC, Aubel D, Fussenegger M. A synthetic time-delay circuit in mammalian cells and mice. Proc. Natl Acad. Sci. USA. 2007b;104:2643–2648. doi: 10.1073/pnas.0606398104. [DOI] [PMC free article] [PubMed] [Google Scholar]
- 27.Chilov D, Fussenegger M. Toward construction of a self-sustained clock-like expression system based on the mammalian circadian clock. Biotechnol. Bioeng. 2004;87:234–242. doi: 10.1002/bit.20143. [DOI] [PubMed] [Google Scholar]
- 28.Tigges M, Marquez-Lago TT, Stelling J, Fussenegger M. A tunable synthetic mammalian oscillator. Nature. 2009;457:309–312. doi: 10.1038/nature07616. [DOI] [PubMed] [Google Scholar]
- 29.Weber W, Fux C, Daoud-el Baba M, Keller B, Weber CC, Kramer BP, Heinzen C, Aubel D, Bailey JE, Fussenegger M. Macrolide-based transgene control in mammalian cells and mice. Nat. Biotechnol. 2002a;20:901–907. doi: 10.1038/nbt731. [DOI] [PubMed] [Google Scholar]
- 30.Fussenegger M, Morris RP, Fux C, Rimann M, von Stockar B, Thompson CJ, Bailey JE. Streptogramin-based gene regulation systems for mammalian cells. Nat. Biotechnol. 2000;18:1203–1208. doi: 10.1038/81208. [DOI] [PubMed] [Google Scholar]
- 31.Greber D, Daoud-El-Baba M, Fussenegger M. Intronically encoded siRNAs improve dynamic range of mammalian gene regulation systems and toggle switch. Nucleic Acids Res. 2008;36:e101. doi: 10.1093/nar/gkn443. [DOI] [PMC free article] [PubMed] [Google Scholar]
- 32.Fussenegger M, Mazur X, Bailey JE. A novel cytostatic process enhances the productivity of Chinese hamster ovary cells. Biotechnol. Bioeng. 1997a;55:927–939. doi: 10.1002/(SICI)1097-0290(19970920)55:6<927::AID-BIT10>3.0.CO;2-4. [DOI] [PubMed] [Google Scholar]
- 33.Fussenegger M, Moser S, Mazur X, Bailey JE. Autoregulated multicistronic expression vectors provide one-step cloning of regulated product gene expression in mammalian cells. Biotechnol. Prog. 1997b;13:733–740. doi: 10.1021/bp970108r. [DOI] [PubMed] [Google Scholar]
- 34.Moser S, Schlatter S, Fux C, Rimann M, Bailey JE, Fussenegger M. An update of pTRIDENT multicistronic expression vectors: pTRIDENTs containing novel streptogramin-responsive promoters. Biotechnol. Prog. 2000;16:724–735. doi: 10.1021/bp000077r. [DOI] [PubMed] [Google Scholar]
- 35.Weber W, Marty RR, Keller B, Rimann M, Kramer BP, Fussenegger M. Versatile macrolide-responsive mammalian expression vectors for multiregulated multigene metabolic engineering. Biotechnol. Bioeng. 2002b;80:691–705. doi: 10.1002/bit.10461. [DOI] [PubMed] [Google Scholar]
- 36.Tigges M, Denervaud N, Greber D, Stelling J, Fussenegger M. A synthetic low-frequency mammalian oscillator. Nucleic Acids Res. 2010;38:2702–2711. doi: 10.1093/nar/gkq121. [DOI] [PMC free article] [PubMed] [Google Scholar]
- 37.Greber D, Fussenegger M. Multi-gene engineering: simultaneous expression and knockdown of six genes off a single platform. Biotechnol. Bioeng. 2007;96:821–834. doi: 10.1002/bit.21303. [DOI] [PubMed] [Google Scholar]
- 38.Berger J, Hauber J, Hauber R, Geiger R, Cullen BR. Secreted placental alkaline phosphatase: a powerful new quantitative indicator of gene expression in eukaryotic cells. Gene. 1988;66:1–10. doi: 10.1016/0378-1119(88)90219-3. [DOI] [PubMed] [Google Scholar]
- 39.Schlatter S, Rimann M, Kelm J, Fussenegger M. SAMY, a novel mammalian reporter gene derived from Bacillus stearothermophilus alpha-amylase. Gene. 2002;282:19–31. doi: 10.1016/s0378-1119(01)00824-1. [DOI] [PubMed] [Google Scholar]
- 40.Rossi FM, Kringstein AM, Spicher A, Guicherit OM, Blau HM. Transcriptional control: rheostat converted to on/off switch. Mol. Cell. 2000;6:723–728. doi: 10.1016/s1097-2765(00)00070-8. [DOI] [PubMed] [Google Scholar]
- 41.Malphettes LM, Fussenegger M. Impact of RNA interference on gene networks. Met. Eng. 2006;8:672–683. doi: 10.1016/j.ymben.2006.07.005. [DOI] [PubMed] [Google Scholar]
- 42.Weber W, Fussenegger M. Pharmacologic transgene control systems for gene therapy. J. Gene Med. 2006;8:535–556. doi: 10.1002/jgm.903. [DOI] [PubMed] [Google Scholar]
- 43.Becskei A, Serrano L. Engineering stability in gene networks by autoregulation. Nature. 2000;405:590–593. doi: 10.1038/35014651. [DOI] [PubMed] [Google Scholar]
- 44.von Recum AF, editor. Handbook of Biomaterials Evaluation: Scientific, Technical and Clinical Testing of Implant Materials. 2nd edn. CRC Press; 1999. [Google Scholar]