Abstract
Quantitative real-time PCR for the detection of respiratory syncytial virus (RSV) RNA is increasingly used to study the causal role of RSV in lower airway disease. The objective of our study was to evaluate variations in RSV RNA loads at different steps in the RNA quantification process: (i) variation in RSV RNA load within one sample (step 1), (ii) variation in the load in samples from patients who were sampled twice on the same day (step 2), and (iii) variation in the load between simultaneously taken nasopharyngeal aspirate (NPA) samples and tracheal aspirate (TA) samples (step 3). Thirty-two infants with RSV infection at the pediatric intensive care unit (PICU) were included. NPA and TA samples were taken three times a week during ventilation and were not diluted. Intrasample variation (step 1) was shown to be minimal (<0.5 log10 particles/ml). Intraday variation (step 2) was the lowest for samples with high viral loads (95% limits of agreement, −1.3 to +0.9 log10), whereas it increased for samples with relatively lower viral loads (viral load, <6.0 log10 particles/ml; n = 138 sample pairs from 20 patients). RSV loads in NPA and TA samples (step 3) were found to be the most comparable during the early phase of infection (95% limits of agreement, −1.5 to +1.4 log10). The variation increased during the late phase of infection (i.e., in follow-up samples), with the loads in NPA samples remaining significantly higher than the loads in TA samples (n = 138 sample pairs from 31 patients). In conclusion, quantitative detection of RSV RNA in undiluted mucus is a reliable method to quantify viral loads. Nasopharyngeal aspirate samples collected in the initial phase of infection can be used to predict RSV RNA loads in the lower airways.
Respiratory syncytial virus (RSV) lower respiratory tract infections (LRTIs) cause significant hospitalization among young children. It is currently unclear why most children experience relatively mild symptoms, whereas a small subgroup of children develop respiratory failure, necessitating mechanical ventilation at the pediatric intensive care unit (PICU) (4, 7, 12). Quantitative RSV detection is paramount to study the relation between RSV infection and LRTI severity. Traditionally, quantitative detection of infectious virus has been performed using viral culture, which is labor-intensive and which has a low sensitivity (3, 5). Currently, real-time PCR assays have become available to measure the RSV RNA load, greatly expanding opportunities for respiratory viral load research (8, 10, 11).
Quantitative RSV detection is complicated by several issues. First, mucus secretions from the airways are nonhomogeneous, and intrasample variability may pose a problem. Second, the amount and composition of airway secretions over time are variable, which may lead to intraday variability in the RSV concentration. Third, the lower respiratory tract is not easily accessible for sampling. Therefore, the RSV load is usually detected in nasopharyngeal aspirate (NPA) specimens as a surrogate measure for the RSV load in the lower airways. However, it is unclear whether the RSV load in the upper airways reflects the RSV load in the lower respiratory tract (2). The aim of our study was to evaluate variations in RSV RNA loads during different steps of quantitative real-time PCR detection of RSV RNA in NPA samples by evaluating (i) variation in the loads within respiratory samples (intrasample variation), (ii) variation in the loads in samples from patients who were sampled twice on the same day (intraday variation), and (iii) variation in the loads in samples taken simultaneously from different sites (upper and lower airways).
MATERIALS AND METHODS
Patients.
The prospective study described here included mechanically ventilated infants with RSV LRTIs at the PICU of the Wilhelmina Children's Hospital from November 2007 through February 2009. Wilhelmina Children's Hospital is a tertiary-care university hospital with a 16-bed PICU facility and serves as a referral center for the central part of the Netherlands. NPA and tracheal aspirate (TA) samples were taken simultaneously after admission to the PICU. Since the viral load is believed to decline over time, follow-up samples were taken 3 times a week to obtain clinical samples with a broad range of viral loads (13, 14). When paired sampling of NPA and TA specimens was not possible due to insufficient mucus available at either the nasopharynx or the trachea, a second attempt to obtain the missing sample was made shortly after the first attempt (usually within 2 h and never more than 5 h later). Intraday variation in the load was assessed by taking two samples on the same day (between 8 a.m. and 4 p.m.). Routinely, the first samples were collected at 8.00 a.m., unless no mucus could be collected at that time. The second sample was collected 2 to 4 h later, whenever enough mucus was available. The parents or guardians of all patients provided written informed consent. The local ethics committee approved the study protocol.
Specimens.
Respiratory secretions were aspirated in a standardized manner directly from the nasopharynx (NPA samples) and trachea (TA samples) in a sterile fashion by dedicated hospital staff and were not diluted. Samples (50 μl minimum) were immediately transported to the laboratory. Due to the difficulties met when highly viscous samples are handled, we developed a method to quantify the amount of input material as adequately as possibly. First, we suspended the collected sample in 500 μl Dulbecco's modified Eagle's medium (DMEM) with 100 μg/ml of a broad-spectrum three-antibiotic combination, penicillin, streptomycin, and amphotericin B (Normocin). The resuspended sample was then transferred to an Eppendorf tube of known weight. Finally, we weighed the tube plus its contents and subtracted the weight of the tube, as well as 0.5 g (DMEM); the result is the weight of the initial sample. The actual dilution of each sample was calculated using sample weight, for later correction of real-time PCR and viral culture results (see below). Samples were processed directly for viral culture and were subsequently stored at −80°C for real-time PCR testing.
Quantitative real-time PCR. (i) Nucleic acid preparation.
RNA extraction was performed with samples pretreated with sputolysin (Calbiochem, San Diego, CA) by using a MagnaPure LC total nucleic acid kit (Roche Diagnostics, Mannheim, Germany). Briefly, 250 μl sputolysin (1:10 dilution in high-pressure liquid chromatography-grade water [J. T. Baker, Phillipsburg, NJ]) was added to 250 μl sample, and the mixture was homogenized by vortexing for 30 s. The homogenate was incubated for 15 min at room temperature and centrifuged at 214 × g for 5 min. Two-hundred microliters of the supernatant was mixed with lysis buffer and proteinase K, and the mixture was subsequently incubated with magnetic particles to allow binding of the nucleic acid. Unbound material was removed by several washing steps. The RNA was then eluted in 100 μl of elution buffer and used directly for cDNA synthesis and real-time TaqMan PCR. The isolated viral RNA was reverse transcribed using a MultiScribe reverse transcriptase (RT) kit and random hexamers (Applied Biosystems, Foster City, CA), according to the manufacturer's guidelines, followed by RT inactivation for 5 min at 95°C. Each 100-μl reaction mixture contained 40 μl of eluted RNA, 10 μl of 10× RT buffer (Applied Biosystems, Foster City, CA), 5.5 mmol/liter MgCl2, 500 μmol/liter of each deoxynucleoside triphosphate, 2.5 μmol/liter random hexamer, 0.4 U of RNase inhibitor per μl, and 1.25 U of Multiscribe reverse transcriptase per μl (all from Applied Biosystems). Murine encephalomyocarditis (EMC) virus (an RNA virus) was used as an internal control; a standardized amount of this virus was added to the initial patient sample before nucleic acid preparation was started.
(ii) Real-time PCR.
Primers and probes for both RSV type A (RSV-A) and RSV-B were selected using primer express software (PE Applied Biosystems, Foster City, CA) and were based on highly conserved genomic regions of the N gene (11). To cover subgroups, primers and probes specific for RSV types A and B were chosen. The following forward and reverse primers were used: primers RSV A-forward (5′-AGATCAACTTCTGTCATCCAGCAA), RSV A-reverse (5′-TTCTGCACATCATAATTAGGAGTATCAAT), RSV B-forward (5′-AAGATGCAAATCATAAATTCACAGGA), and RSV B-reverse (5′ TGATATCCAGCATCTTTAAGTATCTTTATAGTG) and RSV-A probe 5′-CACCATCCAACGGAGCACAGGAGAT and RSV-B probe: 5′-TTCCCTTCCTAACCTGGACATAGCATATAACATACCT.
Primers and probes were tested for possible interactions to make sure that they could be used together in a multiplex assay. After optimization of the primer and probe concentrations, samples were assayed in duplicate in a 50-μl reaction mixture containing 20 μl of cDNA, 25 μl of 2× TaqMan universal PCR master mix (PE Applied Biosystems, Foster City, CA), 900 nM concentrations of forward and reverse primers for RSV-A, 300 nM concentrations of forward and reverse primers for RSV-B, 60 nM probe RSV-A, and 68 nM probe RSV-B. Both fluorogenic probes were labeled with the 5′ reporter dye 6-carboxyfluorescein (FAM) and the 3′ quencher dye 6-carboxytetramethylrhodamine (TAMRA). Amplification and detection were performed with an ABI Prism 7900 sequence detection system under the following conditions: 2 min at 50°C to attain optimal AmpErase uracil-N-glycosylase activity, 10 min at 95°C to activate the AmpliTaq Gold DNA polymerase, and 45 cycles of 15 s at 95°C and 1 min at 60°C. Samples were controlled for the presence of possible inhibitors of the amplification reaction by use of the indicated internal control (EMC virus), the signals of which had to range within previously determined and validated boundaries of acceptance. Real-time PCR results were expressed in cycle threshold (CT) values. For positive samples, adjusted CT values were calculated through correction of CT values for the initial dilution of the samples, and the adjusted CT values were converted to the number of particles/ml using standardization curves generated with stocks counted by electron microscopy. A CT value of 20 corresponded to 2.9 × 10⁹ particles/ml, and a CT value of 30 equaled 6.9 × 10⁶ particles/ml. For negative samples, a value of 0.5 times the detection limit was used (390 particles/ml; detection limit, 780 particles/ml). Intrasample variation was assessed by dividing material from nine NPA samples and nine TA samples into three aliquots. Each aliquot was separately subjected to sputolysin treatment, RNA isolation, cDNA synthesis, and amplification.
Quantitative viral culture.
Fresh NPA samples were immediately inoculated onto 96-well tissue culture plates to determine the viral titer. For each sample, seven dilution series consisting of 12 5-fold dilutions (30 μl) were added to HEp-2 cell monolayers (70% confluence) in 120 μl DMEM supplemented with 5% fetal calf serum (FCS). RSV quantitative standards were run in parallel with each assay. The RSV quantitative standards were from the supernatant of RSV-B grown in HEp-2 cells and frozen at −80°C in 50% FCS. Analyses of cytopathologic effects were performed by a technician highly skilled in the art over a 10-day period. The viral titer was calculated as the 50% tissue culture infective dose (TCID50) per ml using the Spearman-Kärber method (6).
Statistical analysis.
Median values are reported with interquartile ranges (IQRs). Mean values are reported with 95% confidence intervals (CIs). Scatter plots and Bland-Altman plots (1) with 95% limits of agreement (95% of the differences fall between the limits of agreement) were constructed. For the comparison of the nasopharyngeal and tracheal loads, two NPA samples and two TA samples taken on the same day were available in some instances. The CT values for the two NPA samples and the two TA samples were then averaged to obtain no more than one result pair per day.
RESULTS
Patients.
Thirty-two patients with RSV LRTIs were included. The median age was 1.6 months (IQR, 1.4 months). Patients remained ventilated for a median duration of 10 days (IQR, 4.0 days). We identified RSV-A in 27 patients (84%) and RSV-B in 4 patients (13%), and 1 patient tested positive for both RSV-A and RSV-B (3%).
Variation in RNA isolation and PCR process (intrasample variation).
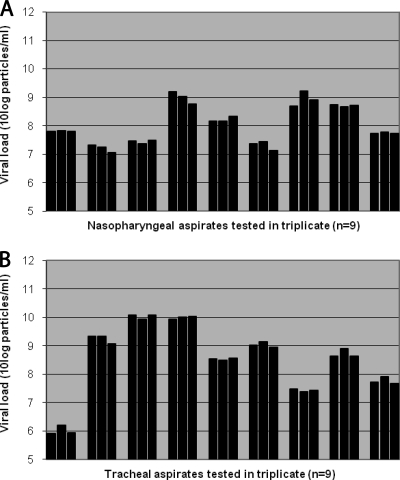
Nine NPA samples were divided into three aliquots, and RNA isolation and real-time PCR were performed separately for each aliquot. The difference between the three aliquots of each NPA sample was, on average, 0.22 log10 particles/ml (range, 0.03 to 0.5 log10 particles/ml; Fig. 1 A). Similarly, nine TA samples were tested, showing similar results. The maximal difference between the three aliquots of TA samples was, on average, 0.18 log10 particles/ml (range, 0.07 to 0.3 log10 particles/ml; Fig. 1B).
FIG. 1.
Intrasample variation between aliquots of NPA and TA samples. Differences in viral loads between three aliquots of each NPA sample (A) or TA sample (B) were determined by real-time PCR and were found to be, on average, 0.22 log10 particles/ml (range, 0.03 to 0.5 log10 particles/ml) and 0.18 log10 particles/ml (range, 0.07 to 0.3 log10 particles/ml), respectively.
Variation in samples taken on the same day (intraday variation).
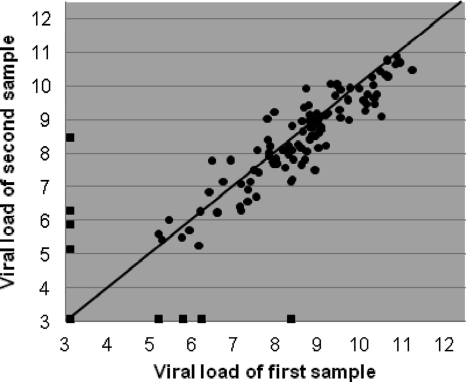
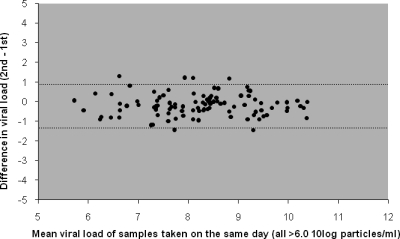
Twenty patients were sampled twice on the same day during their stay at the PICU on a total of 138 days (77 NPA sample pairs and 61 TA sample pairs). The mean (standard deviation [SD]) time interval between sample collections was 3.8 h (1.9 h). Both samples in 106 sample pairs were positive, and both samples in 24 pairs were negative. Eight sample pairs consisted of a positive and a negative sample, with the viral loads for the positive sample ranging from 4.7 to 8.0 log10 particles/ml (median, 5.6 log10 particles/ml). When the results from all sample pairs were plotted against each other, the variation was large, mainly due to the eight sample pairs with one positive and one negative sample (Fig. 2). When the double-positive sample pairs with mean viral loads higher than 6.0 log10 particles/ml were analyzed separately, the agreement of the results between samples taken on the same day was high, with the 95% limits of agreement being −1.3 and 0.9 log10 particles/ml (Fig. 3). The results for the second samples were, on average, 0.16 log10 particles/ml (95% CI, 0.06 to 0.3 log10 particles/ml) lower than the results for the first sample, indicating that RSV RNA loads dropped slightly between the times of collection of the first and second samples (P = 0.005, paired-samples t test). In general, intraday changes in consistency for multiple samples from individual patients were rare and did not relate to viral load differences.
FIG. 2.
Intraday variation between samples taken on the same day. Differences in viral loads between 138 pairs of samples from 20 patients taken twice daily are shown. The mean time interval between sample collections was 3.8 h (standard deviation, 1.9 h). The diagonal line represents 100% agreement. Squares at the outer limits of the graph represent sample pairs in which only one sample was positive. Both samples in 24 sample pairs were negative; these data are represented by the square at the intercept of the x and y axes, corresponding to a viral load of 2.6 log10 particles/ml for both samples.
FIG. 3.
Intraday variation between results for 100 pairs of samples with viral loads of >6.0 log10 particles/ml taken from 20 patients twice on the same day. Dotted lines represent 95% limits of agreement (95% of the differences lie between −1.3 and 0.94 log10 particles/ml).
Upper versus lower airway detection.
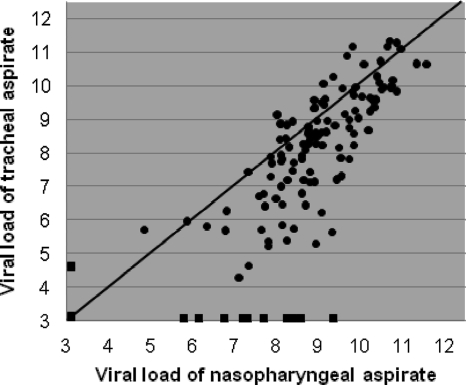
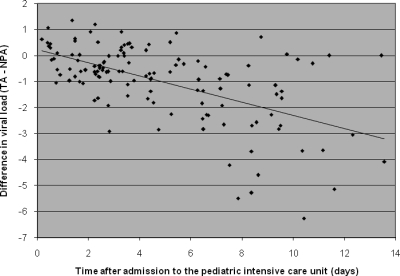
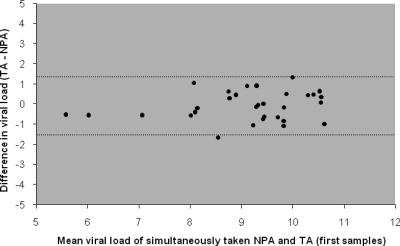
Thirty-one patients provided a total of 138 simultaneously taken, paired NPA and TA samples ranging in volume from 50 to 500 μl. Both samples in 115 sample pairs were positive and both samples in 13 pairs were negative. Ten sample pairs consisted of a positive and a negative sample, with the viral loads of the positive sample ranging from 4.1 to 8.9 log10 particles/ml (median, 6.9 log10 particles/ml). In 9 out of the latter 10 sample pairs, the NPA sample was positive and the TA sample was negative. When results from all sample pairs were plotted against each other, the variation was large, especially toward the relatively lower viral load values (Fig. 4). Notably, the results for sample pairs with viral loads toward the lower values were not distributed symmetrically above and under the line of equality. When all samples were analyzed, NPA samples had a viral load that was, on average, 0.64 log10 particles/ml (95% CI, 0.42 to 0.86 log10 particles/ml) higher than the viral load in the TA samples. Subsequently, the difference between the RSV RNA loads in NPA and TA samples was set out against the number of days after admission (Fig. 5). The difference between NPA and TA samples increased during the course of RSV infection (r = 0.52, P < 0.001). When only the first sample from each patient was analyzed (n = 31), agreement was better, with the 95% limits of agreement being −1.5 and 1.4 log10 (Fig. 6). The viral loads in these first NPA samples were, on average, equal to those in the TA samples, indicating that in the initial phase of infection the load in NPA samples was not higher than the load in TA samples. Furthermore, we did not observe consequent differences in consistency between TA and NPA samples at any particular stage to account for the differences observed in Fig. 5. During the course of stay at the PICU, nearly all patients stayed virus positive, especially when NPA samples were assessed (9).
FIG. 4.
Viral loads in 138 nasopharyngeal aspirate samples and their corresponding tracheal aspirate samples simultaneously taken from 31 patients. The diagonal line represents 100% agreement. Squares at the outer limits of the graph represent sample pairs in which only one sample was positive. Both samples in 13 sample pairs were negative; these data are represented by the square at the intercept of the x and y axes, corresponding to 2.6 log10 particles/ml (0.5 times the detection limit).
FIG. 5.
Difference in viral loads between nasopharyngeal and tracheal aspirate specimens simultaneously taken during the course of RSV infection. The differences in viral loads between 133 pairs of simultaneously taken NPA and TA samples (TA − NPA) for the first 14 days after admission to the pediatric intensive care unit are shown. The dotted line represents a linear correlation (r = 0.52, P < 0.001).
FIG. 6.
Differences in viral loads between the first nasopharyngeal and tracheal aspirate samples taken at admission to the PICU for each patient (TA − NPA). The mean difference is not significantly different from zero. Dotted lines represent 95% limits of agreement (95% of the differences lie between −1.5 and 1.4 log10 particles/ml).
Molecular RNA detection compared to viral culture.
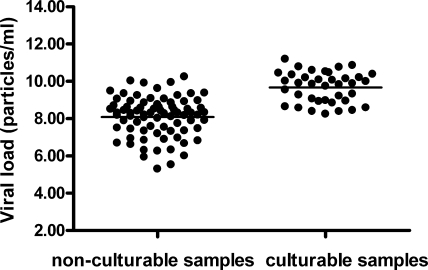
During the first winter of the study, we cultured all samples collected. Remarkably, we never succeeded in culturing RSV from samples collected more than 4 days after hospitalization. Therefore, in the second season, samples collected only from days 1 to 4 after hospitalization were cultured. Viral culture had a lower sensitivity than real-time PCR, detecting RSV in only 20 out of 32 (63%) RSV PCR-positive patients included. All samples positive by viral culture were also positive by real-time PCR. Samples with a positive viral culture result had higher viral loads than samples with a negative culture result (P = <0.001, Mann-Whitney U test; Fig. 7). The mean viral loads of culture-negative samples and culture-positive samples were 8.1 log10 particles/ml (95% CI, 7.8 to 8.3 log10 particles/ml) and 9.7 log10 particles/ml (95% CI, 9.4 to 10.0 log10 particles/ml), respectively. We did not observe associations between the culturability of individual samples with any of the recorded clinical parameters (data not shown).
FIG. 7.
Viral loads in 115 samples from 32 patients of samples with positive and negative viral culture results determined by real-time PCR. In addition, HEp-2 cells were inoculated with aliquots of those samples, and cells were observed daily for 10 days for cytopathological effects.
DISCUSSION
The present study aims to evaluate the use of real-time PCR for quantification of the RSV RNA load in respiratory secretions by assessing variations in the loads during the different steps of quantitative detection that may introduce variability in the results. First, we showed that intrasample variation is minimal (maximal variability, 0.5 log10 particles/ml). Second, we found that intraday variation in the RSV RNA load was low for samples with high viral loads (95% limits of agreement, −1.3 to 0.94 log10 particles/ml for samples with >6.0 log10 particles/ml). Third, we showed that nasopharyngeal aspirate loads were comparable to tracheal aspirate loads during the initial phase of infection (95% limits of agreement, −1.5 to 1.4 log10 particles/ml for the first samples from each patient). Variability could not be explained by differences in consistency between samples. Furthermore, normalization of viral loads to the level of a housekeeping gene (glyceraldehyde-3-phosphate dehydrogenase [GAPDH]) did not reduce the observed variability (data not shown). Overall, this study indicates that differences in lower airway RSV RNA load of approximately 1.5 log10 particles/ml or more can reliably be detected when NPA samples are taken during the initial phase of RSV infection. If testing is done later in the disease course, NPA samples have higher viral loads and may be the more reliable sample type.
Two limitations of our study deserve further discussion. First, this was a clinical study performed at a PICU. Although samples were taken by well-trained nursing staff and immediately transported to the laboratory by a dedicated investigator, the possibility of some personal variation in sampling procedures cannot be fully excluded. On the other hand, because of this clinical study design, our results do accurately reflect the reliability of real-time PCR that can be expected when quantification is performed in daily clinical practice. Second, it is not certain that the RSV RNA load is representative of the concentration of infectious virus. This uncertainty is reflected by the fact that only 20 out of 32 RSV PCR-positive patients included had a positive viral culture. The low sensitivity of viral culture is a general problem recognized in previous studies (3, 5). It is unlikely that our PCR results reflect the presence of viral RNA remains or only noninfectious colonizing viral particles, since patients were repeatedly sampled during the course of infection and the RSV RNA load was found to be consistently high over several days and for up to 2 weeks (9). Viral RNA would have definitely been degraded due to the presence of highly active RNAses in the mucus, and both infectious and noninfectious viruses would have been secreted along with the mucus. Thus, the low sensitivity of culture underscores the need for adequate evaluation of real-time PCR as a means of quantitative detection.
Our data regarding the agreement between nasopharyngeal and tracheal aspirate viral loads in the initial phase of infection confirm the results of Wright and colleagues (15), who used plaque assays to assess viral load, and Perkins et al. (10), who used real-time PCR but smaller sets of samples. These authors reported an even better agreement between the results for NPA and TA samples, which is likely explained by the fact that they evaluated only samples from patients with positive viral cultures, most likely representing patients with higher viral loads. Our observation that NPA samples show a higher RSV load than TA samples in later phases of infection needs to be more deeply evaluated by future studies addressing the pathophysiological mechanisms by which this difference may be caused, e.g., improved viral clearance in the lower respiratory tract. Finally, in a parallel study, we could not find correlations between the initial viral load or length of viral shedding and disease severity (9).
Overall, we suggest that mucus samples can be tested reliably with real-time PCR to quantify the RSV RNA load and to identify differences in loads on the order of magnitude of 1.5 log10 particles/ml or more. This order of magnitude correlates to what is expected to be clinically relevant in respiratory infections, since inoculation of patients with RSV leads to exponential growth of viruses, with loads rising from about 10 to 1,000 TCID50s (≈2-log10 rise) in a matter of hours (2). Similarly, small differences (up to 1.5 log10 particles/ml) are probably irrelevant, and real-time PCR is not a useful tool to detect differences in this order of magnitude due to (i) intrasample variation (maximum, 0.5 log10 particles/ml), (ii) intraday variation (maximum, 1.3 log10 particles/ml), and (iii) NPA sample/TA sample variation (maximum, 1.5 log10 particles/ml). Furthermore, caution should be taken in the interpretation of results for samples with low viral loads, since RT-PCR of samples with low copy numbers is generally considered unreliable. In these samples, amplification becomes a matter of chance, randomly generating a low-positive or a completely negative result. As part of another study, we analyzed the course of the RSV load during infection and found that the RSV load was the highest upon admission (9). Since both intraday variation and NPA sample/TA sample variation are the smallest in samples with high viral loads taken shortly after admission, we recommend that patients be sampled as early in the course of infection as possible to obtain the most reliable measure of the RSV load. In the early stage of infection, NPA samples can be taken reliably to obtain a surrogate measure of the RSV load in the lower airways, which are generally not easily accessible for sampling.
In conclusion, quantitative real-time PCR detection of RSV RNA in undiluted mucus is a reliable method to quantify viral loads in patients with LRTIs. Nasopharyngeal aspirate samples in the initial phase of infection can be used accurately to predict RSV RNA loads in the lower airways.
Acknowledgments
B. P. Waalewijn and E. S. Schouten are kindly acknowledged for their help with the sample collection.
This study was supported by an Alexandre Suerman program M.D./Ph.D. grant to A. C. van de Pol from the University Medical Center Utrecht, Utrecht, Netherlands.
The authors have no conflict of interest to report.
Footnotes
Published ahead of print on 21 July 2010.
REFERENCES
- 1.Bland, J. M., and D. G. Altman. 1986. Statistical methods for assessing agreement between two methods of clinical measurement. Lancet i:307-310. [PubMed] [Google Scholar]
- 2.Falsey, A. R., M. A. Formica, J. J. Treanor, and E. E. Walsh. 2003. Comparison of quantitative reverse transcription-PCR to viral culture for assessment of respiratory syncytial virus shedding. J. Clin. Microbiol. 41:4160-4165. [DOI] [PMC free article] [PubMed] [Google Scholar]
- 3.Hall, C. B., R. G. Douglas, Jr., and J. M. Geiman. 1976. Respiratory syncytial virus infections in infants: quantitation and duration of shedding. J. Pediatr. 89:11-15. [DOI] [PubMed] [Google Scholar]
- 4.Hall, C. B., G. A. Weinberg, M. K. Iwane, A. K. Blumkin, K. M. Edwards, M. A. Staat, P. Auinger, M. R. Griffin, K. A. Poehling, D. Erdman, C. G. Grijalva, Y. Zhu, and P. Szilagyi. 2009. The burden of respiratory syncytial virus infection in young children. N. Engl. J. Med. 360:588-598. [DOI] [PMC free article] [PubMed] [Google Scholar]
- 5.Henrickson, K. J., and C. B. Hall. 2007. Diagnostic assays for respiratory syncytial virus disease. Pediatr. Infect. Dis. J. 26:S36-S40. [DOI] [PubMed] [Google Scholar]
- 6.Hierholzer, J. C., and R. A. Killington. 1996. Virus isolation and quantitation, p. 25-46. In B. W. Mahy and H. O. Kagro (ed.), Virology methods manual. Academic Press Limited, London, United Kingdom.
- 7.Klein Klouwenberg, P., L. Tan, W. Werkman, G. M. van Bleek, and F. E. Coenjaerts. 2009. The role of Toll-like receptors in regulating the immune response against respiratory syncytial virus. Crit. Rev. Immunol. 29:531-550. [DOI] [PubMed] [Google Scholar]
- 8.Kuypers, J., N. Wright, J. Ferrenberg, M. L. Huang, A. Cent, L. Corey, and R. Morrow. 2006. Comparison of real-time PCR assays with fluorescent-antibody assays for diagnosis of respiratory virus infections in children. J. Clin. Microbiol. 44:2382-2388. [DOI] [PMC free article] [PubMed] [Google Scholar]
- 9.Lukens, M. V., A. C. van de Pol, F. E. Coenjaerts, N. J. Jansen, V. M. Kamp, J. L. Kimpen, J. W. Rossen, L. H. Ulfman, C. E. Tacke, M. C. Viveen, L. Koenderman, T. F. Wolfs, and G. M. van Bleek. 2010. A systemic neutrophil response precedes robust CD8(+) T-cell activation during natural respiratory syncytial virus infection in infants. J. Virol. 84:2374-2383. [DOI] [PMC free article] [PubMed] [Google Scholar]
- 10.Perkins, S. M., D. L. Webb, S. A. Torrance, C. El Saleeby, L. M. Harrison, J. A. Aitken, A. Patel, and J. P. DeVincenzo. 2005. Comparison of a real-time reverse transcriptase PCR assay and a culture technique for quantitative assessment of viral load in children naturally infected with respiratory syncytial virus. J. Clin. Microbiol. 43:2356-2362. [DOI] [PMC free article] [PubMed] [Google Scholar]
- 11.van de Pol, A. C., A. M. van Loon, T. F. Wolfs, N. J. Jansen, M. Nijhuis, E. K. Breteler, R. Schuurman, and J. W. Rossen. 2007. Increased detection of respiratory syncytial virus, influenza viruses, parainfluenza viruses, and adenoviruses with real-time PCR in samples from patients with respiratory symptoms. J. Clin. Microbiol. 45:2260-2262. [DOI] [PMC free article] [PubMed] [Google Scholar]
- 12.van de Pol, A. C., T. F. Wolfs, N. J. Jansen, A. M. van Loon, and J. W. Rossen. 2006. Diagnostic value of real-time polymerase chain reaction to detect viruses in young children admitted to the paediatric intensive care unit with lower respiratory tract infection. Crit. Care 10:R61. [DOI] [PMC free article] [PubMed] [Google Scholar]
- 13.van Elden, L. J., A. P. Sachs, A. M. van Loon, M. Haarman, D. A. van de Vijver, T. G. Kimman, P. Zuithoff, P. J. Schipper, T. J. Verheij, and M. Nijhuis. 2008. Enhanced severity of virus associated lower respiratory tract disease in asthma patients may not be associated with delayed viral clearance and increased viral load in the upper respiratory tract. J. Clin. Virol. 41:116-121. [DOI] [PMC free article] [PubMed] [Google Scholar]
- 14.van Woensel, J. B., R. Lutter, M. H. Biezeveld, T. Dekker, M. Nijhuis, W. M. van Aalderen, and T. W. Kuijpers. 2003. Effect of dexamethasone on tracheal viral load and interleukin-8 tracheal concentration in children with respiratory syncytial virus infection. Pediatr. Infect. Dis. J. 22:721-726. [DOI] [PubMed] [Google Scholar]
- 15.Wright, P. F., W. C. Gruber, M. Peters, G. Reed, Y. Zhu, F. Robinson, S. Coleman-Dockery, and B. S. Graham. 2002. Illness severity, viral shedding, and antibody responses in infants hospitalized with bronchiolitis caused by respiratory syncytial virus. J. Infect. Dis. 185:1011-1018. [DOI] [PubMed] [Google Scholar]


