

Abstract
Background
The Star Excursion Balance Test (SEBT) is a dynamic test that requires strength, flexibility, and proprioception and has been used to assess physical performance, identify chronic ankle instability, and identify athletes at greater risk for lower extremity injury. In order to improve the repeatability in measuring components of the SEBT, the Y Balance Test™ has been developed.
Objective
The purpose of this paper is to report the development and reliability of the Y Balance Test™.
Methods
Single limb stance excursion distances were measured using the Y Balance Test™ on a sample of 15 male collegiate soccer players. Intraclass Correlation Coefficients (ICC) were used to determine the reliability of the test.
Results
The ICC for intrarater reliability ranged from 0.85 to 0.91 and for interrater reliability ranged from 0.99 to 1.00. Composite reach score reliability was 0.91 for intrarater and 0.99 for interrater reliability.
Discussion
This study demonstrated that the Y Balance Test™ has good to excellent intrarater and interrater reliability. The device and protocol attempted to address the common sources of error and method variation in the SEBT including whether touch down is allowed with the reach foot, where the stance foot is aligned, movement allowed of the stance foot, instantaneous measurement of furthest reach distance, standard reach height from the ground, standard testing order, and well defined pass/fail criteria.
Conclusion
The Y Balance Test™ is a reliable test for measuring single limb stance excursion distances while performing dynamic balance testing in collegiate soccer players.
Keywords: Y Balance Test, lower extremity, postural stability
BACKGROUND
Unilateral balance and dynamic neuromuscular control are required for sport. Dysfunctional unilateral stance has been prospectively identified as a risk for injury in sport.1–6 Recent discussion in the literature has occurred regarding the importance of assessing dynamic neuromuscular control for injury prediction using body relative movement testing.7 The Star Excursion Balance Test (SEBT) is a dynamic test that requires strength, flexibility, and proprioception. The goal of the SEBT is to maintain single leg stance on one leg while reaching as far as possible with the contralateral leg.8, 9 The SEBT has been used to measure physical performance, compare balance ability among different sports, and identify individuals who have chronic ankle instability.10–13 Recently, the test has been used to identify athletes at greater risk for lower extremity injury.1 Researchers have suggested using the SEBT as a screening tool for sport participation and as a post-rehabilitation test to ensure dynamic functional symmetry.11 Further, researchers have shown that SEBT performance improves after training.10,14
The test originally incorporated reaching in eight directions while standing on each foot,9 but factor analysis indicated that one reach direction (posteromedial) was able to accurately identify individuals with chronic ankle instability as well as performing all eight directions.15 Further, Plisky et al1 reported that the sum of three reach directions (anterior, posteromedial, and posterolateral), as well as asymmetry between legs in anterior reach distance, were predictive of lower extremity injury in high school basketball players. Hubbard et al12 reported that the anterior and posteromedial reach directions identified persons with chronic ankle instability. In a second study, these same authors found that hip abduction strength was correlated with the posteromedial reach distance, and hip extension strength correlated with posterolateral reach distance on the SEBT.16
For clinical use and screening purposes, the test needs to capture the greatest amount of information in the shortest amount of time. Thus, the anterior, posteromedial, and posterolateral directions appear to be important to identify individuals with chronic ankle instability and those at greater risk of lower extremity injury.
The intrarater reliability of the SEBT has been reported as moderate to good (ICC 0.67- 0.97),8,11,17 and interrater reliability has been reported as poor to good (0.35-0.93).17
Because this balance test is dynamic, difficulty can occur in attempting to accurately assess the farthest reach point and what criteria constitutes a successful reach (e.g. how much movement of the stance foot is allowed or if the reach foot is allowed to touch down). Thus, there have been many protocols utilized for the test (Table 1) with the primary variations in protocol being whether the reach foot touches the floor. Touching down with the reach foot introduces error by making it difficult to quantify the amount of support gained from that touchdown. If touchdown is not allowed, standardizing the distance from the ground that the person reaches is difficult, as well as instantaneously marking the farthest reach point. In addition, it is difficult for examiners to determine how much movement of the stance foot is allowed. Precise determination of the heel or forefoot lift off from the surface is difficult due to the contours of the foot and the rapid position changes due to co-contraction of the lower limb muscles during unilateral stance.
Table 1.
Comparison of Methods Used in Previous Studies
| Study | Sample Size | Reach Foot Touch Down | Stance Foot Alignment | Stance Foot Movement Allowed | Average or Greatest reach | Testing Directions* | Limb Length Measured | Attempts allowed / trials | Shoes on /off |
|---|---|---|---|---|---|---|---|---|---|
| Gray9 | NA† | No, with-in 3 inch of test vector | Varied to direction of reach | No | Greatest (unit of measure unspecified) | AL A AM M PM P PL L |
No | Not specified | Pictured with shoes on |
| Kinzey and Armstrong24 | 20 | No | Center box | No | Average of 3 greatest (cm) | AM, PM | No | 5 | Not controlled |
| Hertel et al17 | 16 | Yes | Center of grid | No | Avg of 1-3;4-6;7-9;10-12 trial (cm) | AL A AM M PM P PL L |
No | 1 practice followed by 3 trials | Pictured with shoes on |
| Earl and Hertel35 | 10 | Yes | Varied to direction of reach | Not specified | With-in 1 mm of precision | A AM M Pm P PL L AL |
No | 6 practice / 5 trials/ last 3 marked | Pictured with shoes on |
| Olmsted et al25 | 40 | Yes | Center of grid | No | Avg of 3 greatest (cm) | A AM M Pm P PL L AL |
No | 6 practices /then till 3 good reaches met | Pictured with shoes off |
| Gribble and Hertel26 | 30 | Yes | Center of grid | No | Mean of 3 trials (cm) | A AM M Pm P PL L AL |
Yes/ASIS to mid ipsilateral medial malleolus | 6 practice / 3 trials | Pictured with shoes off |
| Gribble et al30 | 30 | Yes | Center of grid | No | Mean of 3 trials (cm) | A, M, P | Yes/ASIS to mid medial malleolus bilateral | 6 practice / 3 trials | Pictured with shoes off |
| Cote et al31 | 48 | Yes | Center of grid | No | Mean of 3 trials (cm) | A AM M Pm P PL L AL |
No/ normalized to height | 1 practice/3 trials | Not specified |
| Lanning et al11 | 105 | No | Center of Box | No | Greatest (cm) | AM, PM | Yes / ASIS to mid medial malleolus bilateral | 6 practice / 3 trials | With the shoes on |
| Plisky et al22 | 235 | No | Center of grid withmost distal aspect of great toe at start line | No | Greatest of 3 trials (cm), & sum of each direction greatest (composite) | A, PM, PL | Inferior aspect of ASIS to distal lateral malleolus, after clearing of the hips | 6 practice / 3 trials | Great toe at line, pictured with shoes off |
| Hertel et al20 | 87 | Yes | Geometric center of the foot on cross-hairs in center of grid | No | Mean of 3 trials (cm) | A AM M Pm P PL L AL |
Yes/ ASIS to distal tip medial malleolus | 6 practice / 3 trials | Geometric center of foot/ pictured with shoes off |
| Gribble et al18 | 30 | Yes | Foot bisected equally in all planes | No; Hands on iliac crests | Avg of 3 reaches (unit not specified) | A | Yes/ ASIS to distal medial malleolus | 6 practice / 3 trials | Pictured shoes off |
| Sawkins et al33 | 30 | Yes | Varied to direction of reach | No | Greatest | A, P, PM | Not specified | 6 practice (prior to taping)/ 3 trials | Shoes off |
| Bressel et al21 | 34 | Yes | Middle of grid with center of foot on small dot | Cited “as Gribble” 26 | Avg of 3 trials(cm & mm used) | A AM M Pm P PL L AL |
Yes/ ASIS to medial malleolus (nearest mm) Both lower extremities | 180seconds of practice prior to testing, 3 trials | Not specified |
| Hubbard et al12 | 60 | Yes | Not specified | Not specified | Avg of 3 (cm) | A, PM, PL | Yes/ “Gribble”26 | 6 practice / 3 trials | Not specified |
| Hubbard et al16 | 30 | Yes | Not specified | Not specified | Avg of 3 (cm) | A, PM, PL | Yes/ “Gribble” 26 | 6 practice / 3 trials | Not specified |
| Gribble et al18 | 30 | Yes | Middle of grid | No; Hands on hips | Mean of 3 trials (unit not specified) | A, M, P | Yes/ ASIS to distal med malleolus | 6 practice / 3 trials | Not specified (kinematic markers placed) |
| English and Howe32 | 3 | Methods cited as Kinzey et al24, with touchdown | Center of box | Not specified | Mean of 3 trials (cm) | Reported as: Right anterior and posterior; Left anterior and posterior; (AM, PM) | Not specified | 6 practice / 3 trials | Pictured with shoes on |
| Hale et al10 | 67 | Yes | Not specified | Not specified; hands on hips | Mean of 3 trials (unit not specified) | A AM M Pm P PL L AL |
Not specified | 6 practice / 3 trials | Not specified |
A= Anterior, AM= Anterior Medial, M= Medial, PM= Posterior Medial, P= Posterior, PL= Posterior Lateral, L= Lateral, AL= Anterior Lateral, ASIS= Anterior Superior Iliac Spine,
NA = Not Applicable
Another disparity in SEBT protocols is where the stance foot is aligned to determine starting position. The starting point has been reported to be at the bisection of the lateral malleolus,18–21 most distal aspect of the toes,22 center of the foot,11,18,23–32 and varied according to reach direction.9,33
The Y Balance Test™ (FunctionalMovement.com, Danville, VA) is an instrumented version of components of the SEBT developed to improve the repeatability of measurement and standardize performance of the test. The device utilizes the anterior, posteromedial, and posterolateral components of the SEBT. Therefore, a testing protocol was developed to address potential sources of error and to describe standard testing procedure so that results can be compared among studies as well as among clinicians. This device and protocol attempt to address the common sources of error and method variation including whether touchdown is allowed with the reach foot, where the stance foot is aligned, movement allowed of the stance foot, instantaneous measurement of furthest reach distance, standard reach height from the ground, standard testing order, and well defined pass/fail criteria.
METHODS
Subjects
Fifteen male collegiate soccer players (mean 19.7 ± 0.81 years) participated in the study. Subjects were excluded from participation in the study for lower extremity amputation; vestibular disorder; lack of medical clearance for participation; injury; current or undergoing treatment for inner ear, sinus, upper respiratory infection, or head cold; or cerebral concussion within the previous three months. Prior to participation all subjects read and signed an informed consent form approved by the University of Evansville's Institutional Review Board.
Testing Device
The Y Balance Test Kit™ consists of a stance platform to which three pieces of PVC pipe are attached in the anterior, posteromedial, and posterolateral reach directions (Figure 1). The posterior pipes are positioned 135 degrees from the anterior pipe with 45 degrees between the posterior pipes. Each pipe is marked in 5 millimeter increments for measurement. The subject pushes a target (reach indicator) along the pipe which standardizes the reach height (i.e. how far off the ground the reach foot is), and the target remains over the tape measure after performance of the test, making the determination of reach distance more precise.
Figure 1.

Y Balance Test Kit™
Y Balance Test™ Protocol
The subjects viewed an instructional video which demonstrated the test and testing procedure as explained by Plisky et al.1 Hertel et al17 found a significant learning effect with the SEBT where the longest reach distances occurred after six trials followed by a plateau. Therefore, the subjects practiced six trials on each leg in each of the three reach directions prior to formal testing. The subjects were tested within 20 minutes of practicing. All subjects wore athletic shoes during the performance of the test. The subject stood on one leg on the center foot plate with the most distal aspect of the athletic shoe at the starting line. While maintaining single leg stance, the subject was asked to reach with the free limb in the anterior (Figure 2), posteromedial (Figure 3), and posterolateral (Figure 4) directions in relation to the stance foot. In order to improve the reproducibility of the test and establish a consistent testing protocol, a standard testing order was developed and utilized. The testing order was three trials standing on the right foot reaching in the anterior direction (right anterior reach) followed by three trials standing on the left foot reaching in the anterior direction. This procedure was repeated for the posteromedial and the posterolateral reach directions.
Figure 2.
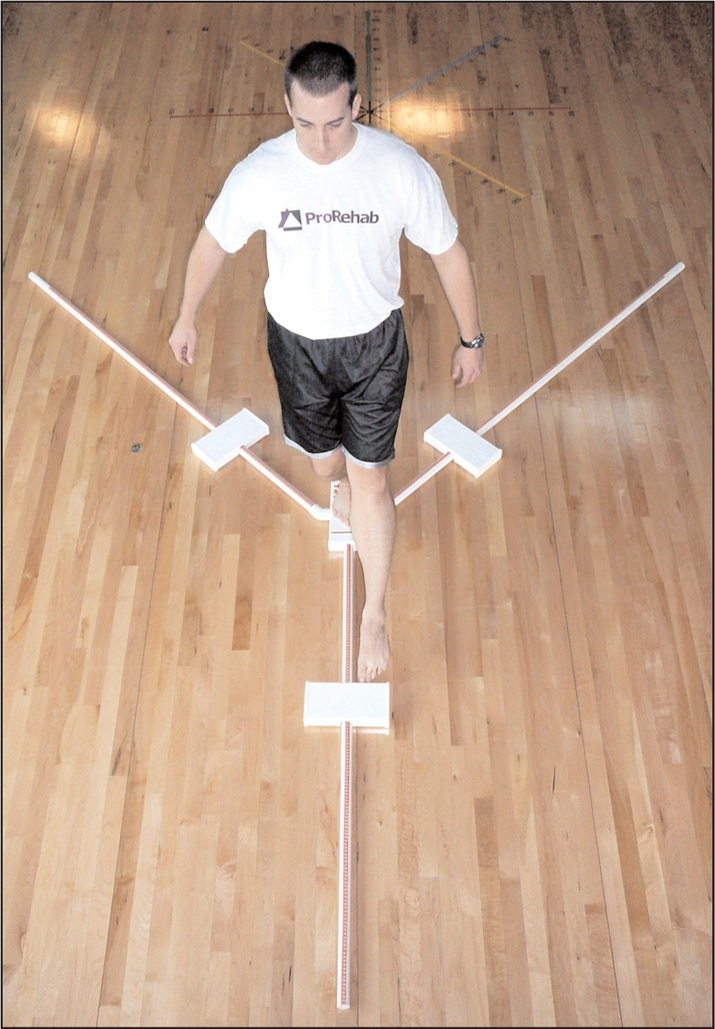
Anterior reach using the Y Balance Test Kit™
Figure 3.
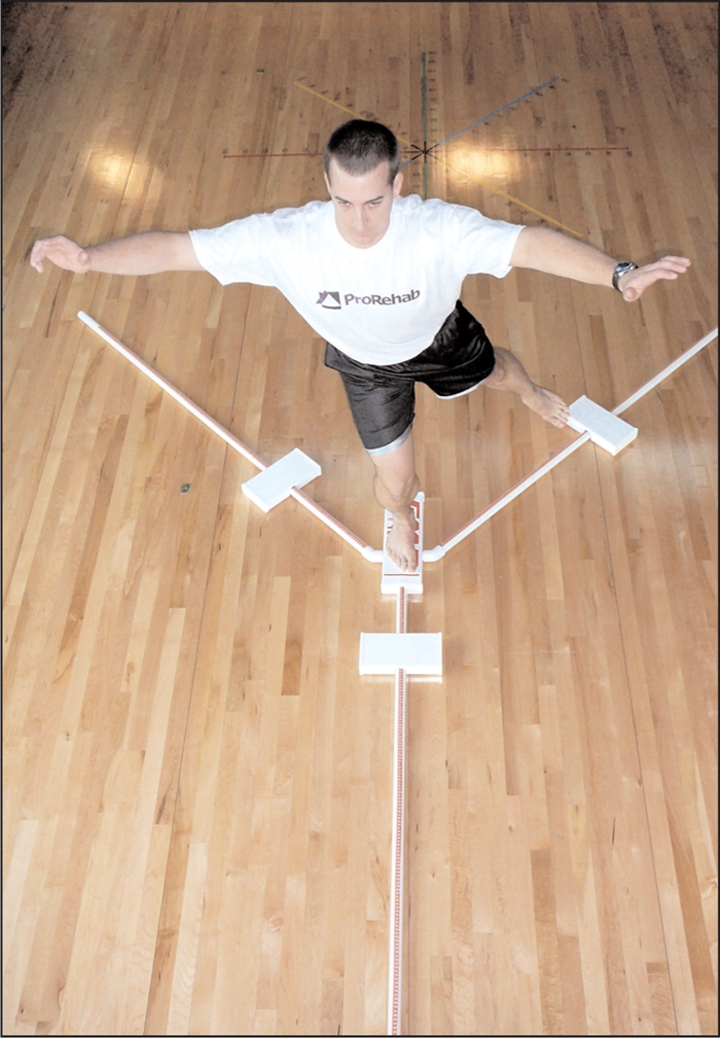
Posteromedial reach using the Y Balance Test Kit™
Figure 4.
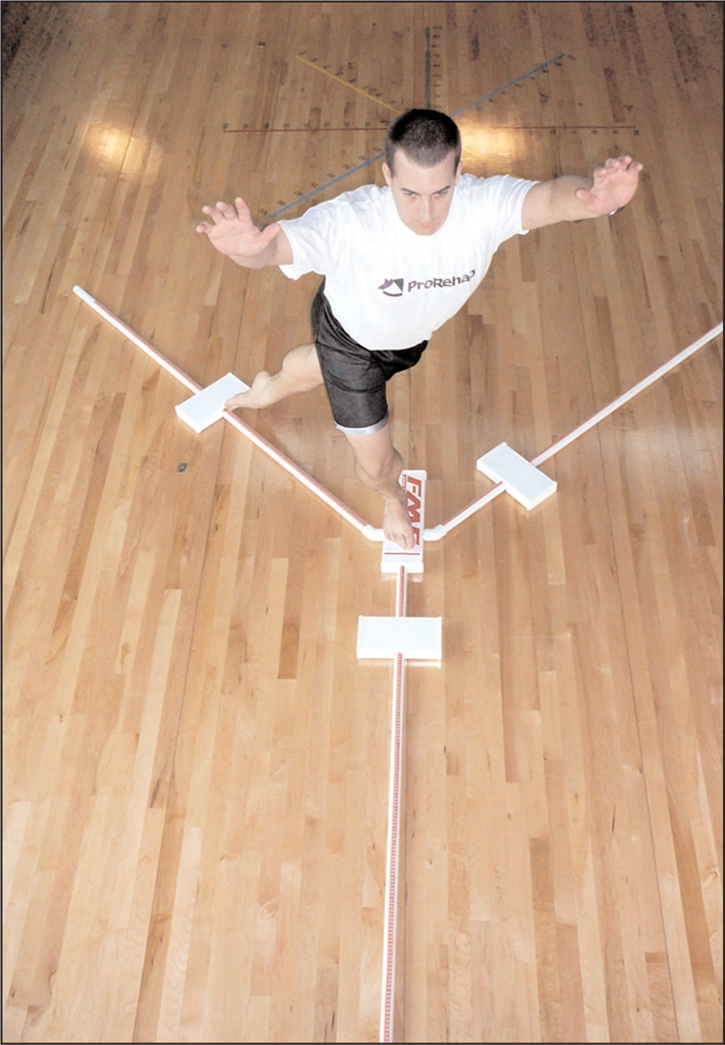
Posterolateral reach using the Y Balance Test Kit™
The subject was instructed by one rater (PPG) to stand on the platform with toes behind the line and to push the reach indicator in the red target area in the direction being test. These were the only instructions given to the subject during testing. All testing was observed and scored by two raters (inter-rater reliability) simultaneously that were blinded to each others scoring. Rater #1 was a physical therapist assistant and certified athletic trainer with with 10 years of experience, and Rater #2 (BE) was a physical therapist with 7 years of experience. The raters independently determined if a successful trial was completed (i.e. that the foot was positioned correctly behind the line and that all of the criteria were met for a successful trial). To reduce bias, the rater recorded the reach distance regardless whether he thought the trial was successful. After three trials in one reach direction, the raters were asked if they had a least one successful trial. If they did not, the subject was asked to perform an additional trial until a successful reach was completed. If the subject was unable to perform the test according to the above criteria in six attempts, the subject failed that direction.
The maximal reach distance was measured by reading the tape measure at the edge of the reach indicator, at the point where the most distal part of the foot reached. The trial was discarded and repeated if the subject: 1) failed to maintain unilateral stance on the platform (e.g. touched down to the floor with the reach foot or fell off the stance platform), 2) failed to maintain reach foot contact with the reach indicator on the target area while it was in motion (e.g. kicked the reach indicator), 3) used the reach indicator for stance support (e.g. placed foot on top of reach indicator), or 4) failed to return the reach foot to the starting position under control. The starting position for the reach foot is defined by the area immediately between the standing platform and the pipe opposite the stance foot. The process was repeated while standing on the other leg.
The specific testing order was right anterior, left anterior, right posteromedial, left posteromedial, right posterolateral, and left posterolateral. The greatest successful reach for each direction for each rater was used for analysis of the reach distance in each direction. Also, the greatest reach distance from each direction was summed to yield a composite reach distance for analysis of overall performance on the test. The testing procedure was repeated approximately 20 minutes later using a single rater (PPG) and measuring the same subjects right stance limb (to measure intra-rater reliability).
Lower Limb Length
On a mat table with the subject supine, the subject lifted the hips off the table and returned them to starting position. Then, the examiner passively straightened the legs to equalize the pelvis. The subject's right limb length was then measured in centimeters from the anterior superior iliac spine to the most distal portion of the medial malleolus with a cloth tape measure.
Data Analysis
The data were analyzed for each subject for the right limb in the anterior, posterolateral, and posteromedial reach directions. Means and standard deviations were calculated for the reach distance in each direction and limb length. Paired sample t-test was used to determine if there was a difference between the performance of the right and left limb. Since reach distance is related to limb length, reach distance was normalized to limb length to allow future comparison among studies. To express reach distance as a percentage of limb length, the normalized value was calculated as reach distance divided by limb length then multiplied by 100.22 Composite reach distance was the sum of the three reach directions divided by three times limb length, and then multiplied by 100.22 An ICC (3,1) was used to evaluate intrarater reliability and ICC (2,1) was used to evaluate interrater reliability for each of the normalized reach distances.
RESULTS
Mean, standard deviation, median, and range of the average performance of the two limbs are reported in Table 2. Intrarater reliability for the one tester ranged from 0.85 to 0.91 with anterior reach 0.91, posteromedial of 0.85, and posterolateral 0.90, and composite 0.91 (Table 3). Inter-rater reliability between the two testers ranged from 0.99 to 1.0 with anterior 1.0, posteromedial 0.99, posterolateral 0.99, and composite reach 0.99 (Table 4).
Table 2.
Results of Y Balance Test
| Mean reach in cm* (Standard Deviation) | Median Reach in cm* (range) | Normalized Mean†Reach (Standard Deviation) | |
|---|---|---|---|
| Rater 1 | |||
| Anterior | 71.5 (6.9) | 70.8 (60.8 - 81.0) | 76.7 (4.4) |
| Posteromedial | 114.0 (7.1) | 111.0 (100.8 -125.8) | 122.5 (4.3) |
| Posterolateral | 110.2 (7.2) | 108.5 (101.3-120.8) | 118.5 (5.0) |
| Composite | 295.1 (19.8) | 284.0 (268.5 - 328.5) | 105.7 (3.4) |
| Rater 2 | |||
| Anterior | 71.7 (7.1) | 70.8 (60.8-81.5) | 76.9 (4.4) |
| Posteromedial | 114.0 (7.1) | 111.0 (100.8 -125.8) | 122.5 (4.3) |
| Posterolateral | 110.3 (7.2) | 108.8 (101.3-121.8) | 118.5 (4.9) |
| Composite | 296.7 (20.3) | 288.3 (267.5 - 332.8) | 106.2 (3.8) |
| Repeated Measurement | |||
| Anterior | 72.9 (5.8) | 72.0 (66.0-83.5) | 78.3 (3.9) |
| Posteromedial | 114.9 (7.3) | 114.0 (105.0 - 129.5) | 123.5 (5.0) |
| Posterolateral | 112.3 (6.5) | 112.0 (102.5 -126.5) | 120.8 (5.3) |
| Composite | 300.1 (17.7) | 289 (278.0 - 332.5) | 107.5 (3.5) |
= centimeters
= normalized to limb length expressed as a percentage
Table 3:
Intrarater reliability (one rater) for the right stance limb for the Y Balance Test™
| ICC* (3,1) | 95% CI† | SEM (cm)‡ | |
|---|---|---|---|
| Anterior | 0.88 | 0.69-0.96 | 2.01 |
| Posteromedial | 0.85 | 0.62-0.95 | 2.83 |
| Posterolateral | 0.86 | 0.64-0.95 | 3.11 |
| Composite | 0.89 | 0.69-0.96 | 5.84 |
Intraclass correlation coefficient
95% confidence interval
Table 4:
Interrater reliability for the Y Balance Test™
| ICC* (2,1) | 95% CI† | SEM (cm)‡ | ||
|---|---|---|---|---|
| Anterior | Left | 1.0 | 0.99-1.0 | 0.69 |
| Right | 0.99 | 0.97-0.99 | 0.71 | |
| Posteromedial | Left | 1.0 | 0.99-1.0 | 0.68 |
| Right | 1.0 | 0.99-1.0 | 0.78 | |
| Posterolateral | Left | 0.99 | 0.99-1.0 | 0.73 |
| Right | 1.0 | 0.99-1.0 | 0.85 | |
| Composite | Left | 0.97 | 0.92-0.99 | 3.31 |
| Right | 0.99 | 0.96-0.99 | 2.08 |
Intraclass correlation coefficient
95% confidence interval
DISCUSSION
The intrarater reliability of the SEBT has been reported as moderate to good (ICC 0.67-0.97),8,11,17 and interrater reliability has been reported as poor to good (0.35-0.93).17 The variability in the ranges of previously reported reliability of the SEBT suggests the need to improve the accuracy of the testing methods and importance of a standardized testing protocol. The interrater reliability improved over the traditional SEBT testing methods when using the Y Balance Test™. Because the interrater reliability exceeds the intrarater reliability, the variability in subject performance on the test likely exceeds the variability in the measurement recorded by different raters (i.e. the precision in the device is greater than the precision in subject performance). This occurrence can be attributed to a more standardized scoring criteria and a more precise measurement device that also standardizes performance. Further, a standard testing order (i.e. right anterior, left anterior, right posteromedial, left posteromedial, right posterolateral, left posterolateral) allows for consistent performance of the test and attempts to minimize fatigue by alternating stance limbs.
The Y Balance Test™ was developed to address some of the limitations of the traditional SEBT testing methods. A reach indicator, standard reach height from the ground, well defined pass/fail criteria, and the ability of the reach indicator to remain over the tape measure after performance improve the reproducibility of the reach measurement. These features also allow the rater to focus more attention on observing the subject, and, therefore, better assess the subject's movement quality (Table 5). If examiners focused on monitoring stance foot movement, it was nearly impossible to simultaneously mark reach distance. In addition, during the development of the testing protocol for the device, it was difficult for examiners to determine how much movement of the stance foot was allowed in a successful trial (i.e. it was difficult to determine if/when the heel or forefoot actually lifted from the surface). Thus, the athlete was allowed to lift the heel off the ground to improve repeatability and standardize the testing procedures so that results can be compared among studies as long as the toe remained aligned with the start stripe at the front of the stance platform.
Table 5.
Recommendations for standardized protocol with the provided rationale for the recommendation.
| Recommendation | Rationale |
|---|---|
| Shoes off | Individuals attend testing in a variety of footwear so it is difficult to standardize. |
| Six practice trials | Learning effect. |
| Video instruction | Increases efficiency of testing protocol and standardizes instruction. |
| Standard testing order | Minimize fatigue by alternating stance limbs. Improves consistency in administration of test. |
| Stance foot aligned at most distal aspect of toes | Keeps starting point in a uniform and reproducible position to which the reach foot can be referenced. |
| Stance foot movement is allowed | Difficult to reliably determine if heel/forefoot is lifted from the surface. |
| Body movement allowed under control | Difficult to standardize amount of movement allowed. |
| Normalized to limb length | Normalization standardizes measurement to each individual. |
| Standard reach height | Allows reach height to be uniform. |
Some limitations to this study should be noted. Error could have been introduced by fatigue,30 practice effect,17 and remeasurement on the same day of initial testing. Future studies should be conducted with shoes off as many athletes attend pre-participation physicals and rehabilitation sessions with a large variety of footwear, often not appropriate for sport. Future studies should utilize a similar, standardized testing protocol so that results may be compared across studies. In addition, only one limb (right) was measured twice by the first rater.
A need exists to collect normative data using the Y Balance Test™ on varied populations (e.g. collegiate, high school, basketball, hockey, elderly, firefighters, etc). With normative data and prospective studies, the Y Balance Test™ could be evaluated for prediction of injury in different populations and establish acceptable reach distances for each population.
CONCLUSION
The Y Balance Test™ has shown good to excellent reliability with the standardized equipment and methods. By establishing the reliability of the Y Balance Test™, sports medicine clinicians can better determine deficits and asymmetries in individuals, as well as assist in the return to play decision-making process.
Footnotes
Financial Disclosure: The primary author of this study is the inventor of the Y Balance Test Kit™ used in this study.
References
- 1.Plisky P, Rauh M, Kaminski T, Underwood F. Star Excursion Balance Test as a predictor of lower extremity injury in high school basketball players. J Orthop Sports Phys Ther. 2006;36:911–919 [DOI] [PubMed] [Google Scholar]
- 2.Trojian TH, McKeag DB. Single leg balance test to identify risk of ankle sprains. Br J Sports Med. 2006;40:610–613 [DOI] [PMC free article] [PubMed] [Google Scholar]
- 3.Tropp H, Ekstrand J, Gillquist J. Stabilometry in functional instability of the ankle and its value in predicting injury. Med Sci Sports Exerc. 1984;16:64–66 [PubMed] [Google Scholar]
- 4.McGuine T, Greene J, Best T, Leverson G. Balance as a predictor of ankle injuries in high school basketball players. Clin J Sport Med. 2000;10:239–244 [DOI] [PubMed] [Google Scholar]
- 5.Watson A. Ankle sprains in players of the field-games Gaelic football and hurling. J Sports Med Phys Fitness. 1999;39:66–70 [PubMed] [Google Scholar]
- 6.Wang HK, Chen CH, Shiang TY, et al. Risk-factor analysis of high school basketball-player ankle injuries: A prospective controlled cohort study evaluating postural sway, ankle strength, and flexibility. Arch Phys Med Rehabil. 2006;87:821–825 [DOI] [PubMed] [Google Scholar]
- 7.Kiesel K, Plisky P, Voight M. Can serious injury in professional football be predicted by a preseason functional movement screen? N Am J Sports Phys Ther. 2007;2:147–158 [PMC free article] [PubMed] [Google Scholar]
- 8.Kinzey S, Armstrong C. The reliability of the star-excursion test in assessing dynamic balance. J Orthop Sports Phys Ther. 1998;27:356–360 [DOI] [PubMed] [Google Scholar]
- 9.Gray G. Lower Extremity Functional Profile. Adrian, MI: Wynn Marketing, Inc; 1995 [Google Scholar]
- 10.Hale SA, Hertel J, Olmsted-Kramer LC. The effect of a 4-week comprehensive rehabilitation program on postural control and lower extremity function in individuals with chronic ankle instability. J Orthop Sports Phys Ther. 2007;37:303–311 [DOI] [PubMed] [Google Scholar]
- 11.Lanning CL, Uhl TL, Ingram CL, et al. Baseline values of trunk endurance and hip strength in collegiate athletes. J Athl Train. 2006;41:427–434 [PMC free article] [PubMed] [Google Scholar]
- 12.Hubbard TJ, Kramer LC, Denegar CR, Hertel J. Contributing factors to chronic ankle instability. Foot Ankle Int. 2007;28:343–354 [DOI] [PubMed] [Google Scholar]
- 13.Olmsted L, Carcia C, Hertel J, Shultz S. Efficacy of the Star Excursion Balance Tests in detecting reach deficits in subjects with chronic ankle instability. J Athl Train. 2002;37:501–506 [PMC free article] [PubMed] [Google Scholar]
- 14.Chaiwanichsiri D, Lorprayoon E, Noomanoch L. Star excursion balance training: Effects on ankle functional stability after ankle sprain. J Med Assoc Thai. 2005;88:S90–94 [PubMed] [Google Scholar]
- 15.Hertel J, Braham R, Hale S, Olmsted L. Simplifying the Star Excursion Balance Test: Analyses of subjects with and without ankle instability. J Orthop Sports Phys Ther. 2006; 36:131–137 [DOI] [PubMed] [Google Scholar]
- 16.Hubbard TJ, Kramer LC, Denegar CR, Hertel J. Correlations among multiple measures of functional and mechanical instability in subjects with chronic ankle instability. J Athl Train. 2007;42:361–366 [PMC free article] [PubMed] [Google Scholar]
- 17.Hertel J, Miller S, Denegar C. Intratester and intertester reliability during the Star Excursion Balance Tests. J Sport Rehabil. 2000;9:104–116 [Google Scholar]
- 18.Gribble PA, Hertel J, Denegar CR. Chronic ankle instability and fatigue create proximal joint alterations during performance of the Star Excursion Balance Test. Int J Sports Med. Mar 2007;28:236–242 [DOI] [PubMed] [Google Scholar]
- 19.Gribble PA, Tucker WS, White P. Time-of-day influences on static and dynamic postural control. J Athl Train. 2007;42:35–41 [PMC free article] [PubMed] [Google Scholar]
- 20.Hertel J, Braham RA, Hale SA, Olmsted-Kramer LC. Simplifying the star excursion balance test: Analyses of subjects with and without chronic ankle instability. J Orthop Sports Phys Ther. 2006;36:131–137 [DOI] [PubMed] [Google Scholar]
- 21.Bressel E, Yonker J, Kras J, Heath E. Comparison of static and dynamic balance in female collegiate soccer, basketball, and gymnastics athletes. J Athl Train. 2007;42:42–46 [PMC free article] [PubMed] [Google Scholar]
- 22.Plisky PJ, Rauh MJ, Kaminski TW, Underwood FB. Star Excursion Balance Test as a predictor of lower extremity injury in high school basketball players. J Orthop Sports Phys Ther. 2006;36:911–919 [DOI] [PubMed] [Google Scholar]
- 23.Hertel J. Functional instability following lateral ankle sprain. Sports Med. 2000;29:361–371 [DOI] [PubMed] [Google Scholar]
- 24.Kinzey SJ, Armstrong CW. The reliability of the star-excursion test in assessing dynamic balance. J Orthop Sports Phys Ther. 1998;27:356–360 [DOI] [PubMed] [Google Scholar]
- 25.Olmsted LC, Carcia CR, Hertel J, Shultz SJ. Efficacy of the Star Excursion Balance Tests in detecting reach deficits in subjects with chronic ankle instability. J Athl Train. 2002;37:501–506 [PMC free article] [PubMed] [Google Scholar]
- 26.Gribble PA, Hertel J. Considerations for normalizing measures of the Star Excursion Balance Test. Measurement in physical education and exercise science. 2003;7:89–100 [Google Scholar]
- 27.Gribble PA, Hertel J. Effect of lower-extremity muscle fatigue on postural control. Arch Phys Med Rehabil. 2004; 85:589–592 [DOI] [PubMed] [Google Scholar]
- 28.Gribble PA, Hertel J. Changes in postural control during a 48-hr. sleep deprivation period. Percept Mot Skills. 2004;99:1035–1045 [DOI] [PubMed] [Google Scholar]
- 29.Gribble PA, Hertel J. Effect of hip and ankle muscle fatigue on unipedal postural control. J Electromyogr Kinesiol. 2004;14:641–646 [DOI] [PubMed] [Google Scholar]
- 30.Gribble PA, Hertel J, Denegar CR, Buckley WE. The effects of fatigue and chronic ankle instability on dynamic postural control. J Athl Train. 2004;39:321–329 [PMC free article] [PubMed] [Google Scholar]
- 31.Cote KP, Brunet ME, Gansneder BM, Shultz SJ. Effects of pronated and supinated foot postures on static and dynamic postural stability. J Athl Train. 2005;40:41–46 [PMC free article] [PubMed] [Google Scholar]
- 32.English T, Howe K. The effects of pilates exercise on trunk and postural stability and throwing velocity on college baseball pitchers: Single subject design. N Am J Sports Phys Ther. 2007;2:8–21 [PMC free article] [PubMed] [Google Scholar]
- 33.Sawkins K, Refshauge K, Kilbreath S, Raymond J. The placebo effect of ankle taping in ankle instability. Med Sci Sports Exerc. 2007;39:781–787 [DOI] [PubMed] [Google Scholar]
- 34.Earl J, Hertel J. Lower-extremity muscle activation during the Star Excursion Balance Tests. J Sport Rehabil. 2001;10:93–104 [Google Scholar]