Abstract
Background
Sport specific ergometers are important for laboratory testing (i.e. peak oxygen consumption (VO2)) and out of season training.
Objectives
The purpose of this study was to compare cardiorespiratory variables during exercise on a double poling ergometer to a field test in elite sit skiers.
Methods
Three male and four female athletes from the Canadian National / Developmental team (17-54 years of age, six with complete paraplegia and one with cerebral palsy) completed a field test and a double poling ergometer protocol separated by at least 24 hours. Both protocols consisted of three maximal trials of skiing of three minutes duration separated by 1.5 minutes of rest. A wireless metabolic system and heart rate monitor were used to measure cardiorespiratory responses [peak heart rate, peak VO2, and peak respiratory exchange ratio (RER)] during each test. Arterialized blood lactate was measured before the beginning of exercise, after each trial and at 5, 10 and 15 minutes post exercise.
Results
No significant differences existed between the field and ergometer tests for peak oxygen consumption (VO2) (field=34.7±5.5 mL·kg−1·min−1 vs. ergometer=33.4±6.9 mL·kg−1·min−1). Significantly higher peak heart rate and RER were found during the ergometer test. Significantly higher lactates were found during the ergometer test after trial 2 and trial 3.
Conclusion
The double poling ergometer is similar to a field test for evaluating peak VO2 in elite cross country sit skiers; however, the ergometer test elicits a higher heart rate and anaerobic response.
Keywords: spinal cord injury, aerobic power, lactate
INTRODUCTION
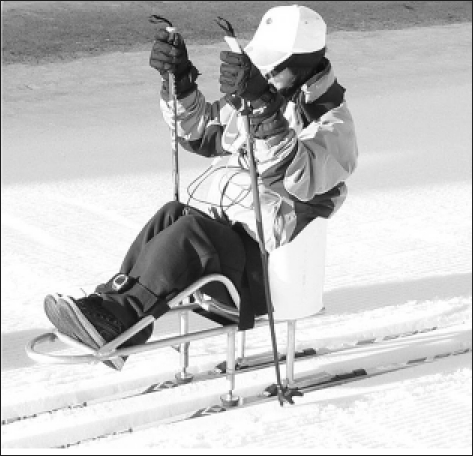
Sit-skiing is an event at the Paralympics which involves the athlete sitting in a sled on skis and propelling with poles over race distances ranging from 2.5 to 15 km (Figure 1). Physiological responses to sit skiing have never been evaluated.
Figure 1.
A sit skier during the field test.
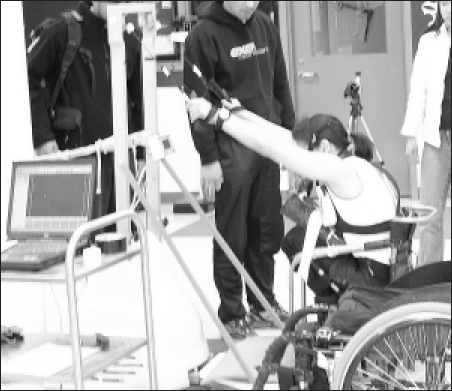
Regular cross country skiing is characterized by repeated dynamic contractions over an extended period of time and requires a high level of sustained power output by both the upper and lower body.1–4 One physiological trait that has been associated with cross country skiing success is maximal oxygen consumption (VO2 max).5–8,10,11 The VO2 max is often measured in a laboratory setting on an ergometer, due to the technical problems related to testing in the field.12 The most common ergometers used to evaluate all types of athletes include treadmills, cycle ergometers, and arm crank ergometers.4,13 Testing for sports other than running or cycling lack specificity when using these ergometers;4,14 therefore, a variety of sport specific ergometers is required. Recently, a double poling cross country ski ergometer has been modified to accommodate cross country skiers with disabilities (sit skiers) and is often used during training during seasons without snow. The purpose of this study was to compare the cardiorespriatory and metabolic responses in elite sit skiers during simulated skiing on this ergometer in a laboratory setting with the same responses during an outdoor field test. The hypothesis was that no significant differences would exist between the laboratory and field tests for the cardiorespiratory and metabolic repsonses evaluated in this study.
METHODS
Subjects
Seven (three male and four female) subjects, aged 17 to 54 years, volunteered for this study. The subjects were recruited from the developmental and national Canadian Nordic ski teams. Subjects must have competed for a minimum of two years at an elite level which included national and international competitions. Four of the athletes were previously Paralympians, and one athlete was a multiple Paralympic medalist. Subject characteristics are shown in Table 1. The study was approved by the University of Saskatchewan Biomedical Research Ethics Board for research in human subjects. Written, informed consent was obtained prior to the start of the study.
Table 1.
Subject characteristics.
| Subject | Injury | Age (Years) | Height (cm) | Weight (kg) | %Body Fat |
|---|---|---|---|---|---|
| Ml | Tl0-complete | 33 | 171 | 61.0 | 12 |
| F2 | T7-complete | 45 | 173 | 51.0 | 14.4 |
| F3 | T7-complete | 17 | 137 | 68.0 | Data Missing* |
| M4 | L1-complete | 42 | 179 | 87.3 | 19.6 |
| F5 | CP | 23 | 146 | 44.0 | 27 |
| F6 | L1-complete | 45 | 165 | 63.2 | 37.5 |
| M7 | T11-complete | 54 | 181 | 77.2 | 19 |
| Mean | 37 | 165 | 64.5 | 21.6 | |
| St. Dev. | 13 | 17 | 14.8 | 9.3 | |
St. Dev.= Standard deviation
M=Males
F=Females
T=Thoracic
L=Lumbar
CP=Cerebral Palsy
Subject was unable to attend body composition analysis.
Experimental Design
Throughout the study, all subjects were encouraged to undertake their normal training and diet. They were instructed to continue to be adequately hydrated, not eat two hours prior to the test, avoid strenuous exercise, and limit caffeine intake within six hours of testing. Prior to testing, body weight, height, and body composition were measured. Body weight was measured on a Toledo scale, accurate to the nearest 0.1 kilogram. Standing height was estimated based on arm span, age, and gender (Height = 0.75 (arm span) - 0.05 (age) + 4.04 (gender) + 40.91).15 Body composition was estimated with bioelectrical impedance. Briefly, the electrical impedance measurements (RJL instruments, Quantum II, Lincoln, MI) were undertaken with the subject lying in a supine position on a plinth. Any metal objects (bracelets, watches) that were known to affect these measurements were removed from the patient.
Four sets of electrical impedance measurements were taken between the following combinations of limbs on each subject as previously described by Desport et al:16 right upper and right lower limbs, right upper and left lower limbs, left upper and right lower limbs, and left upper and left lower limbs. For each hand-foot combination, the two receiving electrodes were placed at the level of the malleoli and proximal to the phalanges. The resistance and reactance for the four combinations were averaged and entered along with the patient's age, height, and weight into the Cypress software available with the instrument for the calculation of percent body fat. Bioelectrical impedance is reliable (r=0.96) and valid, with good correlation to hydrostatic weighing (r=0.95).13
Each subject then completed a field test (Figure 1) and a double poling ergometer protocol (Figure 2) in random order on separate days (separated by at least 24 hours). Each subject used their customized sit ski for both these test protocols. Both protocols consisted of three maximal trials lasting three minutes each, separated by 1.5 minutes of rest. A three-by-three minute repeat was deemed acceptable to achieve VO2 peak based on previous research on able-bodied subjects.17,18
Figure 2.
Modified double poling cross country ski ergometer.
Following each exercise protocol, each subject passively recovered for 15 minutes. Temperature and wind conditions were monitored during the field test, and laboratory temperature was constant at 21 degrees Celsius. Wind conditions were minimal during the field tests (<1m/sec) and temperature varied between −4°C to −15°C. The field-testing track was designed by the national team coaches to simulate an actual race. Blood lactate was monitored before beginning testing, after each trial, and after exercise at 5, 10, and 15 minutes. Heart rate was monitored during and after exercise with a Polar heart rate monitor (Polar, Levittown, United States). A wireless metabolic system (Sensormedic VmaxST, Conshohocken, United States, or Cosmed K4B2, Rome, Italy) was used to monitor gas exchange variables (oxygen uptake, respiratory exchange ratio, breathing frequency, and minute ventilation) during exercise. Although two different metabolic systems were used, all but one subject used the same metabolic system for both the field and ergometer protocols. The instrument was calibrated using 16% oxygen and 4% carbon dioxide prior to and after each test to ensure accuracy of the data. The volume transducer was calibrated using a 3 L syringe. The breath-by-breath measurements were recorded on to the wireless metabolic system during the test, downloaded to a computer after the test, and subsequently averaged over 20-second intervals for analysis.
The VO2 peak was determined by the highest 20-second average from the three trials. Peak oxygen pulse was calculated as VO2 peak (mL/min) divided by peak heart rate and was considered to be an indirect estimate of stroke volume.19
Statistical Analyses
Data are expressed as means ± standard deviations. Intraclass correlation coefficients were calculated between variables on the field and ergometer tests. A repeated-measures analysis of variance (ANOVA) was used to determine if differences existed between means for the double poling ergometer and field test protocols for VO2 peak, peak heart rate, peak oxygen pulse, peak respiratory exchange ratio, peak minute ventilation, and peak respiratory rate. A 2 (field vs. ergometer) × 7 (baseline, after each repeat, and 5, 10, and 15 minutes post-exercise) repeated-measures ANOVA was used to assess differences between conditions for blood lactate concentrations. A Tukey's post-hoc test was used to determine differences between pairs of means on this last ANOVA. Statistical significance was set at p≤0.05. Statistical analyses were carried out using Statistica, version 5.0 (StatsSoft Inc., Chicago).
RESULTS
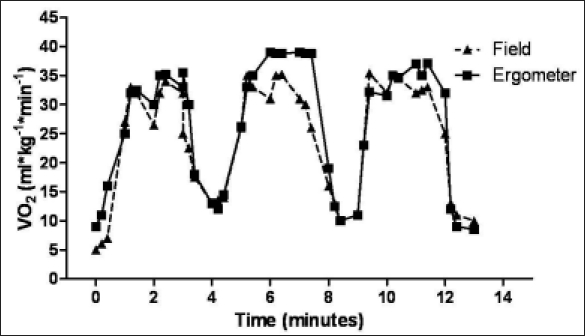
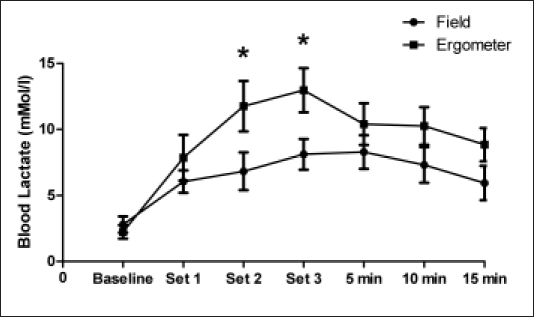
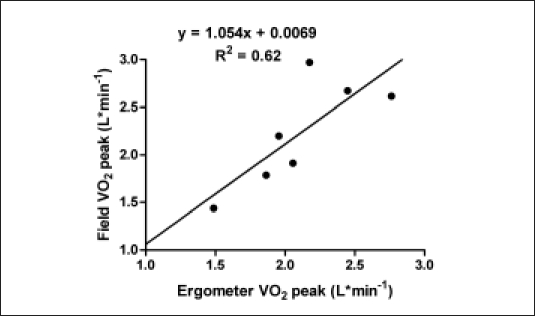
Typical VO2 responses during the two tests are shown for a single subject in Figure 3. During the three maximal intervals, the subjects consistently achieved a high VO2 response. No significant differences existed in the peak responses of the relative or absolute VO2 (Figures 4 and 5), oxygen pulse, respiratory rate, and minute ventilation between the double poling ergometer and the field test. However, the peak respiratory exchange ratio (field=1.19±0.14 vs. ergometer=1.35±0.11; P=0.02) and peak heart rate (field = 173±5 bpm vs. ergometer = 178±4 bpm, P=0.05) were significantly higher during the double poling ergometer protocol when compared to the field test (Table 2). A significant protocol by time interaction occurred for blood lactate levels. The post-hoc analysis indicated significantly higher lactate levels for the ergometer protocol after trial 2 and trial 3, as shown in Figure 6. The intraclass correlation coefficients between protocols were 0.84 (p=0.023) for relative peak VO2, 0.86 (P=0.015) for absolute peak VO2 (Figure 7), 0.95 (P=0.005) for minute ventilation, 0.87 (P=0.012) for oxygen pulse, and 0.85 (P=0.019) for peak blood lactate. The intraclass correlation coefficients for peak heart rate (0.52; P=0.197) and respiratory rate (0.70; P=0.082) were not significant.
Figure 3.
Oxygen consumption (VO2) measured in a representative individual during the field and double poling ergometer protocol (3 × 3 min).
Figure 4.
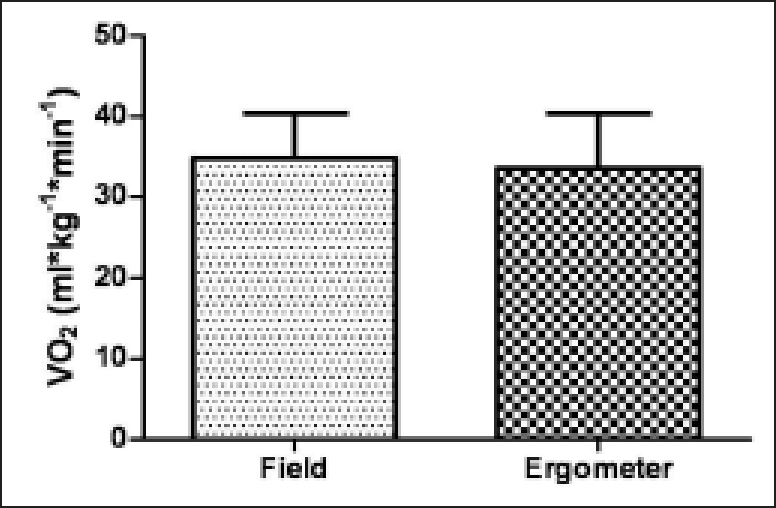
Mean values for relative VO2 ± standard deviations.
Figure 5.
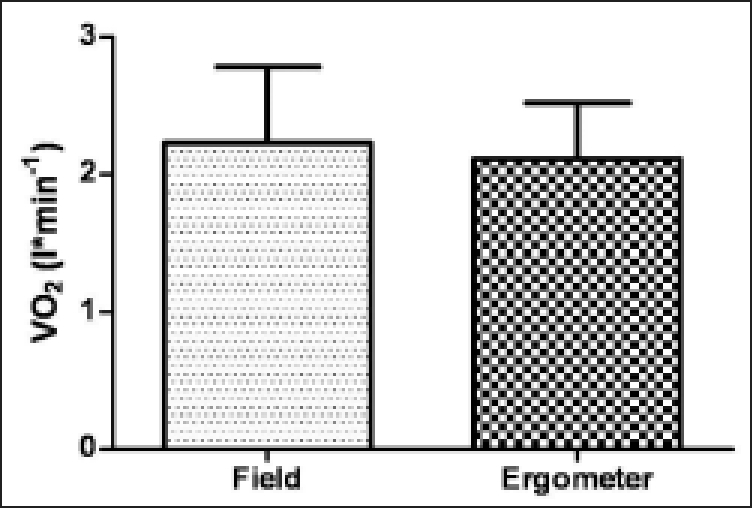
Mean values for absolute VO2 ± standard deviations.
Table 2.
Peak respiratory and physiological characteristics.
| Field | Ergometer | P-value | |
|---|---|---|---|
| Peak VE (L/min) | 103±33 | 94±24 | 0.103 |
| Oxygen Pulse (V02/HR) | 12.8±3.1 | 11.8±2.2 | 0.182 |
| Respiratory Rate (breathes/min) | 65.9±9.5 | 62.3±12.5 | 0.213 |
| Peak HR (bpm) | 173±5 | 178±4 | 0.046* |
| Peak RER (VC02/V02) | 1.19±0.14 | 1.35±0.11 | 0.022* |
Denotes a significant (P<0.05) difference between protocols (Mean ± SD).
Figure 6.
Mean blood lactate values during various time points ± standard error. Ergometer test was significantly (P<0.05) greater after trial 2 and trial 3 compared to field test.
Figure 7.
Correlation for absolute peak VO2 measured on the ergometer vs. field test.
DISCUSSION
This study is the first to evaluate the cardiorespiratory responses of skiers with disabilities during sit-skiing, an event at the Winter Paralympics. The major finding of this study was the similar VO2 peak values on the modified double poling ergometer compared to the field test. Wisloff and Helgerud4 performed research on able-bodied skiers and they also had similar VO2 peak values on a field test compared to values on the double poling ergometer. In the current study peak heart rate was significantly higher during the ergometer protocol when compared to heart rate during the field test. Wisloff and Helgerud4 found similar heart rate results in able-bodied skiers.
A potential mediating factor that may have affected the subjects' peak heart rate during the double poling ergometer protocol is the continuous resistance as compared to the varying speeds and tempos that occurred during the field test. The field testing course was designed to simulate an actual race with varying inclinations and turns, while the ergometer protocol maintained a constant resistance to the athlete. Therefore, the athletes may not have been able to reach their peak heart rate during the field tests due to short recovery periods (down hills and turns) throughout the testing course. There are two possible explanations for the similar VO2 responses and a lower heart rate response during the field test. There may be a difference in oxygen extraction at the muscle (arterial-venous oxygen difference; (a-v)O2 difference) or stroke volume responses between protocols. Oxygen pulse, which denotes the oxygen utilization per heart beat20 is strongly correlated with stroke volume (r=0.84) but not with (a-v)O2 difference (r=0.15).19 The authors of the current study found no significant difference in peak oxygen pulse between protocols; therefore, it is likely that stroke volume was not significantly different between the two protocols. Therefore, a similar peak VO2 accompanied by a lower peak heart rate during the field test compared to the ergometer test was most likely due to higher (a-v)O2 difference during the field test. As mentioned above, the field test involves intermittent effort during the skiing course as one skis and then recovers during down hills and turns, whereas the ergometer test involves more continuous muscle contraction against the resistance of the ergometer. This may allow for greater blood flow to the muscles during the field test (as muscle recovers between contractions during down hills or turns), permitting a greater extraction of oxygen at the muscle from the blood, which would be reflected as a greater (a-v)O2 difference. Future research is needed with direct measures of arterial and venous blood across the exercising muscle to test this hypothesis.
The results indicated significantly higher lactate and RER values during the double poling ergometer protocol as compared to the field test, which suggest an increased anaerobic cost during the ergometer protocol. Although diet composition was not controlled before tests, this most likely had minimal influence on RER or lactate because all subjects belonged to the same training center where nutrition and hydration of athletes were carefully managed. Athletes at camp were supplied with and ate a similar breakfast each morning before testing. As mentioned earlier, the field test allowed small recovery periods which may have affected lactate results, by allowing increased lactate clearance through increased blood flow which could account for the lower lactate and RER.
One mediating factor that may have had an effect on all metabolic and cardiovascular values measured is environmental temperature. The average temperature was 21°C during the laboratory test and −8°C during the field test. Previous studies have demonstrated an increase in venous return, stroke volume, VO2, and a decreased heart rate in cold environments21,22 while others have found contradictory results.23,24 The present study found no significant difference between the two protocols for the peak VO2 or oxygen pulse, suggesting little or no effect of the cold on these athletes.
The major limitation of the current study was the small sample size due to the uniqueness of this population. The small sample size increased the likelihood of a type II error (i.e. finding no difference between conditions when in fact there is a difference). Another limitation was the multiple comparisons which increased the likelihood of a type I error (i.e. finding a difference when in fact there is no difference). However, controlling for the type I error (i.e. use of a Bonferonni correction) was deemed too conservative with the lack of power from the small sample size.
CONCLUSION
In summary, the results suggest that a double poling ergometer protocol performed in the laboratory is comparable for measuring the peak VO2 to a field test in elite cross country sit skiing athletes. However, the field test elicits a significantly lower peak heart rate and a lower blood lactate and RER. This difference is most likely due to the continuous nature of the ergometer test compared to the more intermittent nature of the field test where the athlete alternates between periods of skiing and gliding depending on the section of the course.
REFERENCES
- 1. Faria IE, Faria EW, Parker D. Metabolic and ventilatory response to cross-country skiing classical and double arm poling exercise. J Sports Med Phys Fit. 1996;36:1–6 [PubMed] [Google Scholar]
- 2. Hoffman MD, Clifford PS. Physiological aspects of competitive cross country skiing. J Sports Sci. 1992;10:3–27 [DOI] [PubMed] [Google Scholar]
- 3. Leirdal S, Saetran L, Roeleveld K, et al. Effects of body position on slide boarding performance by cross-country skiers. Med Sci Sports Exerc. 2006;38:1462–1469 [DOI] [PubMed] [Google Scholar]
- 4. Wisloff U, Helgerud J. Evaluation of a new upper body ergometer for cross country skiers. Med Sci Sports Exerc. 1998;30:1314–1320 [DOI] [PubMed] [Google Scholar]
- 5. Baumgartl P. Treadmill ergometry and heart-volumes in elite biathletes: A longitudinal study. Int J Sports Med. 1990; 11:223–227 [DOI] [PubMed] [Google Scholar]
- 6. Bergh U. The influence of body mass in cross country skiing. Med Sci Sports Exerc. 1987;19:324–331 [PubMed] [Google Scholar]
- 7. Bilodeau B, Roy B, Boulay MR. Upper-body testing of cross country skiers. Med Sci Sports Exerc. 1995;27:1557–1562 [PubMed] [Google Scholar]
- 8. Ingjer F. Maximal oxygen uptake as a predictor of performance ability in women and men elite cross country skiers. Scand J Med Sci Sports. 1991;1:25–30 [Google Scholar]
- 9. Jackson, SA, Pollock ML, Graves JE, et al. Reliability and validity of bioelectrical impedance in determining body composition. J Appl Physiol. 1988;64:529–534 [DOI] [PubMed] [Google Scholar]
- 10. Karlson J. Profiles of cross country and alpine skiers. Clin J Sport Med. 1984;3:245–271 [PubMed] [Google Scholar]
- 11. Staib JL, Joohee I, Caldwell Z, et al. Cross-country ski racing performance predicted by aerobic and anaerobic double poling power. J Strength Cond Res. 2001;14:282–288 [Google Scholar]
- 12. Thoden JS. Testing Aerobic Power. In: MacDougall JD, Wenger HA, Green HJ. Physiological Testing of the High-Performance Athlete. 1991;107–173 [Google Scholar]
- 13. Haug RC, Porcari JP, Brice G, et al. Development of a maximal testing protocol for the Nordic Track cross country ski simulator. Med Sci Sports Exerc. 1999;31:619–623 [DOI] [PubMed] [Google Scholar]
- 14. Mygind E, Larsson B, Klausen T. Evaluation of a specific test in cross country skiing. J Sports Sci. 1991;9:249–257 [DOI] [PubMed] [Google Scholar]
- 15. Brown JK, Whittemore KT, Knapp TR. Is arm span an accurate measure of height in young and middle-age adults? Clin Nurs Res. 2000;9:84–94 [DOI] [PubMed] [Google Scholar]
- 16. Desport JC, Preux PM, Guinvarch S, et al. Total body water and percentage fat mass measurements using bioelectrical impedance analysis and anthropometry in spinal cord-injured patients. Clin Nutri. 2000;19:185–190 [DOI] [PubMed] [Google Scholar]
- 17. Burnley M, Doust JH, Vanhatalo A. A 3-min all out test to determine peak oxygen uptake and the maximal steady state. Med Sci Sports Exerc. 2006;38:1995–2003 [DOI] [PubMed] [Google Scholar]
- 18. Doyon KH, Perrey S, Abe D, et al. Field testing of VO2 peak in cross country skiers with portable breath by breath system. Can J Appl Physiol. 2001;26:1–11 [DOI] [PubMed] [Google Scholar]
- 19. Bhambhani Y, Norris S, Bell G. Prediction of stroke volume from oxygen pulse measurements in untrained and trained men. Can J Appl Physiol. 1994;19:49–59 [DOI] [PubMed] [Google Scholar]
- 20. Bhambhani Y, Maikala R, Esmail S. Oxygenation trends in vastus lateralis muscle during incremental and intense anaerobic cycle exercise in young men and women. Euro J Appl Physiol. 2001;84:547–556 [DOI] [PubMed] [Google Scholar]
- 21. Schmidt V, Bruck K. Effect of a precooling maneuver on body temperature and exercise performance. J Appl Physiol. 1981;50:772–778 [DOI] [PubMed] [Google Scholar]
- 22. Therminarias A, Flore P, Oddou-Chirpaz MF, et al. Influence of cold exposure on blood lactate response during incremental exercise. Euro J Appl Physiol Occup Physiol. 1989;58:411–418 [DOI] [PubMed] [Google Scholar]
- 23. Quirion A, Laurencelle L, Paulin L, et al. Metabolic and hormonal responses during exercise at 20 degrees, 0 degrees, and −20 degrees C. Int J Boimet. 1989;33:227–232 [DOI] [PubMed] [Google Scholar]
- 24. Sandsund M, Sue-Chu M, Helgerud J, et al. Effect of cold exposure (−15 degrees C) and salbutamol treatment on physical performance in elite nonasthmatic cross country skiers. Euro J Appl Physiol Occup Physiol. 1998;77:297–304 [DOI] [PubMed] [Google Scholar]


