Abstract
Background
Patients with heart failure (HF) develop abnormal pulmonary gas exchange; specifically they have an abnormal ventilation relative to metabolic demand (VE/VCO2, ventilatory efficiency) during exercise. The purpose of this investigation was to examine the factors that underlie the abnormal breathing efficiency in this population.
Methods
Fourteen controls and 33 moderate-severe HF patients, aged 52±12 and 54±8 years, respectively, performed submaximal exercise (~65% of maximum) on a cycle ergometer. Gas exchange and blood gas measurements were made at rest and during exercise. Submaximal exercise data were used to quantify the influence of hyperventilation (PaCO2) and dead space ventilation (VD) on VE/VCO2.
Results
The VE/VCO2 relationship was lower in controls (30±4) than HF (45±9, p<0.01). This was the result of hyperventilation (lower PaCO2) and higher VD/VT that contributed 40% and 47%, respectively, to the increased VE/VCO2 (p<0.01). The elevated VD/VT in the HF patients was the result of a tachypneic breathing pattern (lower VT, 1086±366 vs 2003±504 ml, p<0.01) in the presence of a normal VD (11.5±4.0 vs 11.9±5.7 L/min, p=0.095).
Conclusions
The abnormal ventilation in relation to metabolic demand in HF patients during exercise was due primarily to alterations in breathing pattern (reduced VT) and excessive hyperventilation.
Keywords: VE/VCO2, Dead Space Ventilation, Arterial CO2
Introduction
Cardiopulmonary gas exchange is an important clinical tool used to determine disease severity and prognosis. The most commonly reported measure, other than peak VO2, is breathing efficiency (VE/VCO2). This measure can be calculated as a slope or ratio and reflects minute ventilation (VE) in relation to carbon dioxide production (VCO2). It has been suggested that VE/VCO2 is elevated in worsening heart conditions and, therefore, reflects important information regarding how left ventricular function affects the lungs and/or ventilatory control.1 Despite recent developments in this area, peak VO2 remains the primary measurement used in clinical practice; as the physiological mechanisms that contribute to the increase observed in VE/VCO2 with HF are less clear.2 An improved understanding of the precise physiological changes occurring in HF patients, and how they interact, to alter ventilatory drive and breathing efficiency would add insight into this particular measure.
Breathing efficiency (VE/VCO2) can be explained using the modified alveolar equation;
Where, PaCO2 = arterial CO2 tension, and VD/VT = fraction of tidal volume (VT) that is dead space (VD)
The increased ventilation in HF patients and thus elevated VE/VCO2 is determined by the level of hyperventilation and the fraction of the tidal volume going to dead space (VD/VT)1. Under resting conditions a normal PaCO2 would be considered to be ~40 torr and VD/VT ~0.3.3,4 This would mean that if an individual had a VT of 500ml, VD would be 150ml. During mild to moderate exercise, in healthy individuals, PaCO2 stays relatively constant whereas VD/VT tends to decrease due to the rising VT. Therefore, for VE/VCO2 to increase with HF severity at rest and during exercise there must be some alterations, either singularly or combined, in the degree of hyperventilation (influencing PaCO2) and VD/VT. Previous studies in HF have suggested an increased ventilatory drive is likely to be due to increased stimulation or a heightened sensitivity of cardiac or pulmonary receptors, peripheral chemoreceptors and ergoreceptors in skeletal muscle; alterations that would cause a hyperventilatory response and subsequent reduction in PaCO2.5-8 Interestingly, despite these observations, it has been suggested that blood gases (PaCO2) in HF patients remain within normal ranges at rest and peak exercise.9,10 If this were the case then an elevated VD/VT must be responsible for the increased ventilation relative to metabolic demand observed in HF. There are two potential factors that could contribute to changes in VD/VT, ventilation-perfusion (V/Q) mismatching and an altered breathing pattern (i.e. lower tidal volume, higher breathing frequency). It has been suggested that the major source of increased VE/VCO2 in HF is due to an increased VD/VT, caused by V/Q mismatching, primarily from a reduced perfusion to the lungs resulting in inefficient gas exchange.1,10 It is also thought that a reduced VT, in the presence of a relatively normal dead space, may play some part in the increased VD/VT in this population. While suggestions have been made in the literature about the potential causes of increased VE/VCO2 in HF, the interactions of its component parts (i.e. hyperventilation vs changes in VD/VT and in turn the contributors to an elevated VD/VT, such as V/Q mismatch vs a tachypneic breathing pattern) are unclear.
Therefore, the aim of this study was to directly compare and quantify the contribution of hyperventilation (PaCO2) and VD/VT to the elevated VE/VCO2 during exercise in HF patients. We hypothesized that both hyperventilation and an increased VD/VT, the result primarily of an altered breathing pattern, would have an influence on VE/VCO2 in moderate to severe HF patients.
Methods
Fourteen healthy controls (10 male / 4 female) and 33 patients (30 male / 3 female) with moderate to severe HF, who were undergoing a cardiac transplant evaluation were included in this study (Table 1). All participants gave written informed consent and the study was approved by the Mayo Clinic Institutional Review Board; all procedures followed institutional and HIPAA guidelines.
Table 1.
Patient demographics.
| |
Normal (n=14) |
HF (n=33) |
|---|---|---|
| Gender (male / female) |
10 / 4 |
30 / 3 |
| Age (years) |
52 ± 12 |
54 ± 8 |
| Height (cm) |
176.0 ± 9.0 |
174.9 ± 8 |
| Weight (kg) |
86.3 ± 15.7 |
86.6 ± 16.3 |
| BMI (kg/m2) |
27.9 ± 5.0 |
28.2 ± 4.3 |
| Peak VO2 (ml/min/kg) |
33.2 ± 8.9 |
13.0 ± 3.8* |
| NYHA Class (II / III / IV) |
- |
5 / 19 / 9 |
| LVEF (%) |
- |
20 ± 6 |
| Therapy Distribution: | ||
| Ace Inhibitors (%) | - | 73 |
| B-blockers (%) | - | 85 |
| Angiotensin II blocker (%) | - | 18 |
| Digitalis (%) | - | 76 |
| Diuretics (%) | - | 91 |
BMI – body mass index; LVEF – left ventricle ejection fraction; NYHA – New York Heart Association; Peak VO2 – peak oxygen consumption.
Data are presented as mean ± standard deviation.
Significant differences between control and HF groups (p<0.01).
Exercise Testing
Heart failure patients performed graded exercise to volitional exhaustion to determine peak exercise capacity (VO2peak). Prior to the test, patients were instrumented for the measurement of heart rate (electrocardiogram), gas exchange (mouthpiece and nose clip) and oxygen saturation (pulse oximetry). Following this test (on a separate day) patients underwent cardiac catheterization and as part of this procedure performed graded exercise in the supine position, using a cycle ergometer, to a rating of perceived exertion >16 (on Borg Scale 6-20). Patients were instructed to cycle at ~60 revolutions per minute (RPM), with the protocol starting at 20W and increasing by 10W every three minutes. Continuous measurements of heart rate, gas exchange and blood gases (arterial catheter) were made at rest and during exercise. Calculations were performed to determine when patients were exercising at 60-65% of peak VO2 and this was the data used in this analysis. It should be noted that following analysis of upright and supine data (at ~65% of peak VO2) there was little difference in our major outcome variables (i.e. VE/VCO2 was 43±8 during upright exercise vs 45±9 during supine exercise) suggesting posture had little impact on our measurements.
The control subjects performed graded exercise to volitional exhaustion on an upright cycle ergometer. Measurements of heart rate, gas exchange, oxygen saturation and blood gases were made at rest and during exercise. The protocol started at 35W and increased on average 35W every two minutes. Participants were asked to exercise at a RPM > 60 and they were encouraged to reach a near maximal effort by monitoring respiratory exchange ratio (>1.10) and rating of perceived exertion (>18 on Borg Scale 6-20). Once participants reached a maximal level or when they were unable to maintain an RPM >60 the exercise test was terminated. To allow for comparisons to be made with the HF group, calculations were performed to determine exercise data that corresponded to 60-65% of peak VO2.
Gas exchange measurements were obtained using a metabolic cart (CPX/D, Medical Graphics, St. Paul, MN) validated with classic gas collection techniques.11,12 Gas exchange variables including oxygen consumption (VO2), carbon dioxide production (VCO2), minute ventilation (VE), tidal volume (VT), breathing frequency (BF), estimated end-tidal CO2 (PETCO2) and other derived variables (i.e. respiratory exchange ratio [RER]) were recorded breath-by-breath. In addition, arterial bloods were drawn from the radial artery for measurement of partial pressure of oxygen (PaO2) and carbon dioxide (PaCO2) at the end of each exercise stage.
Data Analysis
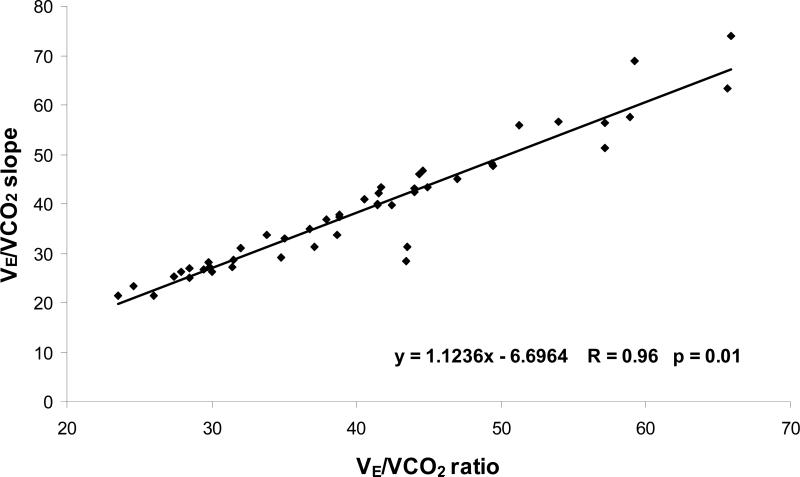
Breathing efficiency was initially calculated as a ratio at ~65% of exercise capacity, and as a slope using data up to ~65% of peak exercise in both groups; the latter being the more traditional method used in the majority of studies.13,14 Following linear regression analysis of these calculations (Figure 1) it was apparent that there was a strong correlation between both methods (r = 0.96, p<0.01). Therefore, we used the VE/VCO2 ratio in the remainder of our analysis so it was possible to directly quantify the impact of hyperventilation and VD/VT on breathing inefficiency in this HF population at this time period and workload.
Figure 1.
The relationship between VE/VCO2 slope and VE/VCO2 ratio at submaximal exercise.
Additional calculations were performed to equate, the fraction of VT that was dead space (VD/VT = (PaCO2 – PeCO2)/PaCO2, where PeCO2 is an estimate of mixed expired CO2); alveolar oxygen content (PAO2, [PAO2 = 0.21*(736-47) – PaCO2*(0.21+0.79/ RER)], where RER is the respiratory exchange ratio); and the alveolar-arterial oxygen difference (A-aO2 = PAO2 – PaO2). In addition, cardiac output (Q) was determined in all subjects using one of two methods. All of the HF patients and half of the control group had venous blood gases measured during the exercise test and this allowed for the use of the direct Fick equation where arterial (CaO2) and mixed venous (CvO2) oxygen content were calculated as; CaO2 = (1.34*Hgb*arterial oxygen saturation) + (PaO2*0.0031) and CvO2 = (1.34*Hgb*venous oxygen saturation) + (PvO2*0.0031), respectively. For the remaining subjects (seven controls) venous blood gas measurements were not obtained and cardiac output was calculated using the non-invasive acetylene method, a technique that has been validated against the direct Fick in our laboratory.11
Statistics
Means and standard deviations were calculated and presented in graphical and tabular form. To assess differences between the two groups (normal controls and HF patients) two-tailed independent sample T-tests were performed with the significance level set at p<0.05 (using SPSS, version 12, Chicago, Illinois, US). Relationships between measured gas exchange variables were assessed using linear regression analysis and Pearson's correlation coefficient.
Results
Participant Characteristics
Patient demographics are presented in Table 1, as means and standard deviations, for each group. The age, height, weight and BMI were similar for both groups. The HF group had a peak VO2 (13.0±3.8ml/min/kg) that was significantly reduced in comparison to the control group (33.2±8.9ml/min/kg, p<0.01). Table 1 also contains additional information regarding LV ejection fraction, NYHA class, and prescribed medications of the HF patients.
Resting Cardio-Respiratory and Blood Gas Data
There were differences in ventilation, breathing pattern and blood gas data at rest between the control and HF groups that are shown in Table 2. While, there was also a significant difference in VE/VCO2 ratio between the two groups, resting data are more variable than data obtained from submaximal or peak exercise. Therefore, the remainder of this analysis concentrated on measurements made during exercise.
Table 2.
Resting cardio-respiratory and blood gas data
| |
Control |
HF |
p value |
|---|---|---|---|
| VE (L/min) | 11.9 ± 2.8 | 10.3 ± 2.3 | 0.034 |
| VT (ml) | 855 ± 183 | 595 ± 188 | <0.01 |
| BF (bf/min) | 14 ± 3 | 19 ± 5 | <0.01 |
| VO2 (L/min) | 0.38 ± 0.12 | 0.25 ± 0.06 | <0.01 |
| VCO2 (L/min) | 0.32 ± 0.09 | 0.22 ± 0.06 | <0.01 |
| RER | 0.84 ± 0.11 | 0.88 ± 0.1 | 0.2 |
| PETCO2 (mmHg) | 36 ± 3 | 31 ± 4 | <0.01 |
| HR (bpm) | 71 ± 9 | 75 ± 16 | 0.44 |
| Q (L/min) | 4.4 ± 1.3 | 4.0 ± 1.4 | 0.51 |
| VE/VCO2 ratio | 39 ± 5 | 48 ± 9 | <0.01 |
| PaCO2 (mmHg) | 38 ± 3 | 36 ± 4 | 0.24 |
| VD/VT | 0.39 ± 0.06 | 0.47 ± 0.08 | <0.01 |
| VD (L/min) | 4.7 ± 1.3 | 5.0 ± 1.3 | 0.49 |
| VD/VE (%) | 39 ± 6 | 49 ± 8 | <0.01 |
| VA (L/min) | 7.2 ± 1.8 | 5.3 ± 1.5 | <0.01 |
| PaO2 (mmHg) | 96 ± 4 | 75 ± 12 | <0.01 |
| PAO2 (mmHg) | 101 ± 5 | 104 ± 5 | 0.049 |
| AaDO2 (mmHg) | 5 ± 5 | 29 ± 12 | <0.01 |
| SaO2 (%) | 97 ± 1 | 95 ± 3 | <0.01 |
AaDO2 – alveolar / arterial oxygen difference; BF – breathing frequency; HR – heart rate; PETCO2 – end tidal carbon dioxide; PAO2 – alveolar oxygen content; PaO2 – arterial oxygen content; PaCO2 – arterial carbon dioxide content; Q – cardiac output; RER – respiratory exchange ratio; SaO2 – oxygen saturation; VA – alveolar ventilation; VCO2 – carbon dioxide production; VD – dead space ventilation; VD/VE – dead space to minute ventilation ratio; VD/VT – dead space to tidal volume ratio; VE – minute ventilation; VE/VCO2 ratio – breathing efficiency; VO2 – oxygen uptake; VT – tidal volume.
Data are present as mean ± standard deviation.
Gas Exchange during Submaximal Exercise
Cardiopulmonary measurements made during submaximal exercise are presented in Table 3. While, the relative submaximal workloads were matched between groups at 60-65% of VO2peak, the controls performed at a higher (p<0.01) exercise intensity (127±41W) compared to the HF group (33±12W). This exercise limitation was not surprising given the limited Q of the HF group. The control group had a greater (p<0.01) VE (50.1±16.9L/min) than the HF group (33.1±9.7L/min), which was mainly due to a greater VT. Finally, the HF group had a greater CO2 production in relation to O2 uptake, as evidenced by a higher RER (1.05±0.1 vs 0.9±0.06, p<0.01), for a similar relative exercise intensity.
Table 3.
Submaximal exercise data
| |
Control |
HF |
p value |
|---|---|---|---|
| VE (L/min) | 50.1 ± 16.9 | 31.1 ± 9.7 | <0.01 |
| VT (ml) | 2003 ± 504 | 1086 ± 366 | <0.01 |
| BF (bf/min) | 25 ± 5 | 30 ± 7 | 0.03 |
| VO2 (L/min) | 1.86 ± 0.51 | 0.67 ± 0.22 | <0.01 |
| VCO2 (L/min) | 1.70 ± 0.53 | 0.71 ± 0.22 | <0.01 |
| RER | 0.9 ± 0.06 | 1.05 ± 0.1 | <0.01 |
| PETCO2 (mmHg) | 40 ± 3 | 29 ± 6 | <0.01 |
| HR (bpm) | 126 ± 20 | 104 ± 20 | <0.01 |
| Q (L/min) | 12.6 ± 3.0 | 5.7 ± 3.1 | <0.01 |
| Work Rate (Watts) | 127 ± 41 | 33 ± 12 | <0.01 |
| Relative Work (%) | 67 ± 11 | 61 ± 7 | 0.03 |
See Table 2 for abbreviations. Data are presented as mean ± standard deviation.
Alterations in VD/VT, PaCO2 and VE/VCO2 with HF
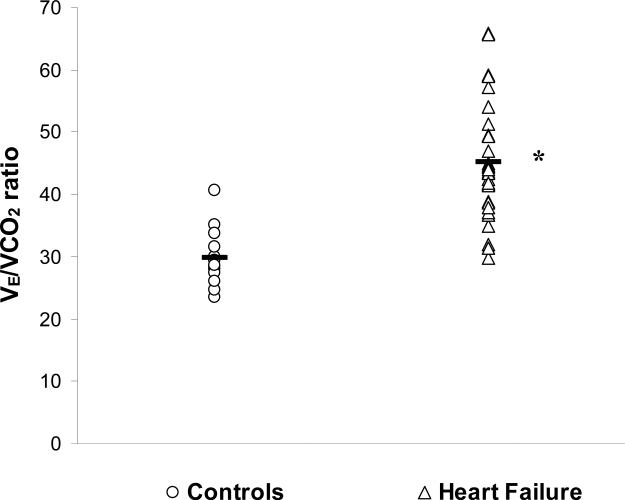
Submaximal exercise blood gas data, alveolar gas data and other derived variables are presented in Table 4. The HF group had an elevated VD/VT in comparison to the control group (0.37±0.08 and 0.23±0.06, respectively, p<0.01). There was also a lower PaCO2 in the HF group compared to the controls (33±5 vs 39±4mmHg, respectively, p<0.01). The product of these changes was an elevated VE/VCO2 in the HF group compared to controls (45±9 vs 30±4, respectively, p<0.01). The breathing efficiency of each individual patient within the two groups, as well as the group mean, is shown in Figure 2.
Table 4.
Exercise arterial and alveolar O2 and CO2 content, dead space and VE/VCO2
| |
Control |
HF |
p value |
|---|---|---|---|
| VE/VCO2 ratio | 30 ± 4 | 45 ± 9 | <0.01 |
| PaCO2 (mmHg) | 39 ± 4 | 33 ± 5 | <0.01 |
| VD/VT | 0.23 ± 0.06 | 0.37 ± 0.08 | <0.01 |
| VD (L/min) | 11.9 ± 5.7 | 11.5 ± 4.0 | 0.79 |
| VD/VE (%) | 23 ± 6 | 37 ± 8 | <0.01 |
| VA (L/min) | 38.3 ± 12.6 | 19.6 ± 7.1 | <0.01 |
| PaO2 (mmHg) | 92 ± 6 | 79 ± 14 | <0.01 |
| PAO2 (mmHg) | 102 ± 5 | 113 ± 7 | <0.01 |
| AaDO2 (mmHg) | 10 ± 4 | 33 ± 14 | <0.01 |
| SaO2 (%) | 96 ± 1 | 96 ± 3 | 0.71 |
See Table 2 for abbreviations. Data are presented as mean ± standard deviation.
Figure 2.
Individual (open) and group mean (black) data for VE/VCO2 ratio in normal (circle) and HF (triangle) patients at submaximal exercise. * Significant difference between control and HF group (p<0.01).
Absolute dead space per minute (VD) was similar between groups but when this was calculated as a percentage of total ventilation (VE) the severe HF group had a significantly greater VD/VE compared to the normal controls. In addition, while the HF patients had a slightly higher PAO2 in comparison to the control group they also had a lower PaO2 (79±14 vs 92±6mmHg, respectively, p<0.01) and as a result an elevated A-aO2 difference (33±14 vs 10±4, respectively, p<0.01). Finally, there was no difference in exercise oxygen saturation between the two groups (p = 0.59).
Hyperventilation (PaCO2) and VD/VT: their effect on VE/VCO2
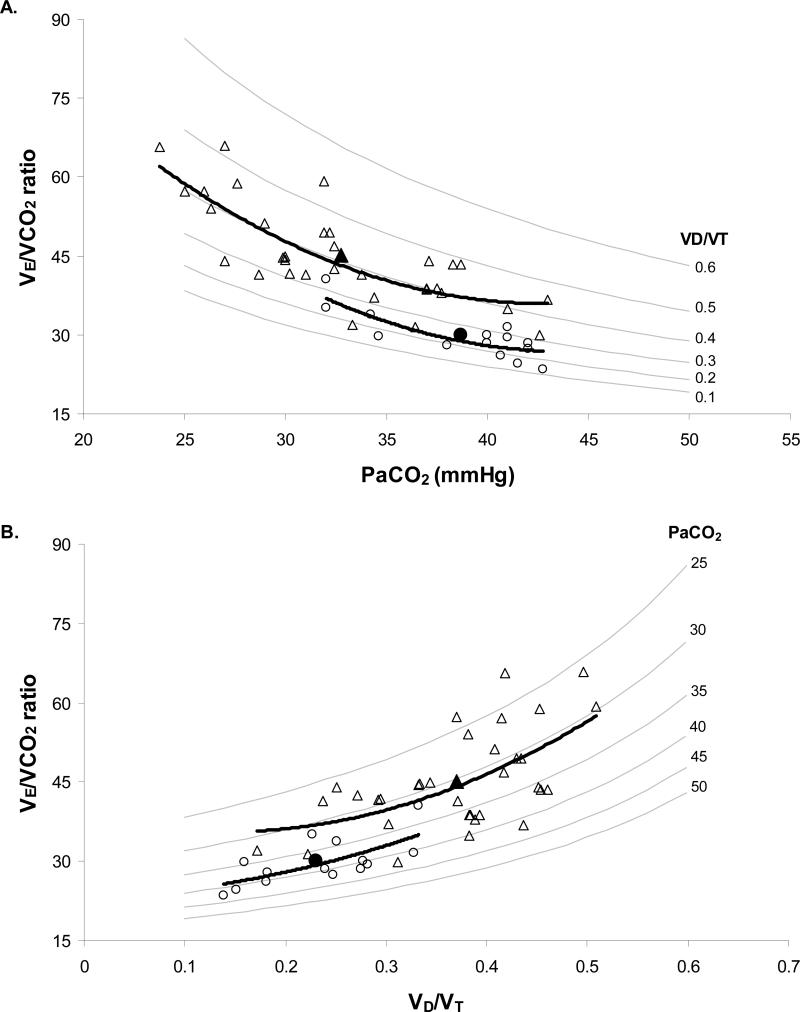
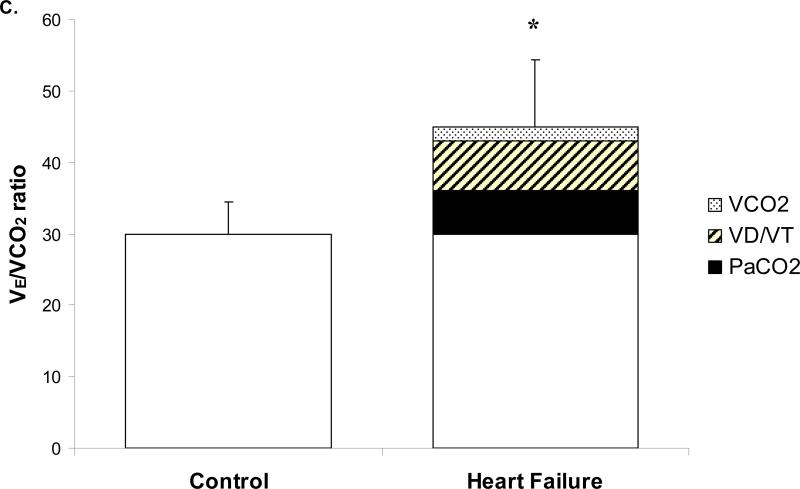
In an attempt to quantify the contributions of VD/VT and PaCO2 to increased VE/VCO2 in the HF patients, we created models to demonstrate the changes in VE/VCO2 for a given change in VD/VT or PaCO2 (Figure 3). As VD/VT increased and PaCO2 decreased (hyperventilation) the VE/VCO2 ratio was elevated (Figure 3 A and B). Hence, the worst breathing efficiency value would occur when VD/VT was very high (~0.6) and PaCO2 extremely low (~25mmHg). In these particular graphs the control and severe HF individual and mean exercise data were superimposed. Using these graphical models, and linear regression analysis of control data, we were able to quantify the impact of hyperventilation (PaCO2) and VD/VT on VE/VCO2 in the HF patients (Figure 3C). A reduced PaCO2 and an increased VD/VT contributed 40% and 47%, respectively, to the total change in the VE/VCO2 ratio in the HF group. The remaining 13% difference in VE/VCO2 was explained by a lower CO2 production (VCO2).
Figure 3.
Relationships of PaCO2, VD/VT, and VE/VCO2. Graph A and B are models of the effects of changing PaCO2 and VD/VT on VE/VCO2 in normal controls (○ individual data, ● group mean) and HF patients (△ individual data, ▲ group mean). Grey lines are isopleths of VD/VT (A) and PaCO2 (B); black lines are trend lines for control and HF data.
Graph C quantifies the relative contribution of PaCO2 (black), VD/VT (stripes) and VCO2 (dots) to the increased VE/VCO2 seen in HF group. * Significant difference between control and HF groups (p<0.01).
The effects of Altered Dead Space and Breathing Pattern on VD/VT in HF
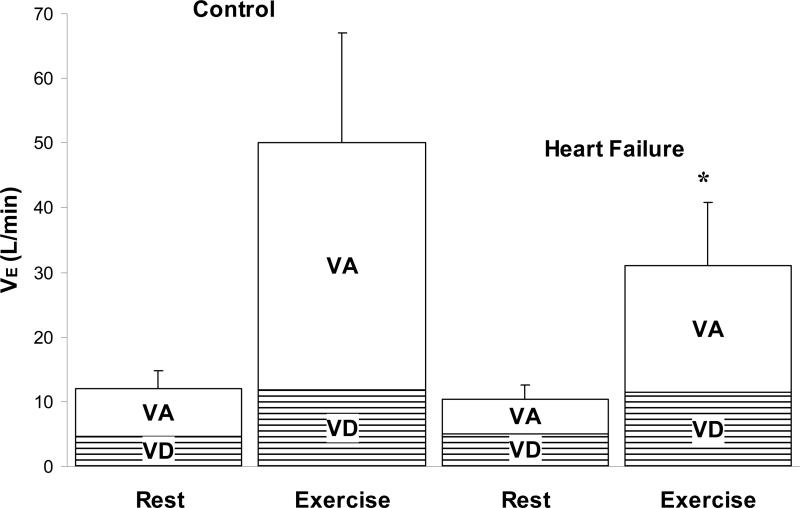
Dead space ventilation per minute (VD) was relatively unchanged between controls and HF patients at rest and during exercise, as shown in Figure 4. While there was also little difference in alveolar ventilation (VA) at rest between the two groups; during submaximal exercise the HF patients had a lower VA than the control group (19.6±7.1 and 38.3±12.6L/min, respectively, p<0.01).
Figure 4.
The contribution of VD and VA to minute ventilation in the control and HF groups at rest and submaximal exercise. * Significant difference between control and HF groups (p<0.01).
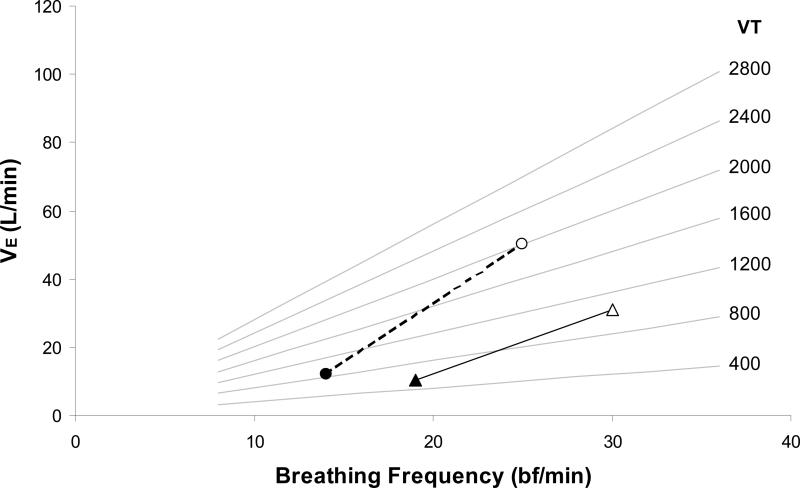
The lower minute ventilation during exercise in the HF patients may be explained by an altered breathing pattern (Figure 5). It was apparent that the severe HF patients had a significantly reduce VT during submaximal exercise. Therefore, the increased VD/VT in these HF patients was exclusively explained by a lower VT in the presence of a normal dead space.
Figure 5.
Differences in breathing pattern in normal (circle) and HF (triangle) patients from rest (black) to submaximal exercise (open). Grey lines are isopleths of VT; black lines demonstrate the change in breathing pattern with exercise in each group.
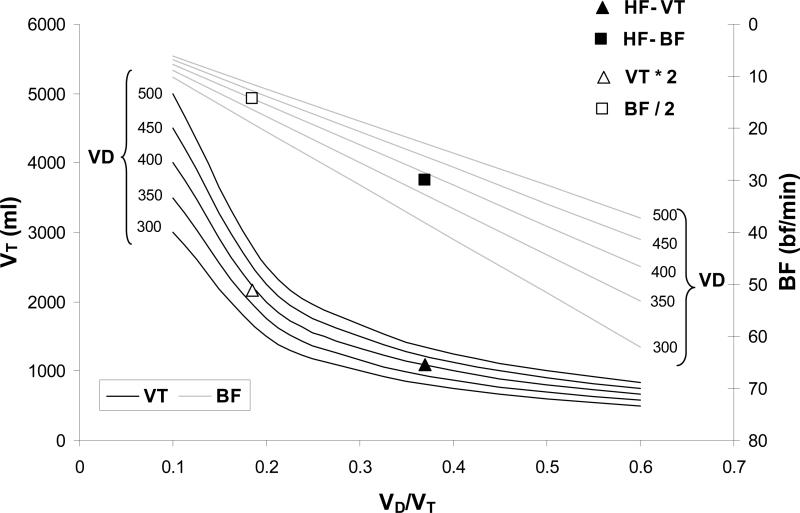
To demonstrate the effects of changes in breathing pattern we created a model that examined the effect of changes in VT and BF on VD/VT, at a given dead space (ranging from 300-500ml) when VE was maintained at 31L/min – this corresponded to the measured ventilation of the HF group during exercise (Figure 6). The model demonstrated that as VT decreased, for a known dead space, BF increased to maintain VE (at 31 L/min) and as a result VD/VT increased. HF data were superimposed on to the graph and corresponded approximately to a VD of 400ml, VT of 1100ml, a BF of 30bf/min and a VD/VT of 0.4. When VT was doubled, to represent a more normal exercise value (~2200ml), BF would be reduced (~14bf/min) and VD/VT would decrease by ~50% to <0.2, highlighting the large impact an altered VT had in these HF patients.
Figure 6.
The effect of alterations in VT (black line) and BF (grey line), when maintaining a constant VE of 31 L/min at a given dead space (isopleths), on VD/VT. HF data is presented for VT (▲ HF-VT) and BF (■ HF-BF). This group had a dead space of ~400ml and a VD/VT of ~0.4. In this model when VT (△ VT*2) was doubled to a more normal value (~2200ml), to maintain the same VE i.e. 31 L/min, BF (□ BF/2) was reduced by half. If dead space remained the same (400ml) VD/VT would be reduced by half to 0.2.
Discussion
The main findings of the present study were, 1. Breathing efficiency, defined as the VE/VCO2 ratio at ~65% VO2peak, was greater in the heart failure group during submaximal exercise. This in itself was not a novel finding but adds support to the growing literature in this area. 2) The contribution of hyperventilation (quantified by the reduction in PaCO2) and fraction of tidal volume that is dead space (VD/VT) to this abnormal ventilation observed in the HF group were 40% and 47%, respectively. This study directly quantified the individual affects of hyperventilation and VD/VT on VE/VCO2 in HF patients, who were performing at similar relative exercise workloads as matched controls, and our data suggests these two components have a similar contributing affect to the elevated VE/VCO2. 3) This study also demonstrated the effect of breathing pattern on VD/VT. The HF patients had a smaller VE during exercise that was the result of a reduced VT. Despite these changes in minute ventilation, dead space (VD) remained similar between groups, and hence the elevated VD/VT was explained exclusively by the reduced tidal volume (VT). 4) Finally, a widened A-aO2 difference that was primarily due to a lower PaO2 was observed in the HF group. This was probably the result of high V/Q regions in the lungs, rather than shunt or low V/Q regions.
While, the abnormal ventilatory response to exercise has been well documented in HF patients, the mechanisms causing it are not well understood.2,15 The present study has shown that hyperventilation, and a resultant decrease in PaCO2, contributed 40% to the total increase in breathing inefficiency in moderate/severe HF patients during submaximal exercise. This remains controversial as some have agreed with the present findings,13,15,16 while others have suggested that PaCO2 is similar to controls during exercise.9,10,17 Discrepancies in the literature may be attributed to difference in the severity of HF patients studied, the level of exercise employed (i.e. submaximal vs peak) or the use of PETCO2 as an indirect assessment of arterial blood gases.
Various mechanism have been postulated to explain the hyperventilatory response, observed by some, in moderate/severe HF patients and this includes ventilatory abnormalities, increased central and peripheral chemoreceptor activity 6,16 and increased ergoreceptor drive.18,19 The decrease in PaCO2 from rest to exercise in the present study was accompanied by a small increase in PaO2 (this still remained lower than that of the control group) and no change in SaO2, consistent with previous findings,20 suggesting that a gas exchange abnormality is probably not responsible for the hyperventilation observed. More recent research has suggested that overactive chemo- and ergo- reflexes are the stimuli for heightened ventilatory responses in HF patients. Ponikowski et al. demonstrated high chemoreceptor gain for PaO2 and PaCO2 in HF patients that correlated with greater VE/VCO2 slopes.6 However, increased chemoreceptor activity alone would not alter ventilatory drive; there must also be a change in the set point at which CO2 is maintained and this is thought to be the result of increased activity from skeletal muscle ergoreceptors and increased sympathetic activity, both of which are augmented in HF.5 This has been supported by Wensel et al. who suggested that arterial lactate accumulation may stimulate ergoreceptors during exercise, thus increasing ventilatory drive and inducing hyperventilation.15
In conjunction with the changes in PaCO2, there was also an increase in fractional dead space (VD/VT) that contributed 47% to the total increase in VE/VCO2. There are two potential sources for the elevated VD/VT seen in HF patients, a low tidal volume with normal dead space and/or an abnormally high physiological dead space. Previous research has reported VT to be reduced in HF patients during exercise, however it was estimated that this altered breathing pattern was only responsible for approximately 33% of the increased dead space ventilation.21 Therefore, it was suggested that V/Q mismatching, resulting from reduced alveoli perfusion, was the major source for the elevated VD/VT and abnormally steep VE/VCO2 slope in HF.1,22 Wasserman et al. supported this view, suggesting that structural changes in the lung, pulmonary vasoconstriction and reduced perfusion of the lung were responsible for the higher VD/VT and excessive ventilation observed in HF patients.10 The present study, however, found that a lower VT during submaximal exercise was the dominant factor responsible for the elevated VD/VT; as dead space ventilation was similar to that of the control group. It has been suggested that alterations in breathing pattern, i.e. increased breathing rate, lower VT and lower VE during exercise, may be in response to lower PaCO2 levels (due to hyperventilation and reduced alveoli perfusion) and may be designed to ensure arterial CO2 level does not deteriorate further.20 It is also possible that the altered breathing pattern of HF patients is due in part to structural changes of the cardio-pulmonary system. Heart failure patients have been shown to develop lung restrictive defects resulting from pulmonary fibrosis, elevated pulmonary vasoconstriction and increased pulmonary congestion (due in part to increased heart size).10,23 In order to maintain sufficient ventilation during exercise, in the face of this increased resistance, HF patients may shift their operational lung volumes and breathe with a tachypneic pattern (i.e. lower volume and higher rate).23 Finally, the HF patients had a severely reduced cardiac output during exercise. It is possible that a reduced blood flow to the respiratory muscles during exercise would cause a reduction in their performance and breathing pattern may be altered in an attempt to lower the cost of breathing and work of the respiratory muscles.24
While there are multiple underlying mechanisms that may explain the changes in PaCO2 and VD/VT in heart failure they remain speculative, and more work is required to fully elucidate how and why these alterations occur. Nevertheless, this study suggests that both hyperventilation and increased VD/VT were responsible for the elevated VE/VCO2 ratio seen in HF patients during submaximal exercise.
Implications
Heart failure has important effects on lung function and hence the measurement of gas exchange efficiency during exercise to predict severity and prognosis is an extremely useful tool. Numerous studies have shown VE/VCO2 slope or ratio to be a good predictor of survival that is, in fact, stronger than peak VO2, the traditional measurement used to define HF class and prognosis.14 The steepness of the slope or an increase in the ratio of VE to VCO2 also seems to reflect the severity of HF and may be a more beneficial diagnostic tool than those already used in clinical practice (i.e. LVEF or NYHA). The measurement and calculation of VE/VCO2 is simple, inexpensive, patient friendly and can be applied at low exercise intensities, hence it is a valuable tool that can be used to diagnose and track heart failure.
Limitations
The present study examined differences between control subjects and HF patients at similar relative exercise intensities, instead of matching total ventilation. We decided that it would be more beneficial to determine what changes occurred in the HF group when they performed at a similar relative exercise level. Had we matched the groups according to ventilation the control group would have been performing at much lower exercise intensities. While, the HF group did have a lower VE this was accompanied by a smaller VCO2, which contributed only 13% to the total increase in VE/VCO2, hence we were still able to demonstrate the impact of hyperventilation and VD/VT on breathing efficiency. In addition, if patient and control VE had been matched we would not have been able to include 12 patients as they had very low minute ventilation during exercise, which would have reduced the sample size considerably.
When examining the data presented it must be remembered that each HF patient was taking prescribed medications (Table 1) to alleviate debilitating symptoms of HF. Despite this we have shown that the HF patients have a reduced breathing efficiency in comparison to the healthy controls. It would be anticipated that removal of these state of the art medications would cause moderate to severe decompensation, significant dyspnea during activity, and cause breathing efficiency to deteriorate further.
Conclusion
This study demonstrated the physiological changes that contribute to the altered breathing efficiency commonly seen in HF patients. While, the prognostic capabilities of the measurement of VE/VCO2 are clear there has been some reluctance to use this in a clinical environment as contributory mechanisms causing the excessive ventilation have been poorly understood. This study has shown that in moderate/severe HF patients, a decreased PaCO2 and increased VD/VT were equally responsible for the reduced breathing efficiency, with the elevated VD/VT primarily due to a lower VT. This may be attributed to structural changes in the heart, lungs and pulmonary vasculature, reduced pulmonary perfusion and altered chemo- or ergo- receptor drive.
Acknowledgments
The authors thank Kathy O'Malley for help in data collection and subjects for their participation in this study.
This study was supported by NIH Grant HL71478.
Footnotes
Publisher's Disclaimer: This is a PDF file of an unedited manuscript that has been accepted for publication. As a service to our customers we are providing this early version of the manuscript. The manuscript will undergo copyediting, typesetting, and review of the resulting proof before it is published in its final citable form. Please note that during the production process errors may be discovered which could affect the content, and all legal disclaimers that apply to the journal pertain.
Disclosures
Nothing to disclose.
References
- 1.Johnson RL. Gas exchange efficiency in congestive heart failure. Circulation. 2000;101:2774–2776. doi: 10.1161/01.cir.101.24.2774. [DOI] [PubMed] [Google Scholar]
- 2.Coats AJS. Why ventilatory inefficiency matters in chronic heart failure. Eur Heart J. 2005;26:426–427. doi: 10.1093/eurheartj/ehi141. [DOI] [PubMed] [Google Scholar]
- 3.Wasserman K, VanKessel A, Burton GG. Interaction of physiological mechanisms during exercise. J Appl Physiol. 1967;22:71–85. doi: 10.1152/jappl.1967.22.1.71. [DOI] [PubMed] [Google Scholar]
- 4.Sun XG, Hansen JE, Garatachea N, Storer TW, Wasserman K. Ventilatory efficiency during exercise in healthy subjects. Am J Respir Crit Care Med. 2002;166:1443–1448. doi: 10.1164/rccm.2202033. [DOI] [PubMed] [Google Scholar]
- 5.Johnson RL. Gas exchange efficiency in congestive heart failure II. Circulation. 2001;103:916–918. doi: 10.1161/01.cir.103.7.916. [DOI] [PubMed] [Google Scholar]
- 6.Ponikowski P, Francis DP, Piepoli MF, Davies LC, Chua TP, Davos CH, et al. Enhanced ventilatory response to exercise in patients with chronic heart failure and preserved exercise tolerance: marker of abnormal cardiorespiratory reflex control and predictor of poor prognosis. Circulation. 2001;103:967–972. doi: 10.1161/01.cir.103.7.967. [DOI] [PubMed] [Google Scholar]
- 7.Arena R, Myers J, Hsu L, Peberdy MA, Pinkstaff S, Bensimhon D, et al. The minute ventilation / carbon dioxide production slope is prognostically superior to the oxygen uptake efficiency slope. J Cardiac Fail. 2007;13:462–469. doi: 10.1016/j.cardfail.2007.03.004. [DOI] [PubMed] [Google Scholar]
- 8.Chua TP, Ponikowski P, Harrington D, Anker AD, Webb-Peploe K, Clark AL, et al. Clinical correlates and prognostic significance of the ventilatory response to exercise in chronic heart failure. J Am Coll Cardiol. 1997;29:1585–1590. doi: 10.1016/s0735-1097(97)00078-8. [DOI] [PubMed] [Google Scholar]
- 9.Franciosa JA, Leddy CL, Wilen M, Schwartz DE. Relation between hemodynamic and ventilatory responses in determining exercise capacity in severe congestive heart failure. Am J Cardiol. 1984;53(1):127–134. doi: 10.1016/0002-9149(84)90696-9. [DOI] [PubMed] [Google Scholar]
- 10.Wasserman K, Zhang YY, Gitt A, Belardinelli R, Koike A, Lubarsky L, et al. Lung function and exercise gas exchange in chronic heart failure. Circulation. 1997;96:2221–2227. doi: 10.1161/01.cir.96.7.2221. [DOI] [PubMed] [Google Scholar]
- 11.Johnson BD, Beck KC, Proctor DN, Miller J, Dietz NM, Joyner MJ. Cardiac output during exercise by the open circuit acetylene washin method: comparison with direct Fick. J Appl Physiol. 2000;88:1650–1658. doi: 10.1152/jappl.2000.88.5.1650. [DOI] [PubMed] [Google Scholar]
- 12.Proctor DN, Beck KC. Delay time adjustments to minimize errors in breath by breath measurement of VO2 during exercise. J Appl Physiol. 1996;81(6):2495–2499. doi: 10.1152/jappl.1996.81.6.2495. [DOI] [PubMed] [Google Scholar]
- 13.Guazzi M, Reina G, Tumminello G, Guazzi MD. Exercise ventilation inefficiency and cardiovascular mortality in heart failure: the critical independent prognostic value of the arterial CO2 partial pressure. Eur Heart J. 2005;26:472–480. doi: 10.1093/eurheartj/ehi060. [DOI] [PubMed] [Google Scholar]
- 14.Koike A, Itoh H, Kato M, Sawada H, Aizawa T, Fu LT, et al. Prognostic power of ventilatory responses during submaximal exercise in patients with chronic heart failure. Chest. 2002;121(5):1581–1588. doi: 10.1378/chest.121.5.1581. [DOI] [PubMed] [Google Scholar]
- 15.Wensel R, Georgiadou P, Francis DP, Bayne S, Scott AC, Genth-Zotz S, et al. Differential contribution of dead space ventilation and low arterial pCO2 to exercise hyperpnea in patients with chronic heart failure secondary to ischemic or idiopathic dilated cardiomyopathy. Am J Cardiol. 2004;93:318–323. doi: 10.1016/j.amjcard.2003.10.011. [DOI] [PubMed] [Google Scholar]
- 16.Naeije R, van de Borne P. Clinical relevance of autonomic nervous system disturbances in pulmonary arterial hypertension. Eur Respir J. 2009;34:792–794. doi: 10.1183/09031936.00091609. [DOI] [PubMed] [Google Scholar]
- 17.Tanabe Y, Hosaka Y, Ito M, Ito E, Suzuki K. Significance of end-tidal PCO2 response to exercise and its relation to functional capacity in patients with chronic heart failure. Chest. 2001;119:811–817. doi: 10.1378/chest.119.3.811. [DOI] [PubMed] [Google Scholar]
- 18.Piepoli M, Clark AL, Volterrani M, Adamopoulos S, Sleight P, Coats AJS. Contribution of muscle afferents to the hemodynamic, autonomic, and ventilatory responses patients with chronic heart failure: effects of physical training. Circulation. 1996;93:940–952. doi: 10.1161/01.cir.93.5.940. [DOI] [PubMed] [Google Scholar]
- 19.Olson TP, Joyner MJ, Johnson BD. Influence of locomotor muscle metaboreceptor stimulation on the ventilatory response to exercise in heart failure. Circ Heart Fail. 2010 doi: 10.1161/CIRCHEARTFAILURE.109.879684. In press. [DOI] [PMC free article] [PubMed] [Google Scholar]
- 20.Clark AL, Volterrani M, Swan JW, Coats AJS. The increased ventilatory response to exercise in chronic heart failure: relation to pulmonary pathology. Heart. 1997;77:138–146. doi: 10.1136/hrt.77.2.138. [DOI] [PMC free article] [PubMed] [Google Scholar]
- 21.Buller NP, Poole-Wilson PA. Mechanism of the increased ventilatory response to exercise in patients with chronic heart failure. Br Heart J. 1990;63:281–283. doi: 10.1136/hrt.63.5.281. [DOI] [PMC free article] [PubMed] [Google Scholar]
- 22.Sullivan MJ, Higginbotham MB, Cobb FR. Increased exercise ventilation in patients with chronic heart failure: intact ventilatory control despite hemodynamic and pulmonary abnormalities. Circulation. 1988;77:552–559. doi: 10.1161/01.cir.77.3.552. [DOI] [PubMed] [Google Scholar]
- 23.Johnson BD, Beck KC, Olson LJ, O'Malley KA, Allison TG, Squires RW, et al. Ventilatory constraints during exercise in patients with chronic heart failure. Chest. 2000;117:321–332. doi: 10.1378/chest.117.2.321. [DOI] [PubMed] [Google Scholar]
- 24.Olson TP, Snyder EM, Johnson BD. Exercise-disordered breathing in chronic heart failure. Exerc Sport Sci Rev. 2006;34(4):194–201. doi: 10.1249/01.jes.0000240022.30373.a2. [DOI] [PubMed] [Google Scholar]


