

Summary
Electrical brain stimulation is a promising tool for both experimental and clinical applications. However, the effects of stimulation on neuronal activity are highly variable and poorly understood. To investigate the basis of this variability, we performed extracellular recordings in the visual cortex following application of transcranial magnetic stimulation (TMS). Our measurements of spiking and local field potential activity exhibit two types of response patterns which are characterized by the presence or absence of spontaneous discharge following stimulation. This variability can be partially explained by state-dependent effects, in which higher pre-TMS activity predicts larger post-TMS responses. These results reveal the possibility that variability in the neural response to TMS can be exploited to optimize the effects of stimulation. It is conceivable that this feature could be utilized in real-time during the treatment of clinical disorders.
Keywords: TMS, brain stimulation, state-dependency, bursting, synchrony, visual cortex
Introduction
There is an extensive history of attempts to alter brain function using external electrical stimulation (Fritsch and Hitzig, 1870; Kringelbach et al., 2007). A primary focus of this work has been to establish neural modifications that relieve specific clinical disorders. Conditions such as Parkinson's disease, epilepsy, or depression, which often appear resistant to pharmacological intervention, have shown major improvement after treatment with invasive electrical stimulation techniques(Kringelbach et al., 2007). The success of these invasive interventions has generated interest in the use of transcranial magnetic stimulation (TMS), a comparatively non-invasive technique(Barker et al., 1985). However, the effectiveness of TMS in therapeutic applications is not clear, and this emphasizes the need for a basic understanding of TMS mechanisms (Burt et al., 2002; Couturier, 2005; Fregni et al., 2005; George et al., 1996; Gross et al., 2007; Martin et al., 2003).
The major challenge facing the therapeutic use of TMS, or any brain stimulation technique, is the difficulty in predicting how underlying neural circuits will be altered by the application of electrical fields. This problem is inherently complex as the cumulative effect of stimulation depends on numerous factors. These may include: the structure of the targeted neural circuit, the profile of neural activity during application, the responses of different cell classes (e.g., excitatory vs. inhibitory; projecting vs. local neurons), the resulting biochemical or structural modifications of synaptic connections, and the possible alterations of neuromodulatory inputs. Combined with these biological factors are also a number of flexible stimulation parameters, such as duration, frequency, intensity and electric field orientation. Each of these variables has been found previously to alter the outcome of TMS application(Berardelli et al., 1998; Chen et al., 1997; Pascual-Leone et al., 1998). Given the dependence of the effects of TMS on physiological state, brain region, and stimulation paradigms, it is difficult to identify general principles by which brain stimulation affects neural function.
It is not surprising, therefore, that the literature in this field contains some contradictory and potentially confusing findings. For example, identical stimulation parameters can result in neuronal activation, suppression, or both, depending on the brain region(Paus, 2005). In addition, substantial inter-subject variation has been noted both within healthy populations(Cahn et al., 2003) and with respect to patient populations(Brighina et al., 2002). Furthermore, even within the same individual, the effects of TMS appear to depend on the initial cortical activation state (for review, see Silvanto and Muggleton, 2008). In these latter experiments, TMS produces different perceptual or behavioral outcomes that may depend on the excitability levels of specific neuronal populations(Silvanto and Muggleton, 2008). The apparent subtlety and complexity of the physiological effects of TMS necessitates empirical investigation in order to understand the stimulation-induced neural activity patterns.
The shortage of available neural data describing the effects of TMS (e.g., see Allen et al., 2007; de Labra et al., 2007; Moliadze et al., 2005; Moliadze et al., 2003), coupled with a potentially broad use of TMS, motivates the investigation we describe here. We have conducted neurophysiological recordings of spiking activity and local field potentials (LFPs) in the visual cortex of anesthetized cats before, during, and after TMS application. A well-controlled study of TMS in an appropriate animal model is a necessary first step toward a basic understanding. In a previous report, we described primary neural responses to short TMS pulse trains and their relation to hemodynamic signals(Allen et al., 2007). In the current study, we undertake an extensive analysis to provide insight into the effects of TMS on single neuron and population activity. We describe the variability of responses to TMS and find evidence for two qualitatively different response patterns which are characterized by the presence or lack of spontaneous discharge following stimulation. A portion of this variability can be explained by state-dependent effects, in which the post-TMS response depends on pre-TMS activity levels.
Results
We recorded single unit and local field potential (LFP) responses at 47 sites in primary visual cortex of the anesthetized cat (n=5 animals). Single units were classified as simple (n = 17) or complex (n = 30), using the ratio of the first harmonic to the average firing rate(Skottun et al., 1991). Recordings were made with either posterior or superior positioning of a figure-eight TMS coil (Fig. 1A). We find no significant differences in the neural responses to TMS between electrode-coil configurations or simple and complex cell classes (rank sum test, p > 0.2 for all comparisons), and therefore the data are pooled for all analyses.
Figure 1. TMS coil position and experimental paradigm.
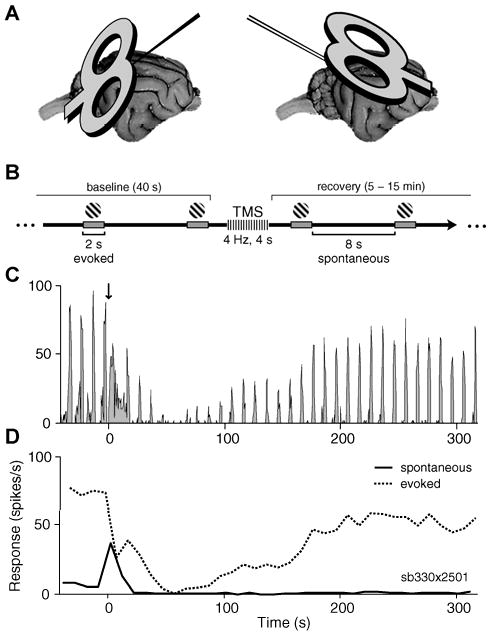
A) Illustration of the two coil-electrode configurations. At 28 sites in 3 cats, the coil was positioned posterior to the visual cortex and angled towards the horizontal plane (left). Penetrations were made with a carbon fiber electrode at an angle of P45, M0. At 19 recording sites in 2 cats, the coil was positioned obliquely near the transverse plane, superior to the visual cortex (right). Penetrations were made with a dual tungsten array (inter-electrode spacing of ∼400 μm) at an angle of A45, M0. For both configurations, the midpoint of the coil was centered on the primary visual cortex craniotomy and was located between 1 and 2 cm from the skull. No significant differences between the neural responses to TMS were found for the different electrode-coil configurations (rank sum test, p > 0.2), thus these data were pooled in all analyses. B) Timeline of a single trial. A visual stimulus (high contrast drifting grating) was presented repeatedly for 2 s with an inter-stimulus interval of 8 s. After a baseline period (40 s), a short TMS pulse train (1– 4 s, 2 – 8 Hz, 100% stimulator intensity) was applied during an inter-stimulus interval. Single-unit and LFP data were collected during response recovery (typically 5-15 min). C) Peri-stimulus time histogram (PSTH) of spiking activity during a sample trial. Downward arrow at time zero denotes the application of a 4 Hz, 2s TMS pulse train. In this and all subsequent PSTHs the bin size is 0.5 s. D) Firing rate for the same trial as shown in (C), with activity separated into spontaneous and evoked components. The evoked response (dotted line) represents average activity during stimulus presentations, while the spontaneous component (solid line) indicates activity that occurred between stimuli.
Experimental paradigm
Each trial in our experimental paradigm (Fig.1B) consisted of a baseline period (40s), application of a short TMS pulse train, and a post-TMS recovery period lasting from 5 to 15 minutes. TMS stimulation parameters were varied in frequency (1-8Hz) and duration (1-4s) on separate trials, with constant intensity at 100% stimulator output. Throughout each trial, a visual stimulus optimized to drive the cell was presented repeatedly for 2 s at 8 s intervals.
As reported previously(Allen et al., 2007), we observe two primary effects of TMS. These include a transient elevation of spontaneous activity immediately following TMS and a prolonged reduction in visually evoked activity that lasts for several minutes (Fig.1C). These different response components are seen clearly when the activity levels during and between presentations of visual stimuli are separated into evoked and spontaneous firing rates, respectively (Fig.1D). Additional experiments without interleaved visual stimuli showed comparable effects of TMS on spontaneous activity (Supplementary Fig. 1).
Response Variability
We analyzed the trial-by-trial variability of two TMS response components. The “spontaneous component” reflects the response to TMS itself. The “evoked component” reflects the effect of TMS on stimulus processing. Although the effects of TMS on these components are generally robust, we have observed considerable variability across both cells and trials. Figure 2 shows peri-stimulus time histograms (PSTHs) for four representative cells (A-D), each tested in two separate trials. These data represent the full range of response patterns we have observed and suggest an interesting distinction between TMS response components: variability across trials appears greater for spontaneous compared to visually evoked responses.
Figure 2. Examples of variability in TMS responses.
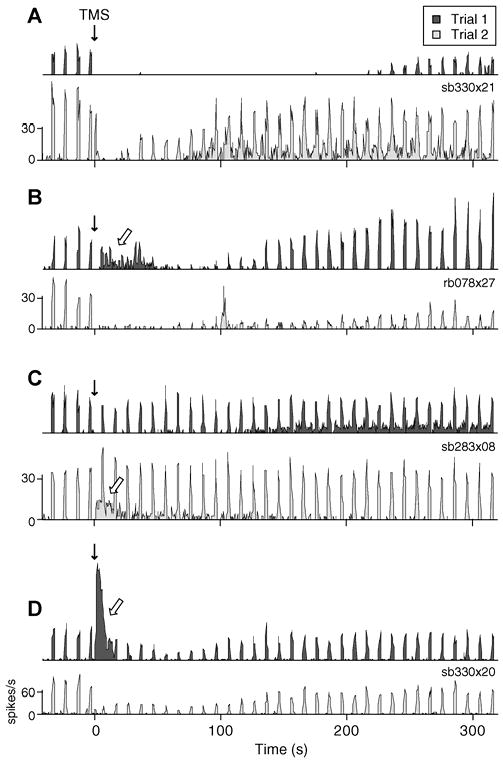
A-D) PSTHs of two sample trials with identical TMS parameters for 4 different cells. Downward solid arrows denote application of the TMS pulse train. Open arrows signify substantial spontaneous discharge following TMS. The stimulation parameters used in each example are as follows: (A) 4 Hz, 2s; (B) 8 Hz, 4 s; (C) 4 Hz, 4 s; and (D) 4 Hz, 2 s. Evoked response components within single cells are more similar than those between cells. For example, some neurons reliably show moderate (D) or strong (B) reduction of evoked spiking following a TMS pulse train, while others consistently exhibit little alteration in stimulus evoked activity (C). In contrast, spontaneous responses are extremely variable across identical trials within the same cell. In many instances (B-D), neurons display substantial spontaneous discharge on one trial, but a complete absence of spontaneous firing on another.
To quantify the variability of response components, we examined the relative standard deviation (RSD) of changes in spontaneous and evoked spiking activity in the first minute following TMS. This variability measure is similar to the Fano Factor (Stevens and Zador, 1998) and accounts for differences in response amplitude by normalization of the standard deviation by the mean response (see Methods). The RSD was calculated over trials with identical stimulation parameters at a given site (n=23 sets of trials). Trial-to-trial variability in the spontaneous response (median RSD=1.71) is significantly greater than that of the evoked (median RSD=0.62, Wilcoxon signed-rank test paired by trial, p<0.0005). We also compared the median RSD for trials within cells to the median RSD for equivalent trials across cells (see Methods). For the evoked response, trial variability is significantly greater across cells than within the same cell (permutation test, p<0.01). The same is not true for the spontaneous response component (permutation test, p=0.51). These results indicate not only greater trial-to-trial variability in spontaneous activity, but also a lack of evidence for a characteristic spontaneous response to TMS that could distinguish one cell from another.
Differences between spontaneous and evoked components are further evident when we examine trends in TMS responses over time. Throughout experiments, we observed that cells appeared more likely to exhibit spontaneous discharge on earlier trials. An example of this trend is shown in Figure 3A, which displays the PSTHs of 7 consecutive trials from a single-unit. Pronounced spontaneous spiking is evident in trials 1 through 4, but is considerably reduced or absent in trials 5 through 7 (Fig.3A-B). Analyzing all trials (grouped by cell and stimulation parameters), we find a weak, though significant, negative correlation between trial order and the magnitude of post-TMS spontaneous spiking (Fig. 3C, r=0.26, p <0.01, t-test). No similar relationship is found for evoked responses (r=0.07, p=0.46). A significant difference between spontaneous and evoked response trends (p < 0.01, one-tailed z - test after Fisher's transformation) argues against a simple decrease in TMS efficacy over time. Instead, these results suggest the presence of long-term or cumulative effects of TMS, which appear unique to spontaneous responses. The source of this long-term effect remains to be determined, but there is a suggestion of a sensitivity of the spontaneous response to baseline network properties (see below).
Figure 3. Trend in spontaneous response to TMS over time.
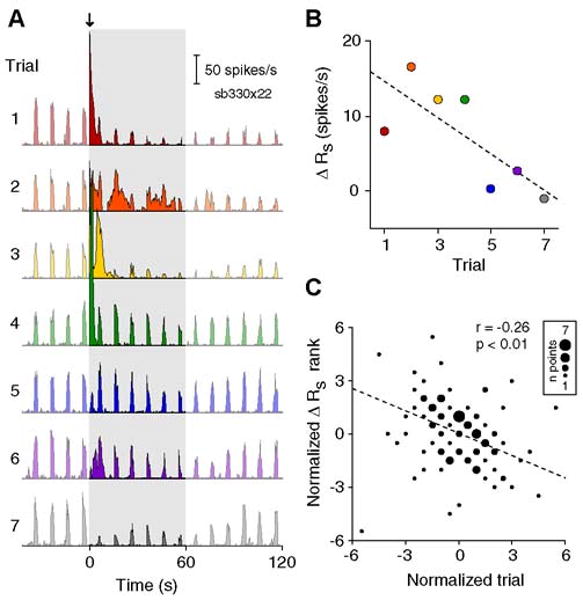
A) PSTHs of 7 consecutive trials from a single cell. A 4 Hz, 2s TMS pulse train (downward arrow) was applied in each trial. PSTHs are truncated at 2 minutes to highlight spontaneous activity in the first 60 seconds following TMS (shaded area). Colors in panels (A) and (B) represent trial number. B) Scatterplot of trial number versus the change in spontaneous firing rate (ΔRs) for the set of trials shown in (A). ΔRs is calculated as the difference between the average spike rate in the first minute following TMS and the average value during the baseline period. Dashed line indicates the least-squares fit to the data. C) Scatterplot of normalized trial number versus normalized ΔRs for 23 sets of data (n = 112 total trials). For each set of data, the values for ΔRs and trial number were transformed into their respective ranks then normalized by subtracting the mean rank. Symbols of different sizes are used to indicate the number of the trials at the same rank coordinates. Trial number and the spontaneous response exhibit a weak negative correlation (r = -0.26, p <0.01, t test). No relationship is found between trial number and the evoked response (r = 0.07, p = 0.46, t test).
Bursting vs. non-bursting response patterns
The observation of seemingly all-or-none spontaneous responses motivated the division of trials into two qualitatively different groups, which we characterized as bursting (B) or non-bursting (NB). Trials in which the spontaneous firing rate in the first minute exceeded the baseline rate by two or more standard deviations were classified as B (n=60/161). Trials showing a decrease or no change were classified as NB (n=56/161). The remaining 45 trials exhibited an intermediate response (i.e., an increase of less than two standard deviations) and were not included in either group. Both B and NB trial types are observed in all animals and at virtually every recording site (100% when considering sites with at least 4 trials). There are no significant differences with regard to the proportion of trials at specific stimulation frequencies or durations (X2 test, p=0.83 and p=0.77, respectively). Additionally, simple and complex cell classes exhibit similar proportions of B and NB trials (X2 test, p=0.71). Thus, the division of trials reflects the presence of distinct response patterns across trials, rather than across stimulation parameters or cells.
To characterize the different responses of B and NB trials, we first examined the distributions of inter-spike intervals (ISIs) in each group. Figure 4 displays the logarithmic ISI histograms of spontaneous spikes for B (left) and NB (right) trials. The histograms of both response types are bimodal with distinct peaks at short and long ISIs, a pattern frequently observed for cortical neurons (e.g., Reich et al., 2000). Prior to TMS (Fig.4A,top), the ISI peaks of B and NB trials are similarly located at roughly 3ms and 200ms (determined by fitting a mixture of Gaussians). Following TMS (Fig.4A,middle), the short ISI peak is unchanged for both trial types. ISIs of this length may reflect the small refractory period between action potentials (Izhikevich, 2006), suggesting that TMS does not alter this intrinsic cellular property. In contrast, TMS produces a substantial leftward shift in the long ISI peak of B trials, while the NB ISI distribution remains relatively unaltered. This shift is most prominent in the first 30s post-TMS and there is a gradual recovery to baseline over 1 to 2 minutes (Fig.4B). The spontaneous discharge induced by TMS, therefore, appears to occur primarily at intervals of 20-40ms, or 25-50Hz. This frequency range corresponds to gamma band rhythms and is believed to involve activation of local sensory microcircuits, rather than a single cell(Liu and Newsome, 2006; Siegel and Konig, 2003). Interestingly, the disruption of spike intervals appears limited to spontaneous activity, as the ISI distributions of evoked spiking were relatively unaffected (see Supplementary Fig. 2).
Figure 4. Distributions of inter-spike intervals (ISIs) before and after TMS.
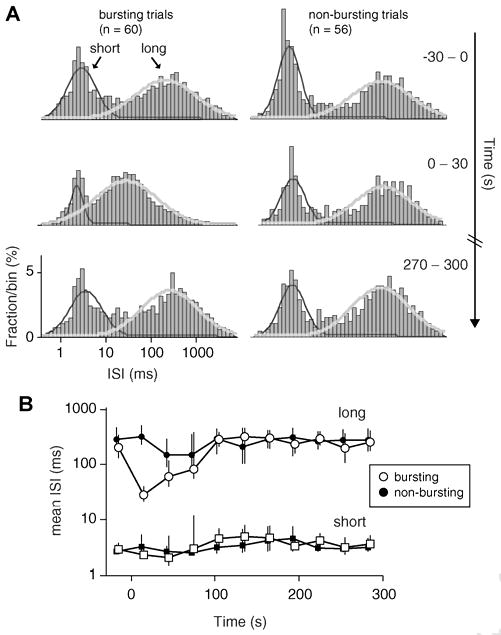
A) Log ISI histograms of B trials (left) and NB trials (right) were constructed from spontaneous spikes (spikes occurring between presentation of visual stimuli) in 30 s windows. Each histogram spans from 0.4 ms to 8 s in 90 logarithmically spaced bins. Histograms are displayed for the 30 s prior to TMS (top), the 30 s immediately following TMS (middle) and a 30 s window occurring roughly 5 minutes after TMS. For all time periods, the histograms exhibit two separate ISI peaks, the locations of which are estimated by fitting a mixture of Gaussians. Superimposed over the histograms are the best-fit Gaussians for short (dark grey) and long (light grey) ISI peaks. B) Locations of ISI peaks at short (squares) and long (circles) intervals for all time periods. Open symbols designate data for B trials, while filled symbols represent NB trials. Error bars indicate 95% confidence intervals, as estimated with a bootstrap resampling procedure (n = 1000 resamples) (Efron and Tibshirani, 1994).
Differential responses of B and NB groups are also evident in the average time courses (Fig.5). By definition, B trials exhibit a large increase in spontaneous spiking, while NB trials show a small though significant and long-lasting reduction (Fig.5A-B). A similar response pattern for LFP power is evident in higher frequency bands (∼30-150Hz), where TMS induces an increase in B trials and a prolonged decrease in NB trials (Fig.5C-D). The similarity of LFP and spiking response patterns may appear trivial given the typically close association of these signals(Heeger and Ress, 2002). However, it is important to note that LFPs were classified based on single-unit spiking recorded at the same site. Since LFPs presumably reflect the aggregate activity of cells near the electrode tip(Logothetis et al., 2007; Mitzdorf, 1985), the differences in high frequency LFP power suggest that neuronal responses to TMS can be relatively homogenous within a local area (see also Spatial correlation and coherence).
Figure 5. Response time courses for bursting (B) and non-bursting (NB) response patterns.
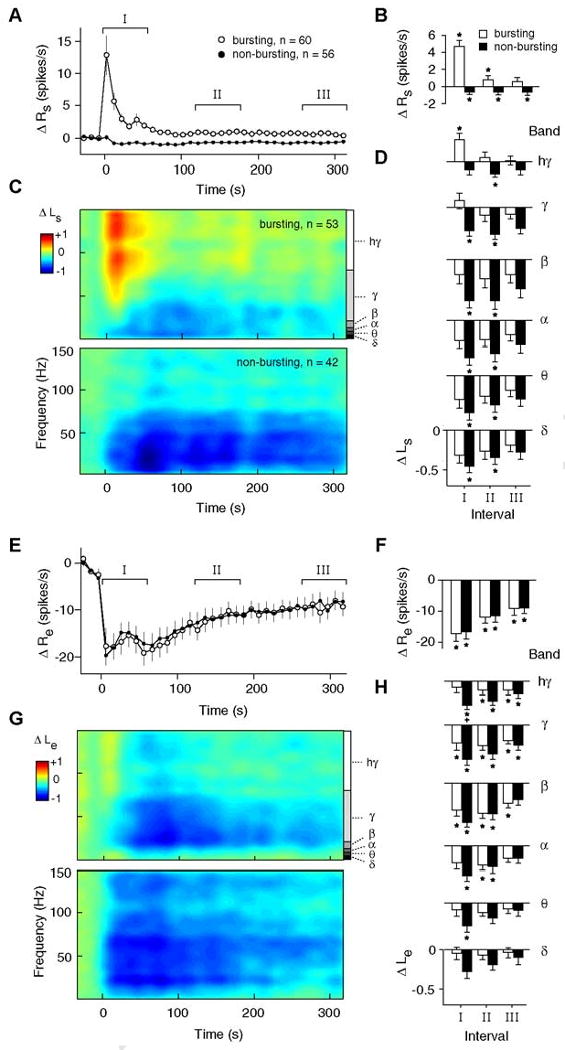
A) Average time courses of the change in spontaneous spiking activity from baseline (ΔRs) for B (open symbols) and NB trials (filled symbols). Error bars signify ±1 s.e.m. B) Average changes in ΔRs for time intervals I, II, and III, as denoted in panel (A). Intervals I, II, and III correspond roughly to the first, third and fifth minute following TMS, respectively. Asterisks indicate a significant difference from baseline values (p<0.05, sign-rank test, corrected). C) Spectrograms showing the change in spontaneous LFP power (ΔLs) for B (top) and NB (bottom) trials. At each time point, ΔLs is calculated as a log ratio relative to the baseline spontaneous LFP power. Trials were classified as B or NB based on the activity of the single-unit recorded at the same site. In these and subsequent spectrograms, data are color-mapped symmetrically around zero such that positive values appear as warm colors, negative values appear as cool colors, and zero maps to green. D) Average changes in ΔLs for time intervals I, II, and III as a function of different frequency bands. LFP bands, notated in panel (C), are defined as follows: Δ (delta; 1-4 Hz), θ (theta; 4-8 Hz), α (alpha; 8-12 Hz), β (beta; 12-20 Hz), γ (gamma; 20-80 Hz), hγ (high gamma; 80-150 Hz). E-H) Average time courses of changes in evoked spiking (E, F) and evoked LFP power (G, H), displayed in the same format as (A-D). Note that in (E), spontaneous activity directly preceding the presentation of a visual stimulus has been subtracted from the evoked response (see Methods). In panel (H), a plus sign indicates a significant difference between B and NB responses (high gamma band, p < 0.05, rank-sum test, corrected). This difference likely indicates “contamination” from spontaneous activity. Since spontaneous LFP activity is present throughout the evoked response, elevations in this activity result in a smaller evoked decrease for B trials.
In the lower frequency LFP bands, B and NB responses are quite similar. Both groups show strong decreases in power that persist for longer than 5 minutes after TMS application (Fig.5D,bottom rows). The distinction between responses in the low and high frequencies may be related to the different functional roles attributed to specific brain rhythms(Belitski et al., 2008; Logothetis, 2008). For example, theta band activity is hypothesized to coordinate activity across distant cortical areas(Canolty et al., 2006), while gamma activity is thought to represent the synchronous processing of local neurons(Engel et al., 2001; Liu and Newsome, 2006).
We next examined differences in evoked responses between B and NB groups. One might expect the presence or absence of strong spontaneous discharge to affect TMS-induced changes in stimulus-evoked activity. For example, strong discharge could fatigue the cells resulting in a more pronounced reduction in evoked responses. Conversely, spontaneous discharge could signify strong activation of a local neural circuit which might facilitate evoked activity and produce a more moderate decrease, or even increase, in the stimulus-evoked response. The average time courses of evoked spiking, however, support neither of these scenarios. As shown in Figure 5E, the single-unit responses of B and NB trials are essentially identical. The effect of TMS on evoked LFPs is largely similar to that for spikes, in that both B and NB groups show decreases in power across nearly all frequencies (Fig.5G-H).
The similar time courses of evoked activity for B and NB trials (Fig.5E-H) contrast sharply with the dissimilar response pattern for spontaneous activity (Fig.5A-D). It therefore appears that spontaneous and evoked response components are not inherently interrelated. The lack of correlation between changes in spontaneous and evoked spiking also supports this notion (r=0.042, p>0.5, t-test, n=161 trials).
State-dependent effects
Thus far we have characterized the substantial variability of TMS-induced neural responses. We now investigate possible factors that may explain this variability. An intriguing possibility is that the effect of TMS in some way depends on the initial physiological state of the cortex. Numerous studies have noted robust differences when applying TMS during distinct brain states, for example during different levels of visual stimulation(Silvanto et al., 2007) or spatial attention(Bestmann et al., 2007). We have examined whether natural fluctuations in cortical activity could yield similar results by analyzing post-TMS responses as a function of pre-TMS activity levels. In these analyses, we use a partial correlation approach (see Methods) which controls for the possible influence of additional factors. These factors include the mean amplitude of pre-TMS spontaneous activity, TMS stimulation parameters, and trial number. Therefore, reported correlations are those that remain after these factors have been linearly regressed from both pre- and post-TMS variables.
One possible metric of cortical activity-state is the responsiveness of cells to visual stimulation. We examined the distributions of pre-TMS evoked spiking responses for B and NB groups (Fig.6A). Though the distributions are broad and overlap considerably, trials classified as B are slightly more responsive to visual stimuli compared to those classified as NB. This difference is small, but significant (B: 35±19 spikes/s, NB: 28±17 spikes/s, mean ± std; p<0.05, Wilcoxon rank-sum test). A regression analysis including all trials (n=161) indicates the same relationship: pre-TMS evoked spiking is positively correlated with TMS-induced spontaneous spiking (Fig.6B, r=0.30, p<0.0001).
Figure 6. Influence of baseline variables on responses to TMS.
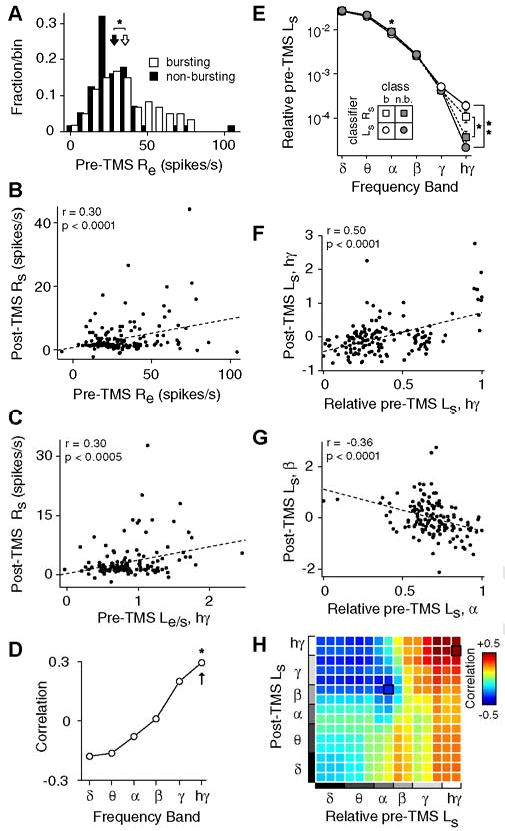
(A) Distribution of stimulus-evoked responses (Re) during the baseline period for B (open, n = 60) and NB (filled, n = 56) trials. The average Re of B trials (mean ± std: 35 ± 19 spikes/s, open arrow) is slightly greater than that of the NB trials (28 ± 17 spikes/s, filled arrow), leading to a significant difference between the distributions (p<0.05, rank-sum test). B) Scatterplot of baseline evoked activity (Re) and post-TMS spontaneous activity (Rs) for all trials (n = 161). Pre-TMS evoked activity and post-TMS spontaneous activity are significantly correlated (r = 0.30, p<0.0001, t test). In this and subsequent panels, ‘post-TMS’ variables are defined as the average value over the first minute following TMS (i.e., interval I). In addition, displayed correlations cannot be explained by differences in pre-TMS spontaneous activity, TMS stimulation parameters, or trial number, as factors potentially contributing explanatory power have been linearly regressed from both variables using partial correlation (see Methods). C) Scatterplot of pre-TMS evoked LFP high gamma power relative to spontaneous power (Le/s, hγ; see Methods) and post-TMS spontaneous spiking (Rs) for trials with single-unit and LFP data (n = 138). D) Pearson correlation coefficients between baseline Le/s and post-TMS spontaneous spiking for all LFP frequency bands. Asterisk indicates a significant correlation (p<0.05, t test, corrected). Arrow denotes the coefficient for the data displayed in panel (C). E) Power of baseline spontaneous LFPs as a function of trial type. Here, the LFP power in each band is relative to the total spectral power (see Methods). Trials were classified as B or NB both by spiking activity (squares) and LFP power (circles). Single and double asterisks denote a significant difference between groups at p < 0.05 and p < 0.0005 criteria, respectively (rank-sum test, corrected). F,G) Scatterplots of the relative baseline spontaneous LFP power and the post-TMS spontaneous LFP power (n = 142 trials). A significant positive correlation is found between baseline high gamma power and post-TMS high gamma power (F). A significant negative correlation is found between baseline alpha power and post-TMS beta power (G). H) Correlation coefficients between the relative pre-TMS spontaneous power and the post-TMS spontaneous power for all frequency band combinations. To improve resolution beyond the six traditional bands (i.e., delta through high gamma), we divided the full frequency range (1 to 150 Hz) into 15 logarithmically-spaced bins. The (ij)th element in the matrix corresponds to the correlation coefficient between the relative Pre-TMS power in the ith frequency bin, and the post-TMS Ls in the jth frequency bin. Elements outlined in black correspond to the data displayed in panels (F) and (G).
To examine visual responsiveness at the population level, we performed a similar regression analysis using the pre-TMS stimulus-evoked LFPs. As shown in Figure 6C, the magnitude of pre-TMS evoked high gamma power, relative to the spontaneous power in the same band, is significantly correlated with post-TMS spontaneous firing rate (r=0.30, p<0.0005, t-test). While a positive correlation is also observed for gamma band power, the lower frequency bands instead exhibit negative correlations (Fig.6D). This finding is consistent with previous studies showing a suppression of low frequency power during stimulus presentation and a general anticorrelation of power between lower and higher bands(Fries et al., 2001; Liu and Newsome, 2006; Niessing et al., 2005). Overall, these results indicate that strong cortical responsiveness to visual stimuli increases the likelihood of spontaneous discharge following TMS.
A second possible metric of cortical activity-state is the level of spontaneous, or ongoing, activity. Theoretically, both the baseline spontaneous spike rate and the baseline spontaneous LFP power can be used to independently assess cortical activity-state. However, because cortical spontaneous spike rates are typically low (1.4±1.8 spikes/s in this sample), they are not well-suited for a correlation analysis. Thus, we focus our analysis on the relative LFP power during the pre-TMS period (see Methods). The mean spontaneous LFP power spectra for B and NB groups are shown in Figure6E. In this analysis, LFP trials were classified as NB or B using either post-TMS spontaneous spikes or post-TMS spontaneous LFP power. In both cases, trials were classified as B if TMS induced an increase of at least 2 standard deviations above baseline spontaneous activity and as NB if there were a decrease or no change. Regardless of the classification scheme, B trials are associated with greater power in the high gamma band of pre-TMS spontaneous LFPs compared to NB trials (p<0.05 for spikes-classifier, p<0.0005 for LFP-classifier, Wilcoxon rank-sum test, corrected). At lower frequency bands (theta and alpha), B trials have slightly less power than those classified as NB. Though this difference is difficult to see on the log-scale of Fig. 6E, it is statistically significant in the alpha band (p< 0.05 for LFP-classifier, Wilcoxon rank-sum test, corrected).
To better understand the dependence of post-TMS spontaneous activity on baseline LFP power, we calculated the correlation coefficients between these variables for all pairs of frequency bands. This analysis results in a correlation matrix, shown in Figure 6H. Two general features are apparent in this matrix. First, correlations are positive at high frequencies of baseline LFP power, but negative for low frequencies. Examples of positive and negative correlations are shown in Figures 6F and 6G, respectively. Thus, greater relative power in the gamma and high gamma bands during the pre-TMS baseline predicts larger power in post-TMS spontaneous LFPs (e.g., Fig.6F). In contrast, greater relative baseline power in lower bands (delta to alpha) predicts smaller post-TMS power (e.g., Fig.6G). The change in correlation direction, which occurs in the lower beta band (∼15Hz), demonstrates the general anti-correlation between low and high frequency power, as noted previously(Fries et al., 2001; Liu and Newsome, 2006; Niessing et al., 2005; Romei et al., 2007).
A second important aspect of the correlation matrix is the presence of relatively stronger correlations at higher frequencies of the post-TMS spontaneous LFPs. Thus, pre-TMS spontaneous LFP power is more predictive of post-TMS changes in high frequency power than those at low frequency. This trend is not surprising given that the increased variability associated with post-TMS spontaneous discharge appears primarily in the gamma and high gamma bands (Fig.5C). Taken together, these results suggest the following relationship. Application of TMS during a high activity-state, as assessed with responsiveness to visual stimuli or the ongoing level of activity, is more likely to result in spontaneous discharge than application of the same pulse train during a low activity-state.
The above results describe relationships of state-dependence between pre-TMS activity and post-TMS spontaneous activity. We have also performed similar analyses for post-TMS evoked activity. Changes in evoked activity show opposite trends compared to spontaneous activity: greater baseline spontaneous power in high LFP bands (alpha and above) is associated with lower post-TMS evoked power (i.e., stronger reductions in the evoked activity). The direction of the association switches for lower bands of pre-TMS spontaneous LFPs, indicating negative correlations. The respective positive and negative correlations are present across all bands of the post-TMS evoked LFP power, though correlation coefficients are slightly greater in the higher bands. However, it should be noted that the magnitudes of these correlations are considerably weaker than those observed for post-TMS spontaneous activity and do not reach significance after correction for multiple comparisons.
Spatial correlation and coherence
In some experiments (n=34 trials in 2 animals), we used a dual-electrode array to collect data simultaneously from two cortical sites spaced roughly 400μm apart (Fig.7). These data permit us to ask whether neural activity in different cortical locations exhibit similar responses to TMS. In general, responses on the two electrodes are similar (Fig.7A), though there are differences with regard to response magnitude, particularly in high frequency bands (Fig.7B). Inter-electrode correlations consequently demonstrate a strong dependence on frequency band (Fig.7D). Changes in spontaneous LFPs (Fig.7C-D) are significantly correlated at low frequencies (delta through beta, r>=0.44, p<0.05, corrected), but not at higher frequencies. This trend is consistent with previous work demonstrating a stronger spatial coherence at lower frequencies(Destexhe et al., 1999). Evoked LFP responses reveal similar frequency dependence (Fig.7D), though overall correlations are weaker. This is likely due to the fact that visual stimuli were only optimized for neurons at one site, and did not reliably elicit neural responses on both electrodes. Thus, despite the spatially diffuse electric field produced by the TMS coil(Salinas et al., 2007), these inter-electrode correlations indicate that the spontaneous response component is highly local in nature. Response homogeneity may be limited to a relatively small area (<400μm).
Figure 7. Correlations between TMS responses on different electrodes.
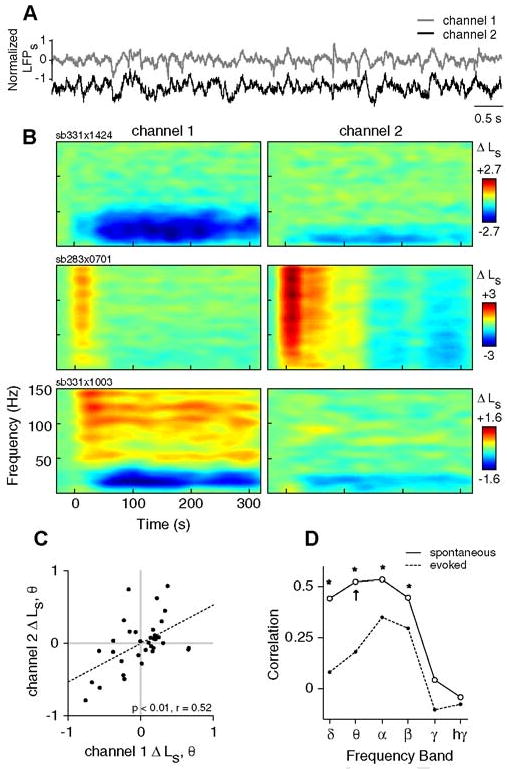
A) Sample trace showing 8 s of spontaneous LFPs recorded from two different electrodes placed approximately 400 μm apart in area 17. Channel 1 denotes the electrode at which single-unit activity is isolated. B) Example spectrograms from 3 different TMS trials showing changes in spontaneous LFP power (ΔLs) on channel 1 (left) and channel 2 (right). The TMS parameters used in each trial are as follows: sb331×1424, 8 Hz, 4 s; sb283×0701, 4 Hz, 4 s; and sb331×1003, 8 Hz, 4 s. C) The changes in spontaneous theta band power (ΔLs, θ) on channels 1 and 2 are significantly correlated (n = 34, p< 0.0001, t test). Here, ΔLs, θ is calculated as the change in theta band power between the first minute post-TMS (interval I) and the pre-TMS baseline period. D) Pearson correlation coefficients for Δ Ls between channels 1 and 2 over all frequency bands. Asterisks indicate significant correlations (p< 0.05, t test, corrected). Arrow denotes the correlation coefficient for the data shown in panel (C). Note that possible confounds of these correlations (i.e., stimulation parameters and trial number) have been removed through partial correlation (see Methods).
The simultaneous two-channel LFP data also allow us to investigate the effect of TMS on the timing of signals between different populations of neurons. Fine temporal relationships between the phases of neural signals have been associated with attention(Buschman and Miller, 2007; Fries et al., 2001; Saalmann et al., 2007), plasticity(Holscher et al., 1997; Wespatat et al., 2004), and memory(Buzsaki and Draguhn, 2004) and are often interpreted as indicators of functional “connectivity” between locations(Bruns, 2004; Lachaux et al., 1999; Pereda et al., 2005). Here, we evaluated inter-electrode phase synchrony using a common measure of spectral coherence. Because coherence is sensitive to both amplitude and phase relationships, we performed an additional inter-electrode analysis examining only phase locking values (see Methods). The results for these analyses are qualitatively similar, and we therefore describe results only for coherence.
Figure 8A shows the baseline inter-electrode coherence prior to TMS. The trend of coherence over different frequency bands and the significant elevation of high frequency coherence during evoked responses (p<0.005, corrected) are consistent with findings from previous studies (e.g., Henrie and Shapley, 2005). For TMS-induced responses, spontaneous LFPs (Fig.8B,top) at lower frequencies (∼8-20Hz) exhibit a strong decrease in coherence that slowly decays (Fig.8C,left). At high frequencies (>80Hz), we observe instead a slight increase in coherence (Fig.8C,left). Changes in evoked coherence (Fig.8B,bottom) are very similar, though evoked activity shows a more pronounced increase in high gamma coherence that persists for several minutes after TMS (Fig.8C,right).
Figure 8. Effect of TMS on spatial coherence.
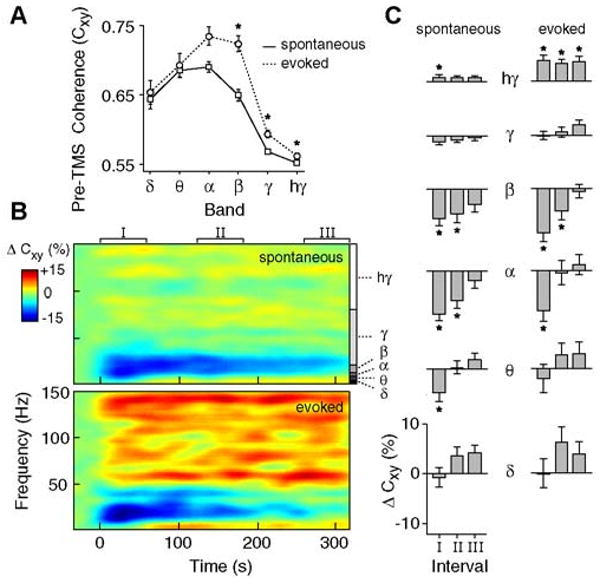
A) Average levels of inter-electrode LFP coherence (Cxy) during the pre-TMS baseline period for spontaneous (solid) and evoked (dotted) activity (n = 34 trials). Error bars signify ±1 s.e.m. Asterisks indicate significantly greater coherence during evoked activity (sign-rank test, p<0.05, corrected). B) Spectrograms displaying the change in inter-electrode coherence (ΔCxy) for spontaneous (top) and evoked (bottom) LFPs. ΔCxy is expressed as a percent change from baseline. C) Average ΔCxy for different time intervals and frequency bands. Significant changes in spontaneous (left) and evoked (right) coherence are denoted with asterisks (p<0.05, sign-rank test, corrected).
We note that the effects of TMS on inter-electrode LFP-LFP spectral coherence and phase-locking are similar to those found in our previous report on spike-LFP synchrony(Allen et al., 2007). The prior analysis examined the relationship between spike times and phases of the LFP oscillations recorded at the same electrode. Despite different types of data and methodology, both analyses indicate that TMS induces desynchronization and hypersynchronization at lower and higher frequencies, respectively. These results demonstrate the capacity of TMS to alter signal timing between neural populations and suggest that TMS may exert strong effects on functional processes that depend on spike timing or phase locking.
Discussion
Our current study has evaluated the variability in neuronal responses following application of short TMS pulse trains during the resting-state. We find evidence for two divergent response patterns, defined by the presence or absence of burst firing after stimulation. Importantly, this effect is shown to be state-dependent: higher pre-TMS activity predicts greater post-TMS activity.
Variability in the response to electrical stimulation is a well known phenomenon, observed both behaviorally (Ridding and Rothwell, 2007) and neurophysiologically(Kringelbach et al., 2007). In our data, variability is principally seen on a trial-to-trial basis in the degree of spontaneous burst firing. The effect of TMS on spontaneous activity is the focus of a considerable amount of TMS literature (e.g., Bestmann et al., 2008; Brighina et al., 2004; Hallett, 2007; Ridding and Rothwell, 2007; Romei et al., 2007; Sauseng et al., 2008; Silvanto et al., 2007; Van Der Werf et al., 2006). For example, TMS studies of phosphene or muscle twitch thresholds are frequently used to assess cortical excitability (Bestmann et al., 2007; Brighina et al., 2002; Hallett, 2007; Huang et al., 2005; Ridding and Rothwell, 2007; Stewart et al., 2001). These overt behavioral responses are thought to be analogues of TMS-induced spontaneous bursting. Stimulation-induced overt responses have been linked to direct activation of motor or sensory circuits(Tehovnik et al., 2006) and even single neurons(Houweling and Brecht, 2008; Huber et al., 2008). A hallmark of these threshold studies is the substantial trial-to-trial variability, in which overt responses are observed in some trials but not others. Our neurophysiological findings provide a close parallel to the robust variability noted in these behavioral studies.
An additional important feature of threshold studies is that pre-existing activity-levels can modulate the stimulation intensity required to evoke an overt response. For example, motor or phosphene thresholds have been shown to be modulated by spatial attention(Bestmann et al., 2007), motor training(Butefisch et al., 2000), drug application(Oliveri and Calvo, 2003; Ziemann et al., 2002), epilepsy(Theodore, 2003), and migraine(Ambrosini et al., 2003). Our finding that the post-TMS burst response depends on pre-TMS activity levels is consistent with the hypothesis that changes in baseline activity-levels underlie these behavioral modulations. Notably, recent studies have begun to investigate the cortical topography of such state-dependent responses. Using concurrent TMS-fMRI, investigators have demonstrated that distinct activation patterns are produced depending on the behavioral task to which stimulation is paired(Ruff et al., 2006; Sack et al., 2007).
In addition, the effect of TMS on spontaneous activity may be relevant to clinical applications. Clinical disorders are generally characterized by abnormal activity revealed during an ongoing state. The logic of TMS clinical treatment is that it causes disruption of ongoing activity of abnormal circuits (Hallett, 2007; Ridding and Rothwell, 2007). For example, electroconvulsive shock therapy utilized extensively for depression is thought to operate by this principle (Lisanby and Belmaker, 2000). Our finding that TMS disrupts the temporal structure of spatially remote sites is consistent with the hypothesis that TMS can be used to progressively alter abnormal neuronal communication.
It is important to consider the circuit and cellular mechanisms that underlie the spontaneous response and associated state-dependent effects. It is likely that TMS application directly induces activating current in a subset of cortical cells(Moliadze et al., 2003; Patton and Amassian, 1954). This activation can elicit reverberating excitatory potentials in post-synaptic cells, producing a persistent bursting response that outlasts the TMS pulse train(Patton and Amassian, 1954; Terao and Ugawa, 2002). As our data indicate, the spontaneous bursting response involves neural recruitment throughout the local microcircuit, and is therefore subject to the balance of excitatory and inhibitory synaptic activity. It is feasible that higher baseline excitability leads to recurrent excitation (i.e., bursting) upon application of the TMS pulse train, while lower baseline excitability signifies a relatively greater level of inhibition that dampens recurrent excitation and prevents burst firing. This explanation of state-dependence is consistent with the current results and with those of numerous threshold studies(Bestmann et al., 2007; Butefisch et al., 2000; Oliveri and Calvo, 2003; Romei et al., 2007; Ziemann et al., 2002).
In contrast to the state-dependence observed for spontaneous activity, we found little evidence for state-dependent evoked activity. This may relate to different mechanisms underlying the spontaneous and evoked responses (see below). Weak evoked state-dependence may also be due to the specifics of our stimulation paradigm. TMS was applied only during intervals of spontaneous activity, and therefore did not target a distinct neural population. This differs from a paradigm in which stimulation is applied during different tasks that recruit largely non-overlapping neural populations(Silvanto and Muggleton, 2008). Previous behavioral work has demonstrated robust state-dependent effects when pairing stimulation to tasks with different profiles of neural activation(Silvanto and Muggleton, 2008). An improved understanding of how to exploit state-dependent effects could have important implications for optimizing stimulation procedures in therapeutic contexts (e.g., see Miller, 2007).
Our results also permit an examination of a widely held conceptual account of how TMS interferes with neural function. This interference has been characterized as a “virtual lesion” (Pascual-Leone et al., 2000), in analogy to structural brain lesions that produce specific functional deficits. The large decrease in visually evoked activity following TMS supports this view, although the physiological processes underlying this suppression have yet to be established. One possible mechanism is long-term hyper-polarization, which may be due to alterations in extrinsic synaptic input or intrinsic membrane properties. For example, electrical stimulation has been shown to substantially elevate levels of extracellular GABA, which suppresses activity for several minutes(Mantovani et al., 2006). Alternatively, prolonged neuronal suppression might result from disruption of normally coordinated activity patterns at the circuit level. Our data and that of others(Jing and Takigawa, 2000; Oliviero et al., 2003; Strens et al., 2002) demonstrate that this coordination is disrupted by TMS. Specifically, the temporal relationships of neural signals, as measured by spike-LFP(Allen et al., 2007) and LFP-LFP phase synchrony (Fig.8), are altered for several minutes. If signal patterns between neurons are perturbed, one would expect a detrimental effect on the functions supported by those cells. Accordingly, when a neural circuit is probed with a visual stimulus following TMS, we find an immediate and prolonged reduction of evoked activity.
The convergence of previous behavioral findings and the current neuronal analyses strongly suggests that variations in existing activity levels contribute to the variability of TMS responses. This relationship may explain, in part, the considerable discrepancies between subjects and trials found in many brain stimulation studies. Furthermore, our results suggest that the analysis of TMS responses in terms of the preceding activity may help to elucidate and interpret stimulation-induced response patterns. The direct monitoring of neural activity using non-invasive techniques, such as EEG(Massimini et al., 2005; Romei et al., 2007) or hemodynamic-based imaging(Allen et al., 2007; Bohning et al., 1999; Ruff et al., 2006; Sack et al., 2007) can empirically guide the effective use of TMS in both clinical and experimental settings.
Methods
Animal preparation
All animal procedures are in compliance with the National Institutes of Health Guide for the Care and Use of Laboratory Animals and are approved by the Animal Care and Use Committee at the University of California Berkeley. Mature cats (n = 5) are initially anesthetized with isofluorane (3-4%). Following placement of venous catheters, isofluorane is discontinued, and anesthesia is maintained with intravenous infusion of fentanyl citrate (10 μg.kg-1.hr-1) and thiopental sodium (initially, 6.0 mg. kg-1.hr-1). Following the placement of a tracheal cannula, animals are artificially ventilated with a 25% O2 / 75% N2O mixture. Respiration rate is adjusted to maintain expired CO2 between 30-36 mmHg (generally between 15-25 breaths/min.). Body temperature is maintained at 38° C with a closed-loop controlled heating pad (Love Controls, IN, USA). A craniotomy over area 17 is performed (Horsley-Clarke coordinates P4, L2 (Horsley and Clarke, 1908)), and the dura resected. After completion of surgical procedures, fentanyl citrate infusion is discontinued, and the rate of thiopental sodium infusion is gradually lowered to a level at which the animal is stabilized (typically 1.5 mg · kg-1 · hr-1). After stabilization, paralysis is induced with pancuronium bromide (0.2 mg · kg-1 · hr-1) to prevent eye movements. EEG, ECG, heart rate, temperature, end-tidal CO2, and intra-tracheal pressure are monitored continuously throughout the duration of the experiment.
Experimental paradigm
Visual stimuli (drifting sinusoidal gratings) are presented on a luminance-calibrated CRT monitor (85 Hz refresh rate, mean luminance 45 cd/m2). Preliminary tests are performed on each neuron to identify the stimulus orientation, spatial frequency, temporal frequency, position, and size to maximize the neuron's spike response. During TMS trials, drifting gratings with optimal parameters are displayed at 50% contrast for 2 s.
TMS is applied to the visual cortex using a Magstim Rapid system (The Magstim Company Ltd., Whitland, UK) with a 70 mm figure-eight coil, which is positioned using a mechanical camera arm (see Fig. 1A). Pulse trains are delivered by series of TTL digital pulses with parametrically varying frequency (1,4,8 Hz) and duration (1,2,4 s) at 100% stimulation intensity. At this intensity and range of distances (1-2 cm distance from the skull and an additional 3 mm between the skull and the cortical surface), the induced electric field strength is estimated to be ∼100-200 V/m (Salinas et al., 2007). To ensure neural recovery between TMS trials, each subsequent trial is initiated only when the evoked response has maintained a steady state value for over 1 minute. We include a minimum of 6 minutes between TMS applications, with typical intervals of 10-15 minutes.
Data collection
Neural data are recorded using either NaCl-filled barrels from a multi-barrel carbon fiber microelectrode (Kation Scientific, Minneapolis, MN) or epoxy coated tungsten microelectrodes (5 MΩ, A-M Systems, Carlsborg, WA). Tungsten electrodes are mounted in a dual array, allowing simultaneous recordings from spatially distinct regions (∼400 μm apart). For both electrode types, the LFP signal is obtained from the broadband neural trace by bandpass filtering between 0.7 Hz and 170 Hz and the data is digitized at 500 Hz. The multi-unit signal is obtained from the broadband signal by filtering between 500 Hz and 8 MHz. Individual single-units are discriminated online based on the temporal shapes of their extracellular potentials and spike times are recorded with 0.04 ms precision. Single-unit data is included in analysis only if the spike waveform remains stable throughout the duration of the TMS trial. Of the 47 single units in our sample, 45 have less than 0.1% of their ISIs within a typical refractory period of 1 ms. The other two cells exhibit a shorter (though not unusual, see (Gur and Snodderly, 2006)) refractory period and have less than 0.1% of events within 0.7 ms.
Data analysis
TMS-induced electrical artifacts are removed from all analyses by excluding a window of data that spans from the first TMS pulse to 100 ms after the last pulse. Single-unit data are converted into spike rates (R) by dividing the number of spikes in a time window by the duration of that window. Spontaneous spike rate, Rs(t), is defined as the raw firing rate during each 8 s inter-stimulus intervals. Evoked spike rate, Re(t), is defined as the average spike firing during each 2 s stimulus presentation following subtraction of the raw spontaneous rate that immediately precedes the stimulus. This subtraction assumes an additive model of spike generation, though it is important to note that none of our results were significantly altered by removing this subtraction from the analysis. The TMS-induced change in spontaneous spike rate, ΔRs, is defined as Rs(t) − Rs(tbaseline), where t denotes time and Rs(tbaseline) denotes the average spontaneous firing rate over the pre-TMS baseline period (40 s interval prior to TMS). The TMS-induced change in evoked spike rate, ΔRe, is defined analogously.
Raw LFP signals are converted to LFP power (L) by first removing line noise at 60 Hz and 85 Hz (monitor refresh rate), then using multi-taper spectral estimation over 1 s windows and 5 Hz bandwidth(Pesaran et al., 2002; Thomson, 1982). The spontaneous LFP power, , is defined as the raw power in frequency band, f, during each spontaneous time interval. Evoked LFP power, is analogously defined for each interval of evoked activity. When comparing absolute values of LFP power, we used log transformations to normalize the data distributions (Cohen et al., 2003). Thus, and . Changes in LFP power can then be computed as the simple difference in transformed power values, e.g., ΔLs(f) = Ls(f,t) − Ls(f,tbaseline), which is mathematically equivalent to the log ratio of the raw power values: . Similarly, the stimulus-evoked elevation in LFP power relative to the spontaneous activity immediately preceding stimulus (Fig. 6C,D) can be defined as: or Le/s(f) = Le(f,tbaseline) − Ls(f,tbaseline). To effectively compare pre-TMS spontaneous LFPs from different sites (Fig. 6E-H), the spectral power of each trial is normalized by the area under the entire spectrum (Liu and Newsome, 2006). Thus ‘relative pre-TMS Ls’, calculated as , refers to the relative power in each frequency band.
To compare the variability of spontaneous and evoked responses, we compute the relative standard deviation (RSD) of each component for a given set of trials. Equivalent results were obtained using Fano Factor, which is a standard measure of neuronal variability that accounts for differences in response amplitudes (Stevens and Zador, 1998). These measures are mathematically equivalent up to a square factor: RSD normalizes the standard deviation by the mean, while the Fano Factor normalizes the square of the standard deviation. A set of trials is defined as three or more trials run under identical conditions (i.e., same site and stimulation parameters). Note that the same sets of trials (n = 23) are also used in the rank correlation analysis (see Fig. 3). Variability in response components is further evaluated by comparing trials recorded at a single cell to those recorded from different cells. This is achieved using a permutation test, resampling the population to form equivalent sets of trials with identical stimulation parameters but different sites. Significance is assessed by comparing the median RSD of the original sets of trials to the distribution of median RSDs from the resampled sets of trials (n = 10,000 resamples) (Manly, 1991).
For correlation analyses including all trials, (Fig. 6 and 7) partial correlation is used to control for the possible influence of additional variables (Cohen et al., 2003). Pre- and post-TMS variables of interest are first regressed on confound factors that include stimulation parameters and trial number. In state-dependency analyses (Fig. 6), the pre-TMS spontaneous activity (spike rate or LFP power, where appropriate) is included as an additional regressor. Correlation is then performed on the residuals. These residuals have the same units as the original variables, but have been linearly transformed. Thus, the pre- and post-TMS spike rate residuals can take on negative values (see Fig. 6C). This partial correlation approach ensures that any observed relationship cannot be due to linear associations between additional variables.
For synchrony analyses, LFP-LFP synchrony between recording sites is evaluated using the coherence statistic(Mitra and Pesaran, 1999): , where Cxy is the coherence ranging from 0 to 1, f is frequency, Sx(f) and Sy(f) are the spectra of the signals recorded from the two sites, and Sxy(f) is the cross-spectrum. Because coherence is a biased statistic which varies with sample size (Jarvis and Mitra, 2001), inter-electrode coherence was always calculated over equivalent time windows (2 s duration). Because coherence is sensitive to both amplitude and phase coupling, we also computed a phase-locking value that is insensitive to amplitude changes (Lachaux et al., 1999; Pereda et al., 2005). The LFP signal was filtered in 5 Hz bands and the instantaneous phase at each time point was extracted via the Hilbert transform (Lachaux et al., 1999; Pereda et al., 2005). The phase-locking value was computed as , where f is frequency, φ(t) is the difference between the phases at each electrode and at each time t, and 〈·〉 denotes the average over time (Lachaux et al., 1999; Pereda et al., 2005). The two synchrony measures were qualitatively similar and therefore results are reported for coherence only.
Supplementary Material
Acknowledgments
We thank R. Bartholomew, N. Lines, A. Koukarine, and L. Gibson for assistance in developing the electrophysiological apparatus and data acquisition software. Supported by research and CORE grants from the National Eye Institute (EY01175 and EY03176, respectively) and by NSF graduate research fellowship 2003014861.
Footnotes
Publisher's Disclaimer: This is a PDF file of an unedited manuscript that has been accepted for publication. As a service to our customers we are providing this early version of the manuscript. The manuscript will undergo copyediting, typesetting, and review of the resulting proof before it is published in its final citable form. Please note that during the production process errors may be discovered which could affect the content, and all legal disclaimers that apply to the journal pertain.
References
- Allen EA, Pasley BN, Duong T, Freeman RD. Transcranial magnetic stimulation elicits coupled neural and hemodynamic consequences. Science. 2007;317:1918–1921. doi: 10.1126/science.1146426. [DOI] [PubMed] [Google Scholar]
- Ambrosini A, de Noordhout AM, Sandor PS, Schoenen J. Electrophysiological studies in migraine: a comprehensive review of their interest and limitations. Cephalalgia. 2003;23 1:13–31. doi: 10.1046/j.1468-2982.2003.00571.x. [DOI] [PubMed] [Google Scholar]
- Barker AT, Jalinous R, Freeston IL. Non-invasive magnetic stimulation of human motor cortex. Lancet. 1985;1:1106–1107. doi: 10.1016/s0140-6736(85)92413-4. [DOI] [PubMed] [Google Scholar]
- Belitski A, Gretton A, Magri C, Murayama Y, Montemurro MA, Logothetis NK, Panzeri S. Low-frequency local field potentials and spikes in primary visual cortex convey independent visual information. J Neurosci. 2008;28:5696–5709. doi: 10.1523/JNEUROSCI.0009-08.2008. [DOI] [PMC free article] [PubMed] [Google Scholar]
- Berardelli A, Inghilleri M, Rothwell JC, Romeo S, Curra A, Gilio F, Modugno N, Manfredi M. Facilitation of muscle evoked responses after repetitive cortical stimulation in man. Exp Brain Res. 1998;122:79–84. doi: 10.1007/s002210050493. [DOI] [PubMed] [Google Scholar]
- Bestmann S, Ruff CC, Blakemore C, Driver J, Thilo KV. Spatial attention changes excitability of human visual cortex to direct stimulation. Curr Biol. 2007;17:134–139. doi: 10.1016/j.cub.2006.11.063. [DOI] [PMC free article] [PubMed] [Google Scholar]
- Bestmann S, Swayne O, Blankenburg F, Ruff CC, Haggard P, Weiskopf N, Josephs O, Driver J, Rothwell JC, Ward NS. Dorsal premotor cortex exerts state-dependent causal influences on activity in contralateral primary motor and dorsal premotor cortex. Cereb Cortex. 2008;18:1281–1291. doi: 10.1093/cercor/bhm159. [DOI] [PMC free article] [PubMed] [Google Scholar]
- Bohning DE, Shastri A, McConnell KA, Nahas Z, Lorberbaum JP, Roberts DR, Teneback C, Vincent DJ, George MS. A combined TMS/fMRI study of intensity-dependent TMS over motor cortex. Biol Psychiatry. 1999;45:385–394. doi: 10.1016/s0006-3223(98)00368-0. [DOI] [PubMed] [Google Scholar]
- Brighina F, Piazza A, Daniele O, Fierro B. Modulation of visual cortical excitability in migraine with aura: effects of 1 Hz repetitive transcranial magnetic stimulation. Exp Brain Res. 2002;145:177–181. doi: 10.1007/s00221-002-1096-7. [DOI] [PubMed] [Google Scholar]
- Brighina F, Piazza A, Vitello G, Aloisio A, Palermo A, Daniele O, Fierro B. rTMS of the prefrontal cortex in the treatment of chronic migraine: a pilot study. J Neurol Sci. 2004;227:67–71. doi: 10.1016/j.jns.2004.08.008. [DOI] [PubMed] [Google Scholar]
- Bruns A. Fourier-, Hilbert- and wavelet-based signal analysis: are they really different approaches? J Neurosci Methods. 2004;137:321–332. doi: 10.1016/j.jneumeth.2004.03.002. [DOI] [PubMed] [Google Scholar]
- Burt T, Lisanby SH, Sackeim HA. Neuropsychiatric applications of transcranial magnetic stimulation: a meta analysis. Int J Neuropsychopharmacol. 2002;5:73–103. doi: 10.1017/S1461145702002791. [DOI] [PubMed] [Google Scholar]
- Buschman TJ, Miller EK. Top-down versus bottom-up control of attention in the prefrontal and posterior parietal cortices. Science. 2007;315:1860–1862. doi: 10.1126/science.1138071. [DOI] [PubMed] [Google Scholar]
- Butefisch CM, Davis BC, Wise SP, Sawaki L, Kopylev L, Classen J, Cohen LG. Mechanisms of use-dependent plasticity in the human motor cortex. Proc Natl Acad Sci U S A. 2000;97:3661–3665. doi: 10.1073/pnas.050350297. [DOI] [PMC free article] [PubMed] [Google Scholar]
- Buzsaki G, Draguhn A. Neuronal oscillations in cortical networks. Science. 2004;304:1926–1929. doi: 10.1126/science.1099745. [DOI] [PubMed] [Google Scholar]
- Cahn SD, Herzog AG, Pascual-Leone A. Paired-pulse transcranial magnetic stimulation: effects of hemispheric laterality, gender, and handedness in normal controls. J Clin Neurophysiol. 2003;20:371–374. doi: 10.1097/00004691-200309000-00009. [DOI] [PubMed] [Google Scholar]
- Canolty RT, Edwards E, Dalal SS, Soltani M, Nagarajan SS, Kirsch HE, Berger MS, Barbaro NM, Knight RT. High gamma power is phase-locked to theta oscillations in human neocortex. Science. 2006;313:1626–1628. doi: 10.1126/science.1128115. [DOI] [PMC free article] [PubMed] [Google Scholar]
- Chen R, Classen J, Gerloff C, Celnik P, Wassermann EM, Hallett M, Cohen LG. Depression of motor cortex excitability by low-frequency transcranial magnetic stimulation. Neurology. 1997;48:1398–1403. doi: 10.1212/wnl.48.5.1398. [DOI] [PubMed] [Google Scholar]
- Cohen J, Cohen P, SG W, Aiken LS. Applied Multiple Regression/Correlation Analysis for the Behavioral Sciences. Mahwah, NJ: Lawrence Erlbaum Associates, Publishers; 2003. [Google Scholar]
- Couturier JL. Efficacy of rapid-rate repetitive transcranial magnetic stimulation in the treatment of depression: a systematic review and meta-analysis. J Psychiatry Neurosci. 2005;30:83–90. [PMC free article] [PubMed] [Google Scholar]
- de Labra C, Rivadulla C, Grieve K, Marino J, Espinosa N, Cudeiro J. Changes in visual responses in the feline dLGN: selective thalamic suppression induced by transcranial magnetic stimulation of V1. Cereb Cortex. 2007;17:1376–1385. doi: 10.1093/cercor/bhl048. [DOI] [PubMed] [Google Scholar]
- Destexhe A, Contreras D, Steriade M. Spatiotemporal analysis of local field potentials and unit discharges in cat cerebral cortex during natural wake and sleep states. J Neurosci. 1999;19:4595–4608. doi: 10.1523/JNEUROSCI.19-11-04595.1999. [DOI] [PMC free article] [PubMed] [Google Scholar]
- Efron B, Tibshirani R. An Introduction to the Bootstrap. New York, NY: Chapman & Hall; 1994. [Google Scholar]
- Engel AK, Fries P, Singer W. Dynamic predictions: oscillations and synchrony in top-down processing. Nat Rev Neurosci. 2001;2:704–716. doi: 10.1038/35094565. [DOI] [PubMed] [Google Scholar]
- Fregni F, Simon DK, Wu A, Pascual-Leone A. Non-invasive brain stimulation for Parkinson's disease: a systematic review and meta-analysis of the literature. J Neurol Neurosurg Psychiatry. 2005;76:1614–1623. doi: 10.1136/jnnp.2005.069849. [DOI] [PMC free article] [PubMed] [Google Scholar]
- Fries P, Reynolds JH, Rorie AE, Desimone R. Modulation of oscillatory neuronal synchronization by selective visual attention. Science. 2001;291:1560–1563. doi: 10.1126/science.1055465. [DOI] [PubMed] [Google Scholar]
- Fritsch G, Hitzig E. Ueber die elektrishe Erregarkeit des Grosshirns. Springfield, IL: Charles C Thomas; 1870. [DOI] [PubMed] [Google Scholar]
- George MS, Wassermann EM, Post RM. Transcranial magnetic stimulation: a neuropsychiatric tool for the 21st century. J Neuropsychiatry Clin Neurosci. 1996;8:373–382. doi: 10.1176/jnp.8.4.373. [DOI] [PubMed] [Google Scholar]
- Gross M, Nakamura L, Pascual-Leone A, Fregni F. Has repetitive transcranial magnetic stimulation (rTMS) treatment for depression improved? A systematic review and meta-analysis comparing the recent vs. the earlier rTMS studies. Acta Psychiatr Scand. 2007;116:165–173. doi: 10.1111/j.1600-0447.2007.01049.x. [DOI] [PubMed] [Google Scholar]
- Gur M, Snodderly DM. High response reliability of neurons in primary visual cortex (V1) of alert, trained monkeys. Cereb Cortex. 2006;16:888–895. doi: 10.1093/cercor/bhj032. [DOI] [PubMed] [Google Scholar]
- Hallett M. Transcranial magnetic stimulation: a primer. Neuron. 2007;55:187–199. doi: 10.1016/j.neuron.2007.06.026. [DOI] [PubMed] [Google Scholar]
- Heeger DJ, Ress D. What does fMRI tell us about neuronal activity? Nat Rev Neurosci. 2002;3:142–151. doi: 10.1038/nrn730. [DOI] [PubMed] [Google Scholar]
- Henrie JA, Shapley R. LFP power spectra in V1 cortex: the graded effect of stimulus contrast. J Neurophysiol. 2005;94:479–490. doi: 10.1152/jn.00919.2004. [DOI] [PubMed] [Google Scholar]
- Holscher C, Anwyl R, Rowan MJ. Stimulation on the positive phase of hippocampal theta rhythm induces long-term potentiation that can Be depotentiated by stimulation on the negative phase in area CA1 in vivo. J Neurosci. 1997;17:6470–6477. doi: 10.1523/JNEUROSCI.17-16-06470.1997. [DOI] [PMC free article] [PubMed] [Google Scholar]
- Horsley V, Clarke R. The structure and functions of the cerebellum examined by a new method. Brain. 1908;31:45–124. [Google Scholar]
- Houweling AR, Brecht M. Behavioural report of single neuron stimulation in somatosensory cortex. Nature. 2008;451:65–68. doi: 10.1038/nature06447. [DOI] [PubMed] [Google Scholar]
- Huang YZ, Edwards MJ, Rounis E, Bhatia KP, Rothwell JC. Theta burst stimulation of the human motor cortex. Neuron. 2005;45:201–206. doi: 10.1016/j.neuron.2004.12.033. [DOI] [PubMed] [Google Scholar]
- Huber D, Petreanu L, Ghitani N, Ranade S, Hromadka T, Mainen Z, Svoboda K. Sparse optical microstimulation in barrel cortex drives learned behaviour in freely moving mice. Nature. 2008;451:61–64. doi: 10.1038/nature06445. [DOI] [PMC free article] [PubMed] [Google Scholar]
- Izhikevich EM. Bursting. Scholarpedia. 2006;1:1300. [Google Scholar]
- Jarvis MR, Mitra PP. Sampling properties of the spectrum and coherency of sequences of action potentials. Neural Comput. 2001;13:717–749. doi: 10.1162/089976601300014312. [DOI] [PubMed] [Google Scholar]
- Jing H, Takigawa M. Observation of EEG coherence after repetitive transcranial magnetic stimulation. Clin Neurophysiol. 2000;111:1620–1631. doi: 10.1016/s1388-2457(00)00357-6. [DOI] [PubMed] [Google Scholar]
- Kringelbach ML, Jenkinson N, Owen SL, Aziz TZ. Translational principles of deep brain stimulation. Nat Rev Neurosci. 2007;8:623–635. doi: 10.1038/nrn2196. [DOI] [PubMed] [Google Scholar]
- Lachaux JP, Rodriguez E, Martinerie J, Varela FJ. Measuring phase synchrony in brain signals. Human brain mapping. 1999;8:194–208. doi: 10.1002/(SICI)1097-0193(1999)8:4<194::AID-HBM4>3.0.CO;2-C. [DOI] [PMC free article] [PubMed] [Google Scholar]
- Lisanby SH, Belmaker RH. Animal models of the mechanisms of action of repetitive transcranial magnetic stimulation (RTMS): comparisons with electroconvulsive shock (ECS) Depression and anxiety. 2000;12:178–187. doi: 10.1002/1520-6394(2000)12:3<178::AID-DA10>3.0.CO;2-N. [DOI] [PubMed] [Google Scholar]
- Liu J, Newsome WT. Local field potential in cortical area MT: stimulus tuning and behavioral correlations. J Neurosci. 2006;26:7779–7790. doi: 10.1523/JNEUROSCI.5052-05.2006. [DOI] [PMC free article] [PubMed] [Google Scholar]
- Logothetis NK. What we can do and what we cannot do with fMRI. Nature. 2008;453:869–878. doi: 10.1038/nature06976. [DOI] [PubMed] [Google Scholar]
- Logothetis NK, Kayser C, Oeltermann A. In vivo measurement of cortical impedance spectrum in monkeys: implications for signal propagation. Neuron. 2007;55:809–823. doi: 10.1016/j.neuron.2007.07.027. [DOI] [PubMed] [Google Scholar]
- Manly CFJ. Randomization and Monte-Carlo Methods in Biology. New York, NY: Chapman & Hall; 1991. [Google Scholar]
- Mantovani M, Van Velthoven V, Fuellgraf H, Feuerstein TJ, Moser A. Neuronal electrical high frequency stimulation enhances GABA outflow from human neocortical slices. Neurochem Int. 2006;49:347–350. doi: 10.1016/j.neuint.2006.02.008. [DOI] [PubMed] [Google Scholar]
- Martin JL, Barbanoj MJ, Schlaepfer TE, Thompson E, Perez V, Kulisevsky J. Repetitive transcranial magnetic stimulation for the treatment of depression. Systematic review and meta-analysis. Br J Psychiatry. 2003;182:480–491. doi: 10.1192/bjp.182.6.480. [DOI] [PubMed] [Google Scholar]
- Massimini M, Ferrarelli F, Huber R, Esser SK, Singh H, Tononi G. Breakdown of cortical effective connectivity during sleep. Science. 2005;309:2228–2232. doi: 10.1126/science.1117256. [DOI] [PubMed] [Google Scholar]
- Miller G. Neuroscience. Uncovering the magic in magnetic brain stimulation. Science. 2007;317:1846. doi: 10.1126/science.317.5846.1846a. [DOI] [PubMed] [Google Scholar]
- Mitra PP, Pesaran B. Analysis of dynamic brain imaging data. Biophys J. 1999;76:691–708. doi: 10.1016/S0006-3495(99)77236-X. [DOI] [PMC free article] [PubMed] [Google Scholar]
- Mitzdorf U. Current source-density method and application in cat cerebral cortex: investigation of evoked potentials and EEG phenomena. Physiol Rev. 1985;65:37–100. doi: 10.1152/physrev.1985.65.1.37. [DOI] [PubMed] [Google Scholar]
- Moliadze V, Giannikopoulos D, Eysel UT, Funke K. Paired-pulse transcranial magnetic stimulation protocol applied to visual cortex of anaesthetized cat: effects on visually evoked single-unit activity. J Physiol. 2005;566:955–965. doi: 10.1113/jphysiol.2005.086090. [DOI] [PMC free article] [PubMed] [Google Scholar]
- Moliadze V, Zhao Y, Eysel U, Funke K. Effect of transcranial magnetic stimulation on single-unit activity in the cat primary visual cortex. J Physiol. 2003;553:665–679. doi: 10.1113/jphysiol.2003.050153. [DOI] [PMC free article] [PubMed] [Google Scholar]
- Niessing J, Ebisch B, Schmidt KE, Niessing M, Singer W, Galuske RA. Hemodynamic signals correlate tightly with synchronized gamma oscillations. Science. 2005;309:948–951. doi: 10.1126/science.1110948. [DOI] [PubMed] [Google Scholar]
- Oliveri M, Calvo G. Increased visual cortical excitability in ecstasy users: a transcranial magnetic stimulation study. J Neurol Neurosurg Psychiatry. 2003;74:1136–1138. doi: 10.1136/jnnp.74.8.1136. [DOI] [PMC free article] [PubMed] [Google Scholar]
- Oliviero A, Strens LH, Di Lazzaro V, Tonali PA, Brown P. Persistent effects of high frequency repetitive TMS on the coupling between motor areas in the human. Exp Brain Res. 2003;149:107–113. doi: 10.1007/s00221-002-1344-x. [DOI] [PubMed] [Google Scholar]
- Pascual-Leone A, Tormos JM, Keenan J, Tarazona F, Canete C, Catala MD. Study and modulation of human cortical excitability with transcranial magnetic stimulation. J Clin Neurophysiol. 1998;15:333–343. doi: 10.1097/00004691-199807000-00005. [DOI] [PubMed] [Google Scholar]
- Pascual-Leone A, Walsh V, Rothwell J. Transcranial magnetic stimulation in cognitive neuroscience--virtual lesion, chronometry, and functional connectivity. Curr Opin Neurobiol. 2000;10:232–237. doi: 10.1016/s0959-4388(00)00081-7. [DOI] [PubMed] [Google Scholar]
- Patton HD, Amassian VE. Single and multiple-unit analysis of cortical stage of pyramidal tract activation. J Neurophysiol. 1954;17:345–363. doi: 10.1152/jn.1954.17.4.345. [DOI] [PubMed] [Google Scholar]
- Paus T. Inferring causality in brain images: a perturbation approach. Philos Trans R Soc Lond B Biol Sci. 2005;360:1109–1114. doi: 10.1098/rstb.2005.1652. [DOI] [PMC free article] [PubMed] [Google Scholar]
- Pereda E, Quiroga RQ, Bhattacharya J. Nonlinear multivariate analysis of neurophysiological signals. Prog Neurobiol. 2005;77:1–37. doi: 10.1016/j.pneurobio.2005.10.003. [DOI] [PubMed] [Google Scholar]
- Pesaran B, Pezaris JS, Sahani M, Mitra PP, Andersen RA. Temporal structure in neuronal activity during working memory in macaque parietal cortex. Nature neuroscience. 2002;5:805–811. doi: 10.1038/nn890. [DOI] [PubMed] [Google Scholar]
- Reich DS, Mechler F, Purpura KP, Victor JD. Interspike intervals, receptive fields, and information encoding in primary visual cortex. J Neurosci. 2000;20:1964–1974. doi: 10.1523/JNEUROSCI.20-05-01964.2000. [DOI] [PMC free article] [PubMed] [Google Scholar]
- Ridding MC, Rothwell JC. Is there a future for therapeutic use of transcranial magnetic stimulation? Nat Rev Neurosci. 2007;8:559–567. doi: 10.1038/nrn2169. [DOI] [PubMed] [Google Scholar]
- Romei V, Brodbeck V, Michel C, Amedi A, Pascual-Leone A, Thut G. Spontaneous Fluctuations in Posterior {alpha}-Band EEG Activity Reflect Variability in Excitability of Human Visual Areas. Cereb Cortex. 2007 doi: 10.1093/cercor/bhm229. [DOI] [PMC free article] [PubMed] [Google Scholar]
- Ruff CC, Blankenburg F, Bjoertomt O, Bestmann S, Freeman E, Haynes JD, Rees G, Josephs O, Deichmann R, Driver J. Concurrent TMS-fMRI and psychophysics reveal frontal influences on human retinotopic visual cortex. Curr Biol. 2006;16:1479–1488. doi: 10.1016/j.cub.2006.06.057. [DOI] [PubMed] [Google Scholar]
- Saalmann YB, Pigarev IN, Vidyasagar TR. Neural mechanisms of visual attention: how top-down feedback highlights relevant locations. Science. 2007;316:1612–1615. doi: 10.1126/science.1139140. [DOI] [PubMed] [Google Scholar]
- Sack AT, Kohler A, Bestmann S, Linden DE, Dechent P, Goebel R, Baudewig J. Imaging the brain activity changes underlying impaired visuospatial judgments: simultaneous FMRI, TMS, and behavioral studies. Cereb Cortex. 2007;17:2841–2852. doi: 10.1093/cercor/bhm013. [DOI] [PubMed] [Google Scholar]
- Salinas FS, Lancaster JL, Fox PT. Detailed 3D models of the induced electric field of transcranial magnetic stimulation coils. Phys Med Biol. 2007;52:2879–2892. doi: 10.1088/0031-9155/52/10/016. [DOI] [PubMed] [Google Scholar]
- Sauseng P, Klimesch W, Gerloff C, Hummel FC. Spontaneous locally restricted EEG alpha activity determines cortical excitability in the motor cortex. Neuropsychologia. 2008 doi: 10.1016/j.neuropsychologia.2008.07.021. [DOI] [PubMed] [Google Scholar]
- Siegel M, Konig P. A functional gamma-band defined by stimulus-dependent synchronization in area 18 of awake behaving cats. J Neurosci. 2003;23:4251–4260. doi: 10.1523/JNEUROSCI.23-10-04251.2003. [DOI] [PMC free article] [PubMed] [Google Scholar]
- Silvanto J, Muggleton NG. New light through old windows: moving beyond the “virtual lesion” approach to transcranial magnetic stimulation. Neuroimage. 2008;39:549–552. doi: 10.1016/j.neuroimage.2007.09.008. [DOI] [PubMed] [Google Scholar]
- Silvanto J, Muggleton NG, Cowey A, Walsh V. Neural adaptation reveals state-dependent effects of transcranial magnetic stimulation. Eur J Neurosci. 2007;25:1874–1881. doi: 10.1111/j.1460-9568.2007.05440.x. [DOI] [PubMed] [Google Scholar]
- Skottun BC, De Valois RL, Grosof DH, Movshon JA, Albrecht DG, Bonds AB. Classifying simple and complex cells on the basis of response modulation. Vision Res. 1991;31:1079–1086. doi: 10.1016/0042-6989(91)90033-2. [DOI] [PubMed] [Google Scholar]
- Stevens CF, Zador AM. Input synchrony and the irregular firing of cortical neurons. Nat Neurosci. 1998;1:210–217. doi: 10.1038/659. [DOI] [PubMed] [Google Scholar]
- Stewart LM, Walsh V, Rothwell JC. Motor and phosphene thresholds: a transcranial magnetic stimulation correlation study. Neuropsychologia. 2001;39:415–419. doi: 10.1016/s0028-3932(00)00130-5. [DOI] [PubMed] [Google Scholar]
- Strens LH, Oliviero A, Bloem BR, Gerschlager W, Rothwell JC, Brown P. The effects of subthreshold 1 Hz repetitive TMS on cortico-cortical and interhemispheric coherence. Clin Neurophysiol. 2002;113:1279–1285. doi: 10.1016/s1388-2457(02)00151-7. [DOI] [PubMed] [Google Scholar]
- Tehovnik EJ, Tolias AS, Sultan F, Slocum WM, Logothetis NK. Direct and indirect activation of cortical neurons by electrical microstimulation. J Neurophysiol. 2006;96:512–521. doi: 10.1152/jn.00126.2006. [DOI] [PubMed] [Google Scholar]
- Terao Y, Ugawa Y. Basic mechanisms of TMS. J Clin Neurophysiol. 2002;19:322–343. doi: 10.1097/00004691-200208000-00006. [DOI] [PubMed] [Google Scholar]
- Theodore WH. Transcranial Magnetic Stimulation in Epilepsy. Epilepsy Curr. 2003;3:191–197. doi: 10.1046/j.1535-7597.2003.03607.x. [DOI] [PMC free article] [PubMed] [Google Scholar]
- Thomson DJ. Spectrum estimation and harmonic analysis. Proceedings of the IEEE. 1982;70:1055–1096. [Google Scholar]
- Van Der Werf YD, Sadikot AF, Strafella AP, Paus T. The neural response to transcranial magnetic stimulation of the human motor cortex. II. Thalamocortical contributions. Exp Brain Res. 2006;175:246–255. doi: 10.1007/s00221-006-0548-x. [DOI] [PubMed] [Google Scholar]
- Wespatat V, Tennigkeit F, Singer W. Phase sensitivity of synaptic modifications in oscillating cells of rat visual cortex. J Neurosci. 2004;24:9067–9075. doi: 10.1523/JNEUROSCI.2221-04.2004. [DOI] [PMC free article] [PubMed] [Google Scholar]
- Ziemann U, Tam A, Butefisch C, Cohen LG. Dual modulating effects of amphetamine on neuronal excitability and stimulation-induced plasticity in human motor cortex. Clin Neurophysiol. 2002;113:1308–1315. doi: 10.1016/s1388-2457(02)00171-2. [DOI] [PubMed] [Google Scholar]
Associated Data
This section collects any data citations, data availability statements, or supplementary materials included in this article.