Abstract
We combined molecular dynamics based free energy calculations with Sum Frequency Generation (SFG) spectroscopy to study the orientational distribution of solvated peptides near hydrophobic surfaces. Using a simplified atomistic model of the polystyrene (PS) surface, molecular dynamics simulations have been applied to compute the orientational probability of an α-helical peptide, magainin 2, with respect to the PS/water interface. Free energy calculations revealed that the preferred (horizontal) peptide orientation was driven by the favorable interactions between the hydrophobic PS surface and hydrophobic residues on the helix, and additional simulations examined the importance of small aggregate formation. Concentration-dependent measurements obtained via SFG vibrational spectroscopy suggest that at very low peptide concentrations, magainin molecules tend to lie down at the PS/solution interface, which correlates well with the simulation results. When the concentration is increased, peptides exhibit behavior not captured by MD simulations using single helical peptides. A combination of simulations and experiments was shown to yield more reliable results with molecular-level insights into interaction between peptides and polymer surfaces.
Introduction
The interaction of proteins with polymer surfaces is a central component of many important biological and material systems. For example, the forces that drive adsorption and the resultant conformational changes of the protein on polymer surfaces are being increasingly studied with regard to questions such as biocompatibility,1 biofouling,2 and the development of biosensors based on immobilized enzymes.3, 4 Protein-surface interactions have been studied with many analytical methods, including Nuclear Magnetic Resonance (NMR),5 attenuated total reflectance-Fourier transform infrared spectroscopy (ATR-FTIR),6 and circular dichroism (CD),7 but it is difficult for each of these methods individually to provide a complete picture of protein structure at interfaces.
Recently, surface-sensitive Sum Frequency Generation vibrational spectroscopy (SFG) has been applied to the study of proteins and peptides at interfaces in situ.8–39 Early results demonstrated the superb interfacial sensitivity of SFG; however, the interpretation of vibrational spectra in terms of molecular structure or orientation generally requires assumptions about the native crystal structure of the protein. These methods are not able to provide atomically detailed structures, or to assess orientation in the event of significant changes in structure. Furthermore, in the case of larger proteins, knowing the orientation of individual secondary structural elements may not be sufficient to describe how the protein/peptide interacts with the surface- for that, additional information is needed.
Molecular dynamics simulations are one such method for studying the structures of molecules at a surface in atomic detail. Increasing computing power and progress in simulation algorithms have made it possible to study large systems involving interfacial proteins. Although these simulations are still limited to short (sub-microsecond) timescales, they provide a valuable tool for probing experimentally suggested configurations in greater detail. To date, a variety of model systems have been used to study the interaction of proteins with cell membranes,40, 41 self-assembled monolayers,42 and metal43 or other1, 29, 44–50 model surfaces, with and without water molecules modeled explicitly. Longer effective timescales can be studied by taking advantage of coarse-grained approaches, such as stochastic dynamics of alternating hydrophobic/polar beads. Although this allows enhanced sampling of the reduced configurational space, these methods may ignore fine structural details, or oversimplify the interactions in the system.51–55 The net result is a common tradeoff: the simulations are either limited to very short timescales and difficult system setup (due to the large system size involved with the fullest level of detail), or else run faster, while neglecting potentially important aspects of adsorption. The model used in the simulations presented here (as described in “Methods”) uses a simplified polymer surface representation to ease system setup, while still enabling the use of atomistic detail.
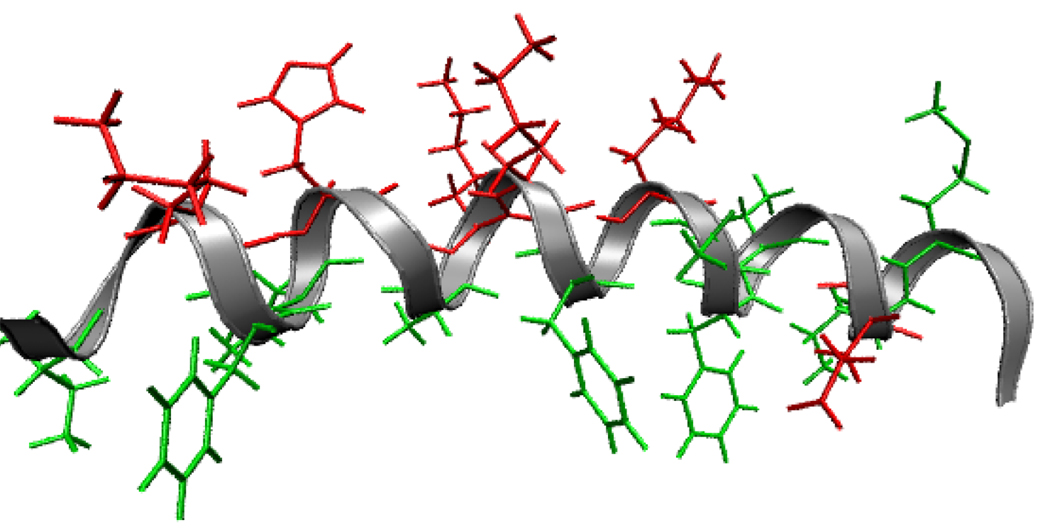
Furthermore, we examine the validity of these simulations by comparing our molecular dynamics results to experimental measurements obtained using SFG vibrational spectroscopy. In this paper, we report simulations and experiments that focus on the magainin 2 peptide at the hydrophobic PS surface. We will apply SFG to experimentally study molecular interactions between the α-helix (a common secondary structure in proteins) and a PS surface; these experimental results will be compared to predictions obtained from MD simulations. Here magainin 2 serves as a model α-helix, and PS as a model polymer surface. This simplified model system allows for more detailed simulation studies (such as free energy calculations) that would not be feasible for the case of magainin in model lipid bilayers. Polymer-protein interactions are also of interest in a range of biomedical and antifouling applications; hence such a model study will also provide a basis for future studies on interactions between more complicated proteins and polymers. Magainin 2 (PDB ID 2mag, sequence GIGKFLHSAKKFGKAFVGEIMNS) is a 23-residue, facially amphiphilic peptide; as a result, it should be helical at hydrophobic/hydrophilic interfaces. This segregated structure is critical to the function of the peptide as a selective antimicrobial agent (Figure 1).
Figure 1.
Magainin 2 (PDB ID 2mag) is an alpha helix in which hydrophobic residues (green) and charged residues (red) are segregated to different faces of the peptide.
MATERIALS AND METHODS
SFG Measurements
SFG theory and data analysis have been extensively published before, and the details will not be repeated here.9, 12, 15, 56–59 Two pico-second frequency scanning SFG spectrometers are available in our lab, details of which were presented previously.60 SFG studies on interfacial peptides and proteins have previously been performed for a variety of systems in our group.8–13, 15–22, 59, 61–65 We will briefly review some details of the experiments carried out in this research here.
A PS thin film was prepared by spin-coating at 2500 rpm from a 2% wt solution of PS (or deuterated PS) in toluene on an IR-grade CaF2 prism. The prism was first pre-cleaned via soaking overnight in solutions of toluene and Contrex (Decon Labs, King of Prussia, PA), followed by 20 min in methanol and plasma treatment to remove any remaining contamination; no signals were observed from the cleaned CaF2 substrates prior to deposition of the polymer film.
Prior to collection of peptide signals, the polymer surface was contacted with Millipore water for 15 min and allowed to equilibrate while the laser shutters were blocked. Following this time, spectra were collected from the polymer surface in both the Amide I and C-H stretching frequency regions; for deuterated PS samples, additional spectra were also collected as needed in the C-D stretching region. A “near” total reflection geometry was used.20
Stock solutions of magainin 2 (Genscript Inc) were prepared by dissolving 1 mg of peptide in 1mL of Millipore water. Sufficient amounts of this stock solution were added to the water already in contact with the polymer surface to produce final peptide concentrations of approximately 200, 400, and 800 nM. In each case, the polymer-peptide system was allowed to equilibrate for 20 min, after which SFG spectra were collected in the ssp and ppp polarization combinations across multiple spectral ranges. The resulting spectra remained stable over time, suggesting that sufficient time had elapsed for peptides to diffuse and organize at the polymer/peptide solution interface.
Molecular Dynamics Simulations
1. The model polystyrene surface
Polymer surface simulations are limited in part by system size, i.e., by the number of atoms required to adequately represent the solvent, surface, and peptide. Thus, although some work has been done on atomistic-detail simulations of PS,53, 66, 67 the relatively long equilibration times in the presence of explicit solvent (10–20ns) required are non-trivial, and this complicates setup of any studies involving peptide adsorption.49
One common strategy employed to overcome this limitation is to make use of a simplified surface model (such as graphite48 or SiO2 29); however, these models are unable to directly capture variations in surface topography that may have important consequences for hydration or protein orientation. Likewise, the use of uniform implicit solvent models, though common, may fail to capture interfacial phenomena or small changes in peptide orientation due to dewetting behavior.68
As a compromise solution, we employed a simplified representation of the polymer surface that allowed for smaller system sizes than the use of full polymer chains, thus facilitating the use of explicit solvent and incorporation of certain aspects of the polymer surface (such as local reorganization of surface groups or the ability to vary surface roughness) not captured by more abstract, rigid model surfaces. This simplified, but still atomistic-level representation employed an array of individual ethylbenzene monomers to represent units of the PS backbone, with unit spacings adjusted to reproduce some basic experimentally measured properties of the system (such as a bulk density of 1.05 g/mL and the known preferred orientation of surface aromatic rings in water).69
To model the PS surface, an array of individual ethylbenzene molecules was used to represent the styrene monomer, with monomers arranged in a grid to form the surface. Adjacent points in this grid were offset by ½ the length of an individual monomer, with residue spacing adjusted to reproduce the bulk density. Several layers of the surface were replicated to form a bulk region, as steric effects from the presence of the bulk were necessary to preserve surface group orientation, and to prevent unrealistic penetration of explicit water molecules below the surface. A single alpha carbon in each monomer of the surface and bulk was constrained with a harmonic potential of 1 kcal/mol/Å2 to mimic the presence of a backbone and to prevent the monomers from moving unreasonably relative to each other.
Although we make the approximation that the PS surface is quite flat, model systems that introduce elements of roughness may be created in a straightforward manner.
2. Solvation
Explicit solvent was added using approximately 4300 molecules of TIP3P water above the surface,70 creating a sphere of radius ~36Å suitable for fully solvating the peptides studied. No ions were included in this system.
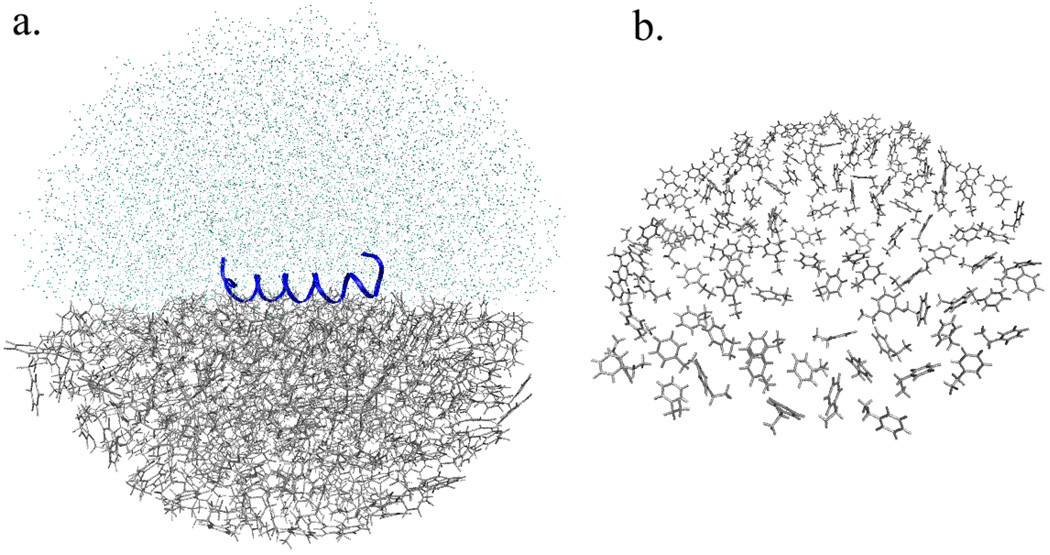
The system was then modeled as a “droplet in a vacuum”,71, 72 using a spherical quartic boundary potential to constrain the solvent inside the 36Å radius.40 This system consists of half water molecules and half surface/bulk residues (modeled by the ethylbenzene residues), as shown in Figure 2. For this droplet model, fewer solvent molecules were required than would be the case for periodic boundary conditions, due to simple geometric considerations; the resulting improvement in computational performance was sufficient to enable more detailed simulations and free energy sampling even with modest computational resources. Overall, 10–30% fewer atoms were required for this spherical model as compared to a comparable simulation employing periodic boundary conditions (depending on the box size used).
Figure 2.
a) The spherical model for solvent and surface used for molecular dynamics simulations. Ethylbenzene residues are shown as grey lines, and the solvent molecules are represented as single points (light blue). The radius of the model system used was approximately 36 Å. The helical peptide is in the center, represented by the continuous coiled line (dark blue). b) The surface as an array of monomers (top view)
3. Equilibration and dynamics
The model solvent/surface system was built and equilibrated using version c34b2 of the CHARMM molecular dynamics package73 with the CHARMM22 all-atom force field for proteins.74
Heating and early equilibration of the surface system were performed for 400 ps using the leapfrog Verlet algorithm, rescaling velocities on a 1 ps timescale to a final temperature of 298K. The resulting initial coordinates for the solvent and surface were used in all peptide adsorption simulations described.
Following heating of the solvent/surface system, the peptide was placed at the interface, and overlapping waters were deleted. Peptide coordinates were obtained from the Protein Databank (PDB), and the exact position of the peptide was varied depending on the simulation conditions chosen. Peptide coordinates were held fixed as an additional 500 ps of equilibration was then performed for the solvent and surface in the presence of peptide.
For production runs, dynamics were performed using a Nosé-Hoover thermostat at 298 K with the velocity Verlet algorithm; the exact length of the simulation varied (as described below). The SHAKE algorithm was used to constrain all bonds involving hydrogen atoms, with a 2 fs timestep.
4. Free energy calculations
The free energy of magainin as a function of the angular orientation of the helical axis was studied using umbrella sampling75 and the Weighted Histogram Analysis Method (WHAM).76 Briefly, the peptide was placed at a defined orientation relative to the surface, and the angle between the backbone vector and the surface normal was restrained using a biasing harmonic potential. Here, the backbone vector was defined in terms of two centers of mass for groups of backbone atoms. In order to prevent this constraint from causing artificial deformation of the structure, the backbone dihedral angles of helical residues 4–19 were held constrained.
Simulations were divided into 5° increments for sampling purposes (with an additional window at tilt=72 degrees). Each window was sampled for 3ns of dynamics, with force constants ranging from 400 kcal/mol/radian2 to 1,500 kcal/mol/radian2 (with the highest force constants required for orientation angles 70–80 degrees; for other angles, force constants of 400–600 kcal/mol/radian2 were sufficient). Data was then unbiased using the Weighted Histogram Analysis Method (WHAM)76–78 as implemented by Grossfield (http://membrane.urmc.rochester.edu/Software/WHAM/WHAM.html) in order to create a plot of free energy as a function of helix orientation angle. For these simulations, an angle of 0 degrees corresponds to the helix standing up, with the n-terminal end of the peptide closest to the surface.
Results and Discussion
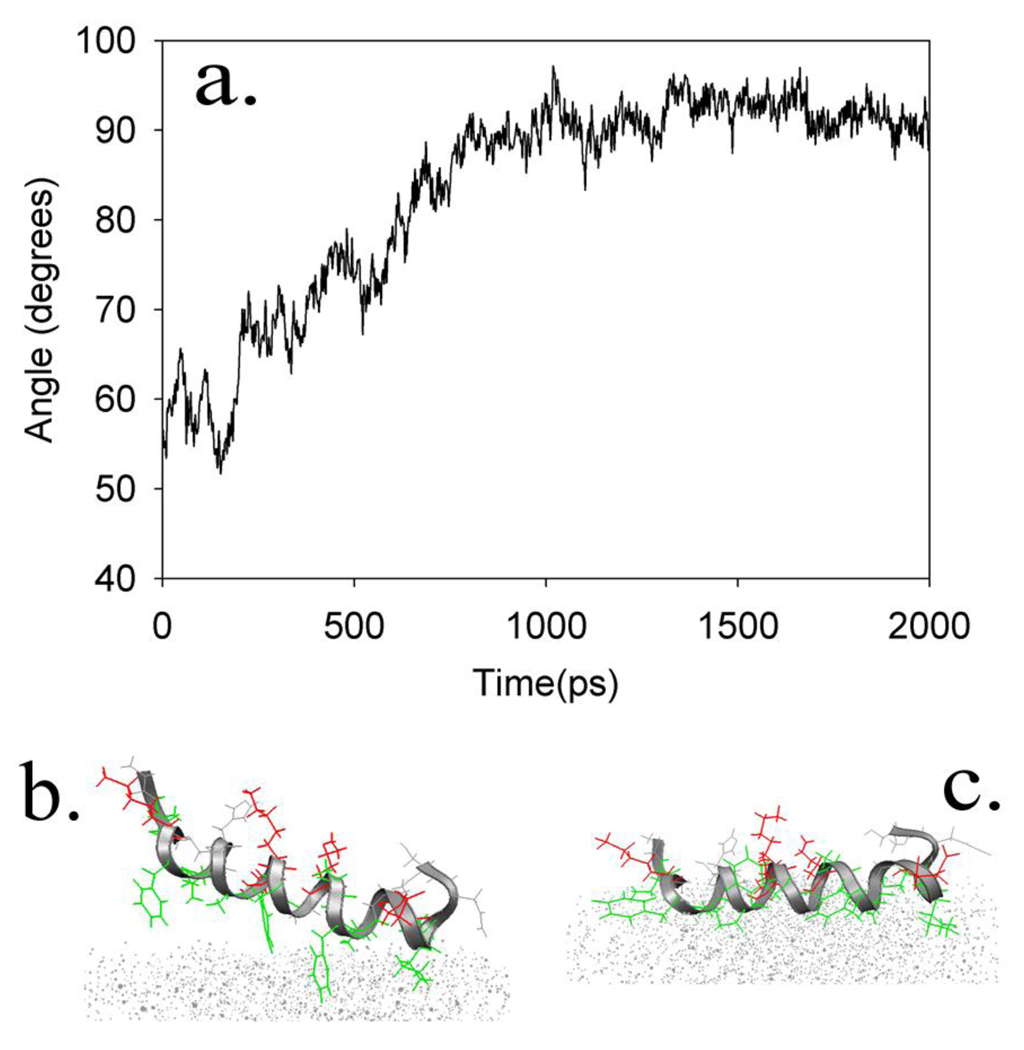
A series of exploratory molecular dynamics simulations were performed, in which magainin 2 was placed at a variety of orientations relative to the surface (perpendicular or parallel, and hydrophobic residues facing towards or away from the surface as the peptide laid parallel to the surface). In all cases, the peptide adopted the same final orientation within 10 ns, parallel to the surface with hydrophobic residues facing away from the solvent to maximize burial of hydrophobic surface area (Figure 3). During the length of the simulation, the helix backbone radius of gyration and end-to-end distance remained consistent, suggesting that secondary structure remained intact; if unfolding does occur, it is likely to occur on substantially longer timescales.79
Figure 3.
a) Change in the orientation angle from an initial orientation (tilted) to a final orientation (lying down) during a 2ns simulation, b) The peptide as it begins to lie down on the surface. (For clarity in viewing the protein, the surface is represented as an array of points); c) A characteristic final orientation of the magainin 2 peptide after 2 ns of simulation
Despite this apparent orientation preference, the limited timescales accessible to molecular dynamics simulations prevented a clear conclusion as to whether this was the overall most stable state. Furthermore, experimental studies on other peptides have demonstrated that orientation is more realistically modeled using some non-uniform distribution function; this distribution may be better understood given an estimate of the free energy difference between various orientations.
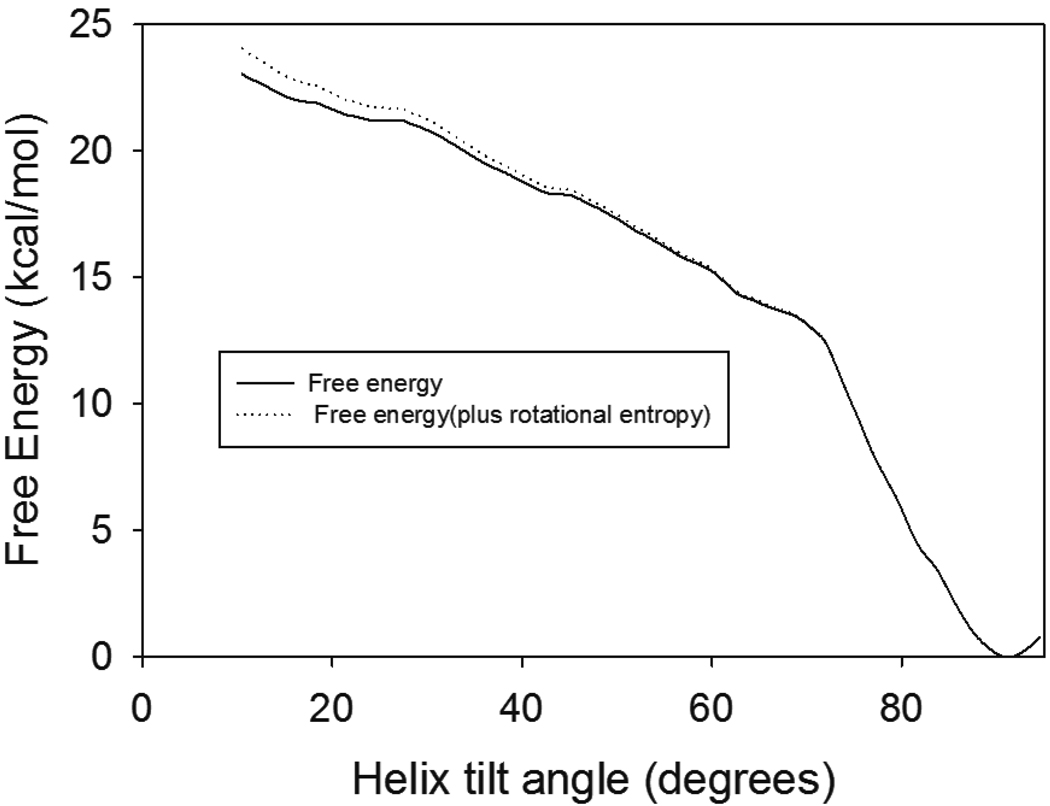
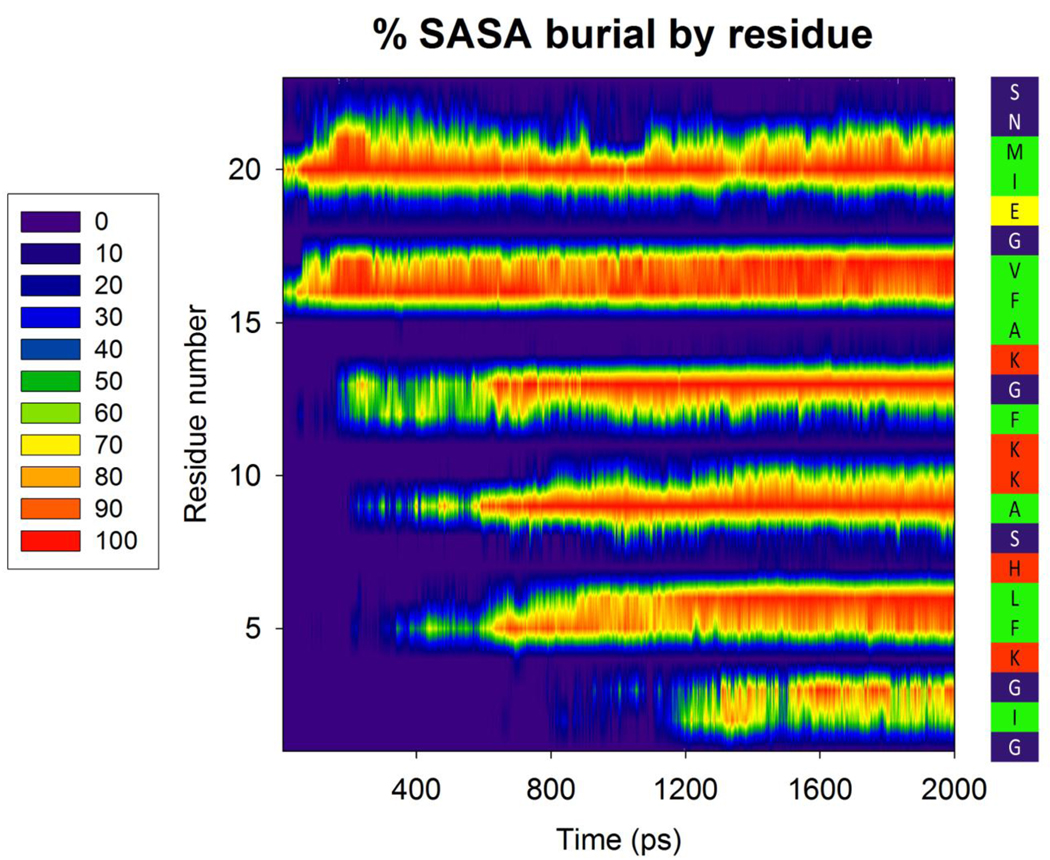
To that end, free energy sampling was performed as described above. Constraints were varied in order to provide sufficient sampling across all windows, and a free energy profile was calculated (Figure 4). The drop in free energy at high tilt angles is partially due to the extra overall rotational entropy in the azimuthal direction; this arises from changes in the volume elements sampled due to variations in solid angle. Lee and Im have derived80, 81 an analytical formula for the contribution of this rotational entropy to free energy: in the case of free rotation in the azimuthal direction, this is equal to –kT ln |sin θ|. In our simulations, the actual variation in azimuthal angle is not completely free for high tilt angles, so the change in rotational entropy is smaller; the curves shown in Figure 4 represent both the original free energy profile (which inherently includes a limited amount of azimuthal angle variation) and the free energy curve calculated by adding the entropy due to completely random azimuthal rotation. The actual curve should thus lie in between these two. Unlike the case of the transmembrane peptide studied by Lee and Im, in this case the contribution of rotational entropy has a relatively minor effect on the preferred orientation. The calculated free energy profile revealed that the preference for a horizontal peptide orientation dominates at room temperature, and that the slope (and magnitude) of the free energy change correlates reasonably well with estimates of the free energy change due to burial of hydrophobic surface area,82–84 Indeed, this horizontal orientation was only adopted when hydrophobic residues were oriented towards the surface, further suggesting that (as expected) peptide orientation is driven by burial of hydrophobic residues for this facially amphiphilic structure (Figure 5).
Figure 4.
Free Energy profile for Magainin 2 as a function of helix angle relative to the surface normal; an angle of 0 degrees corresponds to the peptide oriented perpendicular to the surface. The solid line represents the calculated free energy as a function of helix angle; the dotted line is the free energy curve with the addition of the rotational entropy term derived by Lee and Im (see text). The actual free energy curve lies somewhere between these two.
Figure 5.
Burial of hydrophobic surface area drives the final orientation of the peptide. Left and center: colors indicate the percent change in Solvent Accessible Surface Area (SASA) of each residue during a 2ns simulation, with an initial peptide orientation of 60 degrees. Sidebar, right: the peptide sequence, colored by residue type (according to the scheme in Figure 1)
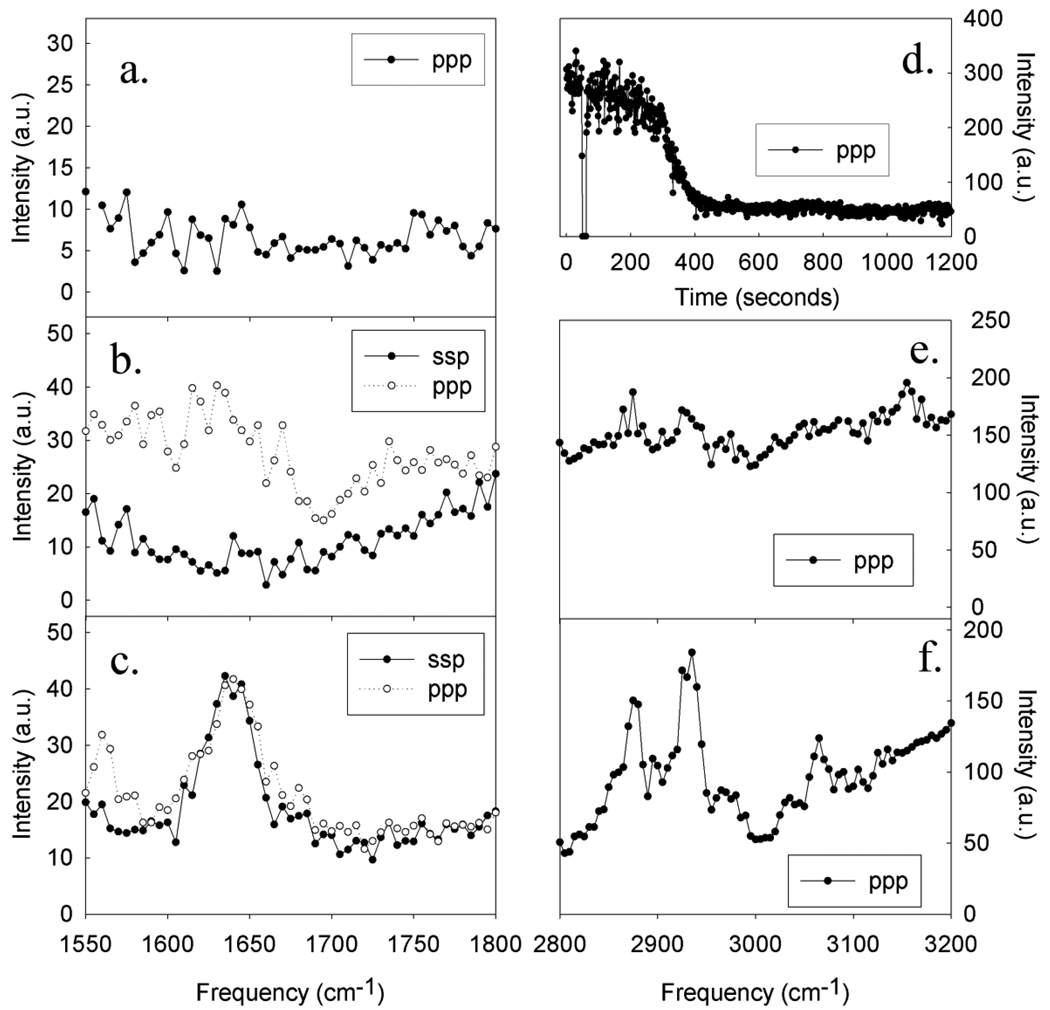
In order to determine whether our model captured important aspects of adsorption, the interface was probed experimentally using SFG spectroscopy. Spectra were collected from the PS/magainin solution interface for a range of magainin concentrations (Figure 6). At the lowest magainin concentration range, a clear reduction in interfacial water signal was observed, indicating that peptides adsorbed to the interface. For a fairly smooth polymer surface, simulation results suggest that water molecules may orient preferentially due to hydrophobic considerations;85 it is also possible that this water signal is induced by trace amounts of chemical impurities in the polymer (such as excess initiator) that impart a slight negative charge to the polymer surface.86 Regardless, the adsorption of magainin peptides to the surface results in a net disordering of water molecules and a drop in observed water signals. This reduction in water O-H stretching signals serves as an indication that peptides are adsorbing to the surface, despite the lack of observable peptide Amide I or C-H stretching signals at the lowest peptide concentration. In this case, we believe that any SFG signals generated from the interfacial peptides are below the detection limit. As the magainin concentration was increased to 400 nM, weak SFG amide I signals were observable in the ppp polarization combination, but no amide I signals were observable from the ssp polarization combination. The SFG signal intensity in the ppp polarization was several times stronger than the detection limit. Although a single ppp measurement is insufficient to characterize molecular orientation, the lack of detectable ssp signal indicates that it must be at minimum 3–4 times weaker than the ppp signals; based on our previously published methods for SFG orientation analysis for interfacial α-helical structures,15 such a minimum ratio would only be observed if the peptides were oriented at a large angle relative to the surface normal (and thus, mostly lying down). In the 400nM concentration range, weak SFG C-H stretching signals from magainin side chains were also observed, which originate from hydrophobic residues becoming ordered at the PS/solution interface.18, 29
Figure 6.
Polarized SFG spectra collected in the Amide I region from magainin 2 at the PS surface at concentrations of a) 200 nM, b) 400 nM, and c) 800 nM. d) Time-dependent ppp SFG signal at 3070 cm−1 collected from the deuterated PS/water interfaces; peptide was added at t=100 seconds to reach a concentration of 200 nM. The laser was blocked at t=70 sec to demonstrate that signal was present. Polarized SFG spectra collected in the C-H/O-H stretching frequency region from magainin 2 at concentrations of e) 400 nM, and f) 800 nM.
As peptide concentration was increased to 800nM, these C-H stretching signals became stronger; by itself, this has previously been interpreted as evidence of either increased peptide number density or increased side chain ordering towards the surface.28 However, although some general ordering can be inferred from the presence of CH signals, detailed analysis and assignment is hampered by significant spectral overlap between different amino acids. For example, the CH2 signals observed at ~2920 cm−1 could be contributed by any of 11 amino acids (7 types) present in magainin (out of 23 amino acids total). By contrast, the amide I region probes signals from the protein backbone, which are more indicative of overall molecular orientation. Indeed, at the 800 nM concentration, polarized Amide I measurements reveal a new behavior: unlike the amide I intensity ratios at lower concentrations, ppp and ssp signal intensities are very similar (fitted signal strength ratio ~0.94), and can be fitted by a single peak centered at ~1645 cm−1 (with stronger signals than were observed at lower concentrations). Due to limitations in spectral resolution, secondary structure could not be definitively assigned, but the change in intensity ratio as compared to lower concentrations can be interpreted as evidence of a change in peptide orientation or structure at the interface– showing that the interfacial behavior of magainin molecules changes as a function of peptide concentration. Furthermore, the fitted signal strength ratio (corrected for variations in fresnel coefficient) lies outside the ratios that could be explained by any single delta or Gaussian distribution of orientations; it has previously been shown that the correct ratios can however be produced if multiple orientations are adopted.9 We believe that the dependence of peptide interfacial orientation on concentration is due to peptide-peptide intermolecular interactions. When the peptide concentration increases, peptides may interact with each other in addition to interacting with the surface; these interactions may mediate the interfacial peptide orientation, and thus single-peptide simulations may not be adequately represent the real experimentally observed system. We hope that MD simulation can also provide some insights into the effect of peptide-peptide interactions, e,g, peptide aggregation, on peptide interfacial orientation.
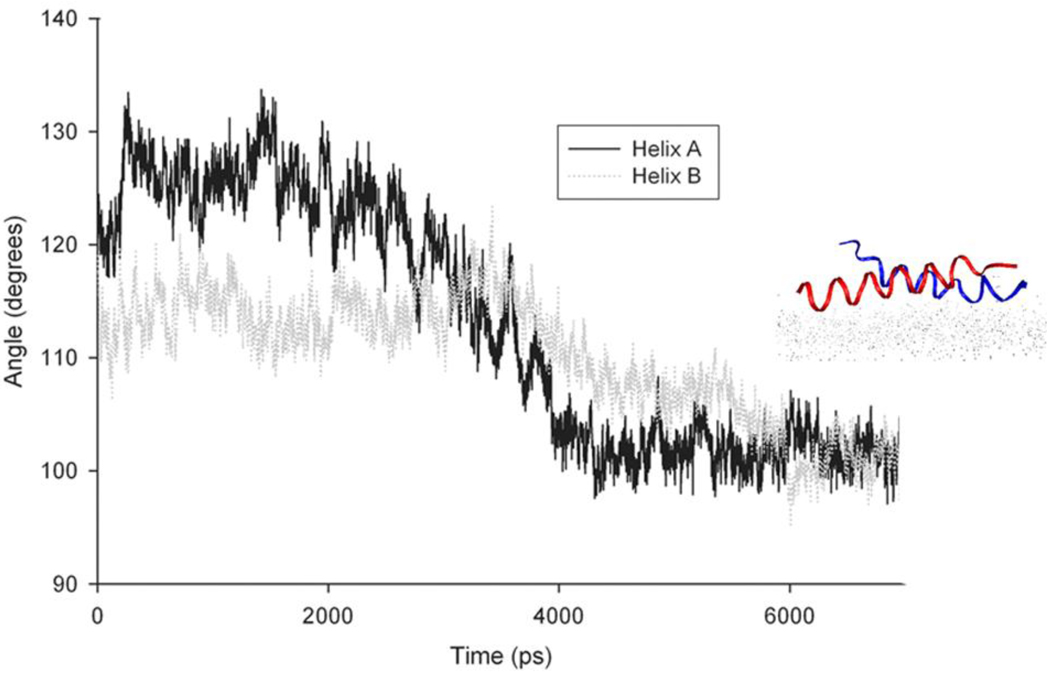
Predicting the most stable structure of multi-peptide aggregates in the presence of a surface is a non-trivial task, but as a first approximation, we employed the known structure of an existing covalently bound magainin 2 dimer (PDB ID: 1dum).87 This structure was modified to remove the covalent bond, and the resulting noncovalently interacting dimer was placed in contact with the surface. Based on our previous simulations and the observation that hydrophobic interactions were responsible for peptide adsorption, the dimer was oriented so as to maximize these hydrophobic interactions with the surface, and we monitored the evolution of the structure over the course of 7 ns of simulation. It was found that this dimer remained intact during this time, but flattened out (Figure 7). The final orientations of the individual peptides in this system were observed to be approximately 100 degrees in each case; this slight tilt allowed peptides to interact with each other as well as with the surface, but alone this simple dimer is not consistent with the SFG Amide I intensity ratios observed. Thus, it is likely that the actual peptide at the surface adopts a more complex structure. It is interesting to note that the concentration at which oligomers are observed to form in these experiments is well below the minimum inhibitory concentration (MIC) at which magainin is effective at breaking down lipid bilayers, and is in line with the concentration in which peptides are observed to insert into the bilayer;65, 88 it is believed that peptide oligomers play a role in these phenomena.87, 88 Given our experimental results, it is likely that the form in which peptides are present at the interface likely involves some type of oligomer; these oligomers must be understood to optimize the performance of biosensors, antimicrobial surfaces, or other applications that rely on interfacial peptides.
Figure 7.
Plots of the orientation angle relative to the surface normal for each helix in the dimer. A sample view of the magainin 2 dimer is shown after 7ns of simulation time.
Conclusions
Few experimental techniques are able to provide direct information on molecular orientation or proteins and peptides at solid/liquid interfaces, due to limitations in signal sensitivity, surface specificity, or in situ capability. In order to better understand the structures of adsorbed proteins and peptides, many groups have employed molecular dynamics simulations to characterize molecular structure or preferred orientation at the interface. In our experiments, we demonstrate that burial of hydrophobic surface residues strongly drives the facially amphiphilic AMP magainin 2 to lie down parallel to the surface at a hydrophobic/hydrophilic interface, and that orientation may be modulated somewhat by the formation of multipeptide dimers.
When these results are compared to concentration-dependent SFG spectra, it becomes clear that at low peptide concentration, SFG results can be correlated to MD simulation results on a single helical peptide at the interface. When the peptide concentration increases, a single helical orientation is insufficient to explain the observed SFG spectral intensity ratios. Thus, we postulate that inter-peptide interactions must be significant. However, previous simulation work by a wide variety of groups has focused on single-peptide simulations. We believe that greater attention to inter-peptide interactions will reveal a new layer of complexity that is necessary to describe how even relatively simple peptides interact with the polymer surface.
Acknowledgements
The authors are grateful to Jeremiah Nummela and Khoi Nguyen for numerous helpful discussions, as well as Dr. Jeff Wereszczynski and Dr. Shuji Ye for technical assistance. Computing resources were provided by the Center for Advanced Computing at the University of Michigan. This work was supported in part by grants NIH (1R01GM081655-01A2) and ONR (N00014-08-1-1211) to ZC, NSF Career award to IA (CHE-0918817) as well as the US Department of Education Graduate Assistantships in Areas of National Need (GAANN).
References
- 1.Gray JJ. Curr. Op. Struct. Biol. 2004;14:110–115. doi: 10.1016/j.sbi.2003.12.001. [DOI] [PubMed] [Google Scholar]
- 2.Yebra DMeseguer, Kiil S, Dam-Johansen K. Prog. Org. Coat. 2004;50:75–104. [Google Scholar]
- 3.Lee JM, Park HK, Jung Y, Kim JK, Jung SO, Chung BH. Anal. Chem. 2007;79:2680–2687. doi: 10.1021/ac0619231. [DOI] [PubMed] [Google Scholar]
- 4.Holland-Nell K, Beck-Sickinger AG. ChemBioChem. 2007;8:1071–1076. doi: 10.1002/cbic.200700056. [DOI] [PubMed] [Google Scholar]
- 5.Hallock KJ, Lee D-K, Ramamoorthy A. Biophys. J. 2003;84:3052–3060. doi: 10.1016/S0006-3495(03)70031-9. [DOI] [PMC free article] [PubMed] [Google Scholar]
- 6.Tatulian SA. Biochemistry. 2003;42:11898–11907. doi: 10.1021/bi034235+. [DOI] [PubMed] [Google Scholar]
- 7.Maste MCL, Pap EHW, van HArie, Norde W, Visser AJWG. J. Colloid Interface Sci. 1996;180:632–633. doi: 10.1006/jcis.1997.5205. [DOI] [PubMed] [Google Scholar]
- 8.Chen X, Boughton AP, Tesmer JJG, Chen Z. J. Am. Chem. Soc. 2007;129:12658–12659. doi: 10.1021/ja075542w. [DOI] [PubMed] [Google Scholar]
- 9.Chen X, Wang J, Boughton AP, Kristalyn CB, Chen Z. J. Am. Chem. Soc. 2007;129:1420–1427. doi: 10.1021/ja067446l. [DOI] [PubMed] [Google Scholar]
- 10.Chen X, Clarke ML, Wang J, Chen Z. Int. J. Mod. Phys. B. 2005;19:691–713. [Google Scholar]
- 11.Chen X, Wang J, Paszti Z, Wang F, Schrauben JN, Tarabara VV, Schmaier AH, Chen Z. Anal. Bioanal. Chem. 2007;388:65–72. doi: 10.1007/s00216-006-0999-8. [DOI] [PubMed] [Google Scholar]
- 12.Chen X, Wang J, Sniadecki JJ, Even MA, Chen Z. Langmuir. 2005;21:2662–2664. doi: 10.1021/la050048w. [DOI] [PubMed] [Google Scholar]
- 13.Even MA, Wang J, Chen Z. Langmuir. 2008;24:5795–5801. doi: 10.1021/la800138x. [DOI] [PubMed] [Google Scholar]
- 14.Le Clair SV, Nguyen K, Chen Z. J. Adhesion. 2009;85:484–511. doi: 10.1080/00218460902996374. [DOI] [PMC free article] [PubMed] [Google Scholar]
- 15.Nguyen KTan, Le Clair SV, Ye S, Chen Z. J. Phys. Chem B. 2009;113:12169–12180. doi: 10.1021/jp904153z. [DOI] [PMC free article] [PubMed] [Google Scholar]
- 16.Pászti Z, Wang J, Clarke ML, Chen Z. J. Phys. Chem. B. 2004;108:7779–7787. [Google Scholar]
- 17.Wang J, Buck SM, Chen Z. J. Phys. Chem. B. 2002;106:11666–11672. [Google Scholar]
- 18.Wang J, Chen X, Clarke ML, Chen Z. J. Phys. Chem. B. 2006;110:5017–5024. doi: 10.1021/jp0534683. [DOI] [PubMed] [Google Scholar]
- 19.Wang J, Clarke ML, Chen X, Even MA, Johnson WC, Chen Z. Surf. Sci. 2005;587:1–11. [Google Scholar]
- 20.Wang J, Even MA, Chen X, Schmaier AH, Waite JHerbert, Chen Z. J. Am. Chem. Soc. 2003;125:9914–9915. doi: 10.1021/ja036373s. [DOI] [PubMed] [Google Scholar]
- 21.Wang J, Lee S-H, Chen Z. J. Phys. Chem. B. 2008;112:2281–2290. doi: 10.1021/jp077556u. [DOI] [PubMed] [Google Scholar]
- 22.Ye S, Nguyen KT, Le Clair SV, Chen Z. J. Struct. Biol. 2009;168:61–77. doi: 10.1016/j.jsb.2009.03.006. [DOI] [PMC free article] [PubMed] [Google Scholar]
- 23.Chen X, Sagle LB, Cremer PS. J. Am. Chem. Soc. 2007;129:15104–15105. doi: 10.1021/ja075034m. [DOI] [PMC free article] [PubMed] [Google Scholar]
- 24.Kim J, Koffas TS, Lawrence CC, Somorjai GA. Langmuir. 2004;20:4640–4646. doi: 10.1021/la0498511. [DOI] [PubMed] [Google Scholar]
- 25.Kim J, Somorjai GA. J. Am. Chem. Soc. 2003;125:3150–3158. doi: 10.1021/ja028987n. [DOI] [PubMed] [Google Scholar]
- 26.Koffas TS, Kim J, Lawrence CC, Somorjai GA. Langmuir. 2003;19:3563–3566. [Google Scholar]
- 27.Mermut O, Phillips DC, York RL, McCrea KR, Ward RS, Somorjai GA. J. Am. Chem. Soc. 2006;128:3598–3607. doi: 10.1021/ja056031h. [DOI] [PubMed] [Google Scholar]
- 28.Phillips DC, York RL, Mermut O, McCrea KR, Ward RS, Somorjai GA. J. Phys. Chem. C. 2007;111:255–261. [Google Scholar]
- 29.York RL, Browne WK, Geissler PL, Somorjai GA. Israel J. Chem. 2007;47:51–58. [Google Scholar]
- 30.Jung SY, Lim SM, Albertorio F, Kim G, Gurau MC, Yang RD, Holden MA, Cremer PS. J. Am. Chem. Soc. 2003;125:12782–12786. doi: 10.1021/ja037263o. [DOI] [PubMed] [Google Scholar]
- 31.Kim G, Gurau M, Kim J, Cremer PS. Langmuir. 2002;18:2807–2811. [Google Scholar]
- 32.Kim G, Gurau MC, Lim S-M, Cremer PS. J. Phys. Chem. B. 2003;107:1403–1409. [Google Scholar]
- 33.Dreesen L, Humbert C, Sartenaer Y, Caudano Y, Volcke C, Mani AA, Peremans A, Thiry PA, Hanique S, Frere JM. Langmuir. 2004;20:7201–7207. doi: 10.1021/la0488001. [DOI] [PubMed] [Google Scholar]
- 34.Dreesen L, Sartenaer Y, Humbert C, Mani AA, Lemaire JJ, Méthivier C, Pradier CM, Thiry PA, Peremans A. Thin Solid Films; Proceedings of the 7th International Symposium on Atomically Controlled Surfaces, Interfaces and Nanostructures; 2004. pp. 464–465. 373–378. [Google Scholar]
- 35.Dreesen L, Sartenaer Y, Humbert C, Mani AA, Méthivier C, Pradier C-M, Thiry PA, Peremans A. ChemPhysChem. 2004;5:1719–1725. doi: 10.1002/cphc.200400213. [DOI] [PubMed] [Google Scholar]
- 36.Evans-Nguyen KM, Fuierer RR, Fitchett BD, Tolles LR, Conboy JC, Schoenfisch MH. Langmuir. 2006;22:5115–5121. doi: 10.1021/la053070y. [DOI] [PubMed] [Google Scholar]
- 37.Doyle AW, Fick J, Himmelhaus M, Eck W, Graziani I, Prudovsky I, Grunze M, Maciag T, Neivandt DJ. Langmuir. 2004;20:8961–8965. doi: 10.1021/la0484220. [DOI] [PubMed] [Google Scholar]
- 38.Weidner T, Apte JS, Gamble LJ, Castner DG. Langmuir. 2009;26:3433–3440. doi: 10.1021/la903267x. [DOI] [PMC free article] [PubMed] [Google Scholar]
- 39.Weidner T, Samuel NT, McCrea K, Gamble LJ, Ward RS, Castner DG. Biointerphases. 2010;5:9–16. doi: 10.1116/1.3317116. [DOI] [PMC free article] [PubMed] [Google Scholar]
- 40.Edholm O, Jahning F. Biophys. Chem. 1988;30:279–292. doi: 10.1016/0301-4622(88)85023-3. [DOI] [PubMed] [Google Scholar]
- 41.Kandasamy SK, Larson RG. Chem. Phys. Lipids. 2004;132:113–132. doi: 10.1016/j.chemphyslip.2004.09.011. [DOI] [PubMed] [Google Scholar]
- 42.Wilson K, Stuart SJ, Garcia A, Latour RA., Jr J. Biomed. Mat. Res. A. 2004;69A:686–698. doi: 10.1002/jbm.a.30042. [DOI] [PubMed] [Google Scholar]
- 43.Braun R, Sarikaya M, Schulten K. J Biomater Sci Polym Ed. 2002;13:747–757. doi: 10.1163/156856202760197384. [DOI] [PubMed] [Google Scholar]
- 44.Cormack AN, Lewis RJess, Goldstein AL. J. Phys. Chem. B. 2004;108:20408–20418. [Google Scholar]
- 45.Lee SJ, Park K. J. Vac. Sci. Technol. A. 1994;12:2949–2955. [Google Scholar]
- 46.Zhou J, Tsao H-K, Sheng Y-J, Jiang S. J. Chem. Phys. 2004;121:1050–1057. doi: 10.1063/1.1757434. [DOI] [PubMed] [Google Scholar]
- 47.Knotts TA, IV, Rathore N, de Pablo JJ. Proteins: Struct., Funct., Bioinf. 2005;61:385–397. doi: 10.1002/prot.20581. [DOI] [PubMed] [Google Scholar]
- 48.Ganazzoli F, Raffaini G. PCCP. 2005;7:3651–3663. doi: 10.1039/b506813d. [DOI] [PubMed] [Google Scholar]
- 49.Raffaini G, Ganazzoli F. PCCP. 2006;8:2765–2772. doi: 10.1039/b604540e. [DOI] [PubMed] [Google Scholar]
- 50.Raffaini G, Ganazzoli F. J. Mat. Sci: Mat. in Med. 2007;18:309–316. doi: 10.1007/s10856-006-0694-5. [DOI] [PubMed] [Google Scholar]
- 51.Liu SM, Haynes CA. J. Colloid Interface Sci. 2004;275:458–469. doi: 10.1016/j.jcis.2004.02.075. [DOI] [PubMed] [Google Scholar]
- 52.Euston SR. Curr. Op. Colloid Interface Sci. 2004;9:321–327. [Google Scholar]
- 53.Clancy TC, Jang J, Hwan, Dhinojwala A, Mattice WL. J. Phys. Chem. B. 2001;105:11493–11497. [Google Scholar]
- 54.Lee H, Larson RG. Molecules. 2009;14:423–438. doi: 10.3390/molecules14010423. [DOI] [PMC free article] [PubMed] [Google Scholar]
- 55.Levy Y, Onuchic JN. PNAS. 2004;101:3325–3326. doi: 10.1073/pnas.0400157101. [DOI] [PMC free article] [PubMed] [Google Scholar]
- 56.Lambert AG, Davies PB, Neivandt DJ. App. Spec. Rev. 2005;40:103. [Google Scholar]
- 57.Shen YR. Nature. 1989;337:519–525. [Google Scholar]
- 58.Hirose C, Akamatsu N, Domen K. App. Spec. 1992;46:1051–1072. [Google Scholar]
- 59.Wang J, Buck SM, Even MA, Chen Z. J. Am. Chem. Soc. 2002;124:13302–13305. doi: 10.1021/ja026881m. [DOI] [PubMed] [Google Scholar]
- 60.Wang J, Chen C, Buck SM, Chen Z. J. Phys. Chem. B. 2001;105:12118–12125. [Google Scholar]
- 61.Wang J, Clarke ML, Zhang Y, Chen X, Chen Z. Langmuir. 2003;19:7862–7866. [Google Scholar]
- 62.Clarke ML, Wang J, Chen Z. J. Phys. Chem. B. 2005;109:22027–22035. doi: 10.1021/jp054456k. [DOI] [PubMed] [Google Scholar]
- 63.Chen X, Chen Z. Biochim. Biophys. Acta. 2006;1758:1257–1273. doi: 10.1016/j.bbamem.2006.01.017. [DOI] [PubMed] [Google Scholar]
- 64.Chen X, Wang J, Kristalyn CB, Chen Z. Biophys. J. 2007;93:866–875. doi: 10.1529/biophysj.106.099739. [DOI] [PMC free article] [PubMed] [Google Scholar]
- 65.Nguyen KT, Le Clair SV, Ye S, Chen Z. J. Phys. Chem. B. 2009;113:12358–12363. doi: 10.1021/jp904154w. [DOI] [PMC free article] [PubMed] [Google Scholar]
- 66.Ayyagari C, Bedrov D, Smith GD. Macromolecules. 2000;33:6194–6199. [Google Scholar]
- 67.Khare R, Paulaitis ME, Lustig SR. Macromolecules. 1993;26:7203–7209. [Google Scholar]
- 68.Sun Y, Welsh WJ, Latour RA. Langmuir. 2005;21:5616–5626. doi: 10.1021/la046932o. [DOI] [PubMed] [Google Scholar]
- 69.Yang CS-C, Wilson PT, Richter LJ. Macromolecules. 2004;37:7742–7746. [Google Scholar]
- 70.Jorgensen WL, Chandrasekhar J, Madura JD. J. Chem. Phys. 1983;79:926–935. [Google Scholar]
- 71.Belch AC, Berkowitz M. Chem. Phys. Lett. 1985;113:278–282. [Google Scholar]
- 72.Wang L, Hermans J. Molec. Sim. 1996;17:67–74. [Google Scholar]
- 73.Brooks B, Bruccoleri R, Olafson B, States D, Swaminathan S, Karplus M. J. Comp. Chem. 1983;4:187–217. [Google Scholar]
- 74.MacKerell AD, Jr, Bashford D, Bellott M, Dunbrack RL, Jr, Evanseck JD, Field MJ, Fischer S, Gao J, Guo H, Ha S, Joseph-McCarthy D, Kuchnir L, Kuczera K, Lau FTK, Mattos C, Michnick S, Ngo T, Nguyen DT, Prodhom B, Reiher WE, III, Roux B, Schlenkrich M, Smith JC, Stote R, Straub J, Watanabe M, Wiórkiewicz-Kuczera J, Yin D, Karplus M. J. Phys. Chem. B. 1998;102:3586–3616. doi: 10.1021/jp973084f. [DOI] [PubMed] [Google Scholar]
- 75.Torrie GM, Valleau JP. J. Comput. Phys. 1977;23:187–199. [Google Scholar]
- 76.Kumar S, Bouzida D, Swendsen RH, Kollman PA, Rosenberg JM. J. Comp. Chem. 1992;13:1011–1021. [Google Scholar]
- 77.Boczko EM, Brooks CL., III J. Phys. Chem. 1993;97:4509–4513. [Google Scholar]
- 78.Roux B. Comp. Phys. Commun. 1995;91:275–282. [Google Scholar]
- 79.Kuczera K, Jas GS, Elber R. J. Phys. Chem. A. 2009;113:7461–7473. doi: 10.1021/jp900407w. [DOI] [PMC free article] [PubMed] [Google Scholar]
- 80.Lee J, Im W. Chem. Phys. Lett. 2007;441:132–135. [Google Scholar]
- 81.Lee J, Im W. Phys. Rev. Lett. 2008;100 doi: 10.1103/PhysRevLett.100.018103. 018103. [DOI] [PubMed] [Google Scholar]
- 82.Vallone B, Miele AE, Vecchini P, Chiancone E, Brunori M. PNAS. 1998;95:6103–6107. doi: 10.1073/pnas.95.11.6103. [DOI] [PMC free article] [PubMed] [Google Scholar]
- 83.Lee B, Richards FM. J. Mol. Biol. 1971;55:379–400. doi: 10.1016/0022-2836(71)90324-x. [DOI] [PubMed] [Google Scholar]
- 84.Lum K, Chandler D, Weeks JD. J. Phys. Chem. B. 1999;103:4570–4577. [Google Scholar]
- 85.Lee C-Y, McCammon J, Andrew, Rossky PJ. J. Chem. Phys. 1984;80:4448–4455. [Google Scholar]
- 86.Stone-Masui J, Watillon A. J. Colloid Interface Sci. 1975;52:479–503. [Google Scholar]
- 87.Wakamatsu K, Takeda A, Tachi T, Matsuzaki K. Biopolymers. 2002;64:314–327. doi: 10.1002/bip.10198. [DOI] [PubMed] [Google Scholar]
- 88.Mukai Y, Matsushita Y, Niidome T, Hatekeyama T, Aoyagi H. J. Pept. Sci. 2002;8:570–577. doi: 10.1002/psc.416. [DOI] [PubMed] [Google Scholar]


