

Abstract
The number of targeted small molecules being developed in oncology is increasing rapidly. Many of these are designed to inhibit multiple kinases so mechanisms of responsiveness and predictive biomarkers can be difficult to discern. In fact, with few exceptions, multi-kinase inhibitors are developed with limited mechanism-based patient selection. Enzastaurin is a multi-kinase inhibitor being studied in several malignancies that we hypothesized would be active in squamous cell carcinoma of the head and neck (SCCHN) since it inhibits classic and novel protein kinase C isoforms. Indeed, enzastaurin reduced growth of SQ-20B and CAL27 tumor xenografts, decreased proliferation in these cell lines, inhibited putative target phosphorylation, and induced cell cycle arrest. Gene expression arrays confirmed that expression of cell cycle genes, including cyclins D and E, were significantly altered by exposure to enzastaurin. However, testing a panel of SCCHN cell lines revealed variable sensitivity to enzastaurin which correlated significantly with baseline cyclin D1 protein expression. Moreover, sensitivity and resistance could be reversed, respectively, by expression or depletion of cyclin D1. Furthermore, analysis of sensitive and resistant cell lines revealed distinct differences in cyclin D1 regulation. Enzastaurin modulated cyclin D1 synthesis via an AKT regulated pathway in the former while high level CCND1 gene amplification was present in the latter. These results underscore the critical relevance of cellular signaling context in developing cancer therapies, in general, and suggest that enzastaurin, in particular, would be most effective in tumors where baseline cyclin D1 expression is low to moderate and physiologically regulated.
Keywords: Head and Neck Cancer, Cyclin D1, AKT, AGC kinases
Introduction
Molecularly targeted therapy has changed the landscape of oncology drug development and in some cancers has made a tremendous impact on survival (1). However, a continuing challenge, especially with agents that target several kinases simultaneously, is gaining an appreciation of the mechanisms underlying sensitivity which, in turn, should lead to improved patient selection for specific drugs.
Our previous work in squamous cell carcinoma of the head and neck (SCCHN) cell lines has demonstrated that specific protein kinase C (PKC) isoforms are critical mediators of SCCHN growth and valid therapeutic targets (2-4) but, until recently, there has been a paucity of agents that effectively target PKC. Enzastaurin is an acyclic bisindolylmaleimide that displays potent selective inhibition of classic and novel PKC isoforms and other AGC kinases as well as inducing apoptosis, suppressing proliferation, and inhibiting tumor xenograft growth in other tumor models (5-10).
Therefore, we undertook studies exploring the activity of enzastaurin in SCCHN in vitro and in vivo and discovered variability in responsiveness to the agent which was inversely associated with baseline cyclin D1 expression. In addition, enzastaurin suppressed cyclin D1 synthesis at least partially by inhibiting AKT but only in sensitive cells. These findings underscore the critical relevance and complex nature of deciphering mechanisms of sensitivity and resistance in cancer models during drug development. Furthermore, our results suggest that tumor cyclin D1 expression should be explored as a predictive biomarker of enzastaurin efficacy in clinical trials.
Material and Methods
Cell lines and reagents
CAL27 and HEK293t cells were purchased from American Tissue Culture Collection (Manassas, VA). SQ-20B, SCC25, SCC35, and SCC-61 cells were provided by Dr. Ralph Weichselbaum, University of Chicago. HN5 cells were provided by the Ludwig Institute for Cancer Research (London, UK). HN-31 and MSK921cells were provided by Dr. David Raben, University of Colorado Cancer Center. OSCC3 cells were provided by Dr. Mark Lingen, University of Chicago. General characteristics of all cell lines used were monitored by checking cell morphology microscopically, measuring doubling time of each cell line, and confirming no microorganism contamination. No authentication was done by the authors.
Phospho-Akt (Ser473), phospho-p70 S6 Kinase (Thr389), phospho-GSK-3beta (Ser9), phospho-MARCKS (Ser152/156), Akt1, Akt2, Akt3 antibodies were purchased from Cell Signaling Technology Inc (Danvers, MA). Antibodies against α- tubulin (sc-8035) and cyclin D2 were purchased from Santa Cruz Biotechnology (Santa Cruz, CA). Cyclin D1 (NB 600-584) was purchased from Novus Biologicals, Inc. (Littleton, CO). IRDye 800 conjugated affinity purified anti-mouse IgM Mu chain specific antibody was purchased from Rockland Immunochemical for Research (Gilbertsville, PA). Other IRDye secondary antibodies were purchase from Li-Cor Bioscineces (Lincoln, NE). Rapamycin and LY290024 were purchased from Cell Signaling Technology Inc. Enzastaurin was provided by Eli Lilly and Company (Indianapolis, IN).
Cyclin D1 expression vector, pCDH-CMV-D1-MCS-EF1-puro, and shRNA-D1 lentiviral vectors
Full-length human cyclin D1 cDNA clone in pOTB7 vector was purchased from Open Biosystems (Huntsville, AL). The vector was digested with EcoRI and Bgl II and the cyclin D1 fragment was purified and inserted in between EcoR I and BamH1 in pCDH-CMV-MSC-pEF1-puro, a lentiviral vector. A set of pLKO.1 lentiviral vectors containing shRNA targeting D1 was purchased from Open Biosystems. The RHS3979-9604728 clone was used for the D1 knockdown experiments. A non-target shRNA control vector for shRNA D1 vector was purchased from Sigma (St. Louis, MO). Lentivirus production and viral infection were done as previously described (4).
siRNA Transfection
Small interfering RNA (siRNA) duplexes were purchased from Ambion (Austin, TX) targeting Akt1 (ID# s649) and Akt2 (ID# s1215). Negative Control #1 siRNA was used as control. siRNAs (30 μM per 100 μl transfection solution) were electroporated using Lonza’s Nucleofector and the Cell Line Neucleofection kit V (Walkersville, MD). 3 millions cells were transfected with respective siRNA and 24 hours after transfection, cells were replated into 60 mm dishes, serum-starved for 2 days, and then treated with serum for indicated times.
Expression of constitutively active Akt1 in SCCHN cell lines
Constitutively active Akt1, 1036pcDNA3MyrHA-Akt1 was purchased from Addgene Inc (Cambridge, MA). Bacterial host containing pcDNA3MyrHA-AKt1 was amplified and purified and cells were transfected with 5 μg of plasmid DNA or equal amount of a control, empty vector, with Lanzo’s Nucleofector systems.
Cell cycle analysis
Promidium Iodide (PI) staining was performed after cells were harvested and fixed in 70% ethanol. Fixed cells were washed in PBS and centrifuged at 2200 rpm for 10 min. Cells were resuspended in 4.5 ml PBS and 0.5 ml of RNase A (1 mg/ml) was added to the suspension. After 30 minutes of incubation at 37°C, cells were washed with PBS. Cells were counted and resuspended in PI (10 mg/100 ml in PBS) for 30 minutes on ice. The final cell concentration was approximately 1 million cells/ml. PI-stained cells were analyzed for DNA content with a Becton Dicknson FACScan flow cytometer. Cell sorting results were analyzed with FlowJo Software using a cell cycle platform and Watson’s Pragmatic Model to calculate the distribution of cells in G0, G1 and G2 stages.
BrdU proliferation assay
BrdU proliferation assay kit (EMD Biosciences, San Diego, CA) was used for all experiments according to manufacturer instructions with specific modifications as previously described (3, 4).
Cell viability assay
96-well dishes were seeded with 1000-2000 cells per well. Cells were treated or not treated with enzastaurin (2.5 μM) for 24 to 48 hours. CellTiter-Blue reagent (Promega, Madison, WI) was added to medium, and the reaction stopped after 1 to 5 hours of incubation. Fluorescence (530Ex/590Em) was measured and recorded using Bio Tek plate reader (Winooski, VT).
Protein immunoblot analysis
Cell lysis, protein concentration, separation, and transfer were determined as previously described (3). Membranes were blocked using blocking buffer (Li-Cor Biosciences, Lincoln, NE). Secondary antibodies were infrared-labeled. Odyssey Infrared Imaging system (Li-Cor Biosciences, Lincoln, NB) was used for protein detection and quantification.
Gene expression microarray
CAL27 cells grown on 100-mm dishes were washed with PBS and cultured in DMEM without serum for 48 hours to synchronize the cell cycle. Enzastaurin was added to a final concentration of 2.5 μM with 10% fetal bovine serum. An equivalent volume of DMSO was added to control cultures. 24 hours after enzastaurin treatment, total RNA was purified with TRIzol (Invitrogen, Carlsbad, CA) following manufacturer instructions. Total RNA was further purified using RNeasy Mini kit (Qiagen, Valencia, CA). Quality of purified RNA was checked with the Agilent 2100 Bioanalyzer then labeled with fluorescent dye and hybridized to Agilent-14850 Whole Human Genome Microarrays 4×44K G4112F. Microarray was performed in the Functional Genomic Facility, University of Chicago. Triplicate samples from each treatment were hybridized to triplicate chips. Data were analyzed using the dCHIP (11) and Gene Microarray Pathway Profiler (GenMAPP) (12) programs.
Growth of Human Tumor Xenografts
SQ-20B (5 × 10⁶) or CAL27 (1 × 10⁷) cells were injected subcutaneously into the right hind limb of female athymic nude mice (Frederick Cancer Research Institute, Frederick, MD) as previously described (4). Xenografts (n=8 in each group) were grown for 2–3 weeks and tumor volume was determined by direct measurement with calipers and calculated using the equation l × W2 × 0.5(4). Animals were sorted into treatment groups, such that the mean tumor volume was 300 mm3 (SQ-20B) or 100-150mm3 (CAL27). Mice were treated with D5W (control) or enzastaurin at 100 mg/kg twice daily by oral gavage without interruption and were sacrificed at the end of the experiment, if any animal lost >20% body weight, appeared to be suffering, or tumor size exceeded 2000mm3.
Quantitative real-time PCR
RNA was isolated as previously described (4). Genomic DNA was purified with Qiagene Genomic tip 100/G columns (#10243) following manufacturer protocols. Cyclin D1 gene copy differences among cell lines were determined by qRT-PCR performed on a StepOnePlus machine (Applied Biosystems) using Power SYBR Green PCR Master mix (P/N 4367659). Cyclin D1 copy number was normalized to LINE-1. Conditions for the amplification were one cycle of 95°C for 10 minutes, followed by 40 cycles of 95°C for 15 seconds, 60°C for 1 minute. Threshold cycle numbers were determined automatically with the Applied Biosystems software initially and then checked manually. Cyclin D1 gene copy number determined from all cell lines was normalized to CAL27. Cyclin D1 gene primers were forward 5′–ACG AGC TCG TGT GCT GCG AGG TG and reverse 5′-GAC GGC AGG ACC TCC TTC TGC ACA.
Protein Stability Assay
Cells were cultured to approximately 50% confluence, serum-starved for 24 hours, and treated with cycloheximide (50 μg/ml) in serum-containing medium as indicated.
In MG132 experiments cells were cultured on 60-mm dishes to approximately 40% confluence and transferred to serum-free media. After 24 hours cells were treated with complete media containing enzastaurin (2.5μM) or DMSO. 18 hours later 50 μM MG132 was added then 3 and 7 hours later cells were harvested.
Results
Growth and proliferation of SCCHN cell lines inhibited by enzastaurin
To determine whether enzastaurin is effective in vivo we chose SQ-20B and CAL27 cell lines based on our previous work with Gö6976, a PKC inhibitor, or rapamycin, which demonstrate tumor growth inhibition [(4) and manuscript submitted]. SQ-20B and CAL27 cells were grown as hind-limb xenografts and tumors were treated with vehicle control or enzastaurin alone (Figure 1A and B). Enzastaurin significantly reduced tumor growth in both SCCHN models. Since other PKC inhibitors exhibit an anti-proliferative effect in SCCHN cell lines, we investigated whether enzastaurin would inhibit proliferation in SQ-20B and CAL27 cells using the BrdU incorporation assay. Exposure for 24 hours to increasing concentrations of enzastaurin (Figure 1C) caused inhibition of proliferation at concentrations similar to that of tumor models (13-15). Furthermore, propidium iodide staining and cytometry to determine relative DNA content in CAL27 cells revealed a higher fraction of enzastaurin-treated cells in S-phase compared to untreated controls (46% vs. 36%, Figure 1D) at 24 hours. Interestingly, in SCC35 cells which are resistant to enzastaurin (see below), no shift in cell cycle phase was observed. Therefore, in SQ-20B and CAL27 tumors, enzastaurin produced tumor growth delay, decreased proliferation and, in CAL27 cells, cell cycle arrest.
Figure 1. Activity of enzastaurin in SCCHN.
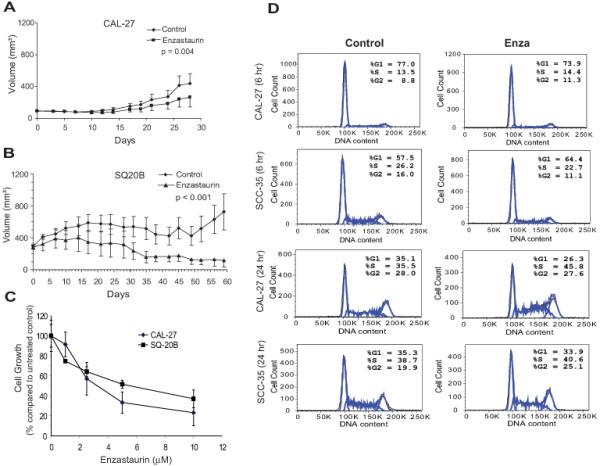
A) CAL27 and B) SQ-20B tumor xenografts were established in female athymic mice. Day 0 represents the first day of therapy. Values represent mean tumor size +/− S.E. Student’s t-test was used to determine statistical significance. C) CAL27 and SQ-20B cell lines were cultured with enzastaurin at different concentrations. Percentage of cell growth was calculated as percentage of BrdU incorporation of enzastaurin-treated to untreated cells. Results were determined from quadruplicates and shown as mean +/− S.E. D) CAL27 and SCC35 cells were treated with 2.5 μM enzastaurin for the times indicated. DNA content by flow cytometery of 2N and 4N correspond to G1-phase and G2-phase, respectively. Results are expressed as percentage of total cells in each phase of the cell cycle and are representative of three independent experiments.
Specific changes in gene expression after enzastaurin treatment
The chemical structure of enzastaurin is shown in Figure 2A. To identify the effects of enzastaurin on gene expression, CAL27 cells were incubated with enzastaurin (2.5 μM) or DMSO for 24 hours and total RNA was extracted, purified, labeled, and hybridized to Agilent Whole Human Genome Microarrays.. Expression data were analyzed with the dCHIP computer program (11) by comparing control and enzastaurin groups with a relative difference threshold of ≥1.5-fold, absolute intensity difference between enzastaurin and control samples >50, and permutation P-value < 0.05. Approximately 4500 genes were identified from this screen, and among these, 75% were up-regulated and 25% down-regulated. These genes were further analyzed with the GenMAPP computer program (12). The number of genes used in GenMAPP analysis was 2,675. There were 2,013 genes linked to a pathway and 1662 genes meeting the criterion that was set at fold change ≥ 1.5 or ≤ −1.5, and permute P value < 0.05 in finding a MAPP.
Figure 2. Cell cycle genes are regulated in CAL27 cells treated with enzastaurin.

A) Chemical structure of enzastaurin hydrochloride listed in the PubChem database:http://pubchem.ncbi.nlm.nih.gov. B) Heat map of selected cell cycle genes from the gene expression array. C, left) D1and D2 transcripts in CAL27 cells quantified by qRT-PCR. C, right) Protein immunoblots of cyclin D1 and D2 proteins in CAL27 cells. Representative results are shown from at least three independent experiments.
The identification of “Cell Cycle G1 to S Control” gene set (Supplemental Figure 1 and Supplemental Table 1) as one with significantly altered expression levels in CAL27 upon exposure to enzastaurin was consistent with our earlier work with the classic PKC inhibitor, Gö6976 (4). Among the identified enzastaurin down-regulated genes in the pathway were CCND1, CCND2, CCNE1, and E2F2 (Supplemental Table 2). A heat-map representing the microarray results focusing on cell cycle genes (Figure 2B) demonstrates that a number of key cell cycle genes appear to be regulated by enzastaurin many of which were confirmed by both RT-PCR and protein immunoblotting including cyclins D1 and D2 (Figure 2C). Harvested CAL27 xenografted tumors were analyzed for expression of cyclin D1 mRNA and protein by RT-PCR and immunohistochemistry but a decrease in cyclin D1 expression was not appreciated (data not shown) despite a reduction in the phosphorylated GSK3β, a putative target of enzastaurin. Given the inability to synchronize cells in vivo and additional signals that can influence cyclin D1 expression including stromal-tumor interactions, this was not surprising.
Differential sensitivity of SCCHN cell lines to enzastaurin is related to cyclin D1 expression
To determine whether the anti-neoplastic properties of enzastaurin could be generalized to multiple SCCHN cell lines, we incubated nine lines with increasing concentrations of enzastaurin and assessed cell growth using a resazurin based assay. The readings at each concentration were normalized to that of untreated cells and expressed as a percentage of viable cells compared to untreated control. An approximately 4-fold range in sensitivity was observed between the most sensitive and resistant cell lines (Supplemental Table 3) demonstrating that enzastaurin reduces cell growth in most, but not all, SCCHN cell lines.
CCND1 is amplified in 30-50% of SCCHN with a range of protein expression in tumors (16). Since the predominant phenotype we observed during enzastaurin treatment was inhibition of proliferation and cyclin D1 was a downstream target, we hypothesized that cyclin D1 levels would be predictive of sensitivity to the agent (Figure 3A). Indeed, when cell based in vitro inhibition is plotted against quantified cyclin D1 protein expression (Figure 3B), a statistically significant correlation is observed (r = 0.6476, p = 0.03). Interestingly, in the resistant and high cyclin D1-expressing SCC35 cell line, enzastaurin did not modulate cyclin D1 protein levels or cell cycle progression (Figure 1D and 5). Therefore, only in the sensitive CAL27 cell line is CCND1 expression altered by enzastaurin while baseline cyclin D1 expression is predictive of sensitivity.
Figure 3. Cyclin D1 protein expression contributes to enzastaurin resistance in SCCHN cell lines.

A) Cyclin D1 expression in SCCHN cell line by protein immunoblotting. Blots were quantified with the Odyssey infrared imaging system and Cyclin D1 expression was normalized against tubulin expression and quantified at bottom. B) Correlation of cyclin D1 protein quantity and enzastaurin sensitivity in SCCHN cells. The data of cyclin D1 protein level in each cell line obtained from Figure 3A and percent of viable cells from Supplemental Table 1 were plotted and analyzed using the Pearson Correlation method. The correlation was significant with an r value of 0.6476 and p value of 0.03. C) CAL27 cells (2 left lanes) were transduced with lentivirus carrying a cyclin D1 expressing construct or empty vector control. SCC35 cells (2 right lanes) were transduced with lentivirus carrying a human pLKO.1 lentiviral shRNA targeting D1 gene or control shRNA. Cell lysates were prepared from cells transduced with vector control (C), cyclin D1 vector (D1), shRNA control (ShC), and cyclin D1 shRNA (ShD1) and analyzed by protein immunoblotting. D) Left panel: CAL27 cells were transfected with cyclin D1 (D1) or control vector (control) and treated with increasing concentrations of enzastaurin. Right panel: SCC35 cells were transfected with cyclin D1 shRNA (ShD1) or control shRNA (ShC) and treated with increasing concentrations of enzastaurin. Experimental results are show as mean +/− S.E and represent three independent experiments.
Figure 5. Enzastaurin affects protein synthesis of cyclin D1 in CAL27 but not SCC35 cells.

A) CAL27 and SCC-35 cells were treated with enzastaurin (2.5 μM) or DMSO (control) in serum-containing media for 45 minutes. Cell extracts were analyzed by western blotting with cyclin D1, phospho-GSK3β, and tubulin antibodies. Data from three independent experiments were plotted and shown in the bottom panel. B) Cells were treated with cycloheximide (50 ug/ml) and harvested at various time points. Cell lysates were analyzed by western blotting with cyclin D1 and alpha-tubulin antibodies. C) Top panel, cells were treated with enzastaurin or DMSO, as a control, in the absence or presence of MG132 in the last 3 hours of incubation. Bottom panel, cells were treated identically except that incubation time with MG132 was 7 hours. Alpha-tubulin was used as a loading control. Fold change is the ratio of the measured cyclin D1 value for each treatment to the value for the control sample, DMSO. Results are representative of three independent experiments.
To delineate further whether cyclin D1 is mechanistically related to enzastaurin sensitivity, we transfected the sensitive CAL27 cell line with cyclin D1 using a lentiviral expression vector. Protein immunoblotting confirmed increased expression of the protein (Figure 3C) compared to control and, notably, cyclin D1 over-expression was able to increase resistance in CAL27 cells (Figure 3D), effectively increasing the number of viable cells approximately 3-fold. Conversely, we depleted cyclin D1 expression in the resistant SCC35 cell line and assayed cell viability. SCC35 cells were transfected with cyclin D1 or control shRNA, and protein immunoblotting confirmed knockdown of cyclin D1 expression (Figure 3C). The cell viability assay demonstrated that depletion of cyclin D1 partially reversed the resistance phenotype exhibited by control SCC35 cells (Figure 3D). Taken together, these results indicate that induction of cyclin D1 increases resistance while depletion of cyclin D1 induces sensitivity in SCCHN cell lines. Therefore, cyclin D1 expression is associated with enzastaurin sensitivity and mechanistically linked to its activity.
AKT regulates cyclin D1 synthesis only in enzastaurin sensitive cell lines
To further investigate potential mechanisms underlying the effect of enzastaurin on cyclin D1, we incubated CAL27 cells with or without enzastaurin (2.5 μM) and analyzed cell lysates for phosphorylation of the PKC substrate, myristoylated alanine-rich protein kinase C substrate (MARCKS), AKT, p70S6 kinase, GSK3β, and 4e-BP1 over time. Enzastaurin abrogated phosphorylation of all proteins examined (Figure 4A), however, inhibition of p70S6 kinase, 4e-BP1, and AKT phosphorylation was most consistent temporally with reduction in cyclin D1 protein. In support for a role of AKT in cyclin D1 regulation, we observed reduction of cyclin D1 protein at 8 hours in CAL27 cells treated with the phosphotidylinositol-3 kinase inhibitor, LY294001 (Figure 4B). The delay between inhibition of AKT phosphorylation and reduction in cyclin D1 protein suggests a transcriptional or translational mechanism and, in fact, AKT, mTOR, p70S6 kinase, and 4e-BP1 are part of a signaling pathway that has been implicated in the translation of cyclin D1 in multiple cell systems (17). In order to determine whether mTOR was involved in cyclin D1 regulation, we incubated CAL27 cells with rapamycin but did not observe a change in cyclin D1 despite rapid and sustained reduction in p70S6 kinase phosphorylation (Figure 4C). Therefore, it appeared that AKT regulates cyclin D1 in the enzastaurin sensitive CAL27 cells via a mechanism that was mTOR independent.
Figure 4. AKT is among the putative targets of enzastaurin and contributes to cyclin D1 expression in CAL27 cells.

A) CAL27 cells treated (+) or untreated (−) with 2.5 μM enzastaurin for the times indicated. Total cell lysates were analyzed by protein immunoblotting and probed with anti-alpha-tubulin antibody and total and phospho-specific- MARCKS, -GSK3β, -p70S6K, or -AKT antibody. Fold change represents quantification of the ratio of the signals to that of untreated (−) cells. The right panel represents protein immunoblots performed simultaneously probing for relevant total protein. Results are representative of at least three independent experiments. B) CAL27 cells were treated (+) or untreated (−) with LY294001 at a concentration of 25 μM for the duration indicated. Total cell lysates were analyzed by protein immunoblotting and probed with anti-alpha-tubulin, cyclin D1, and phospho-specific-AKT antibodies. Results are representative of at least three independent experiments. C) CAL27 cells were treated (+) or untreated (−) with rapamycin 50 nM for the duration indicated and total cell lysates were analyzed by protein immunoblotting with anti-cyclin D1, phospho-p70S6K, and alpha-tubulin antibodies. Results are representative of three independent experiments. D) CAL27 cells were transfected with siRNA directed against Akt1 and Akt2, scrambled control siRNA, or no siRNA (left panel), or transfected with a control vector or Myr-Akt1, a constitutively active Akt1 expression vector (right panel). Total cell lysates were analyzed by protein immunoblotting with cyclin D1, Akt1, Akt2, phospho-specific Akt Ser473, and alpha-tubulin antibodies. Results are representative of three independent experiments.
In order to clarify the role of AKT in the control of cyclin D1 and determine if this regulation impacted efficacy of enzastaurin, we measured expression of AKT isotypes in SCCHN cell lines (Supplementary Figure 2) and depleted AKT1 and AKT 2 using siRNA. Compared to control or single isoform siRNA, AKT1 plus AKT2 siRNA reduced cyclin D1 (Figure 4D, left panels) but, interestingly, only in sensitive CAL27 cells and not in SCC35 cells. Moreover, transfecting CAL27 or SCC35 cells with constitutively active myristoylated AKT increased cyclin D1 expression only in enzastaurin sensitive CAL27 cells (Figure 4D, right panels). Taken together, it appears that a key determinant of enzastaurin efficacy in SCCHN cells is baseline expression of cyclin D1 and intact regulation of cyclin D1 by AKT.
Enzastaurin primarily affects cyclin D1 protein synthesis not degradation
As demonstrated above, enzastaurin inhibits multiple targets in SCCHN cells, many of which have been implicated in cyclin D1 regulation. However, inhibition of GSK3β, a regulator of cyclin D1 degradation (18-20) would be expected to increase cyclin D1 levels. Therefore, we hypothesized that if cyclin D1 reduction was critical to the efficacy of enzastaurin then any inhibition of cyclin D1 degradation would be observed early and transiently after exposure. As expected, phospho-GSK3β was rapidly inhibited by enzastaurin in both sensitive CAL27 and resistant SCC35 cell lines with a concurrent increase in cyclin D1 expression in CAL27 cells (Figure 5A). However, when we incubated cells with cyclohexamide to isolate cyclin D1 degradation, we observed that indeed this rise in cyclin D1 protein was short-lived (15-45 minutes) and relatively minor in CAL27 cells and did not occur in SCC35 cells (Figure 5B). Therefore, the multi-kinase inhibitory properties of enzastaurin results in complex effects on cyclin D1 especially in CAL27 sensitive cells with a transient increase in expression 30-40 minutes after exposure but a net reduction after several hours.
We then examined what effect enzastaurin had on cyclin D1 synthesis remembering that reduction in protein level was observed after several hours only in enzastaurin sensitive cell lines. CAL27 and SCC35 cells were treated with the proteosome inhibitor, MG132, and cyclin D1 protein expression was quantified with or without enzastaurin (Figure 5C). The addition of MG132 dramatically increased cyclin D1 levels in both cell lines underscoring the importance of protein synthesis (DMSO vs. DMSO + MG132 lanes). As predicted, however, only in sensitive CAL27 cells did addition of enzastaurin reduce cyclin D1 expression (DMSO + MG132 vs. Enza + MG132) whereas no change was evident in the resistant SCC35 cells. These data, therefore, support the necessity of an inhibitory effect of enzastaurin on cyclin D1 production for the agent to be effective. When physiologic cyclin D1 regulation is disrupted, enzastaurin is inactive as exemplified by SCC35 cells. Interestingly, quantitative PCR confirms that SCC35 cells are highly CCND1 gene amplified (Supplementary Figure 3) suggesting profound protein dysregulation that would not be influenced by kinase inhibition.
Discussion
The introduction of molecularly targeted therapy in oncology ushered with it an era of personalized medicine based primarily on host and tumor biology rather than anatomic location and pathologic features. The challenge, in most circumstances, has become predicting which patients will benefit from a specific agent; a mandate made more difficult with the development of multi-kinase inhibitors that can have several putative targets. Enzastaurin is one such agent being studied in different cancers that we hypothesized would be effective in SCCHN because of its inhibitory properties against PKC (3, 4). Indeed the agent was active against SCCHN cell lines and tumor xenografts but not universally. We delineate a mechanism of sensitivity to enzastaurin that depends on physiologic expression and regulation of cyclin D1 by AKT, a putative target of the drug. Conversely, when this regulation is disrupted, as observed in a resistant cell line, enzastaurin is ineffective.
Cyclin D1 plays a critical role in cell cycle progression and thus, not surprisingly, is dysregulated in multiple cancers including SCCHN. In fact, increased cyclin D1 expression in SCCHN, often through amplification of the 11q13 locus (21), has been associated with an increased transformation rate of premalignant lesions to cancer (22), lower survival (23-26), and resistance to therapy including cisplatin (27) or epidermal growth factor receptor inhibitors (28). Moreover, inhibition of cyclin D1 reduces growth of SCCHN cell lines in vitro, tumor formation in vivo, and increases sensitivity to cisplatin (29, 30). That enzastaurin treatment decreases cyclin D1 protein expression in a sustained manner in some SCCHN cell lines, therefore, highlights its potential utility especially given that it is well tolerated and can be combined with cytotoxic chemotherapy (31).
The observation that enzastaurin does not universally inhibit in vitro growth in all cell lines examined is not surprising. Arguably this is a closer reflection of what is likely to occur in patients. In fact, the presence of naturally occurring resistant cell lines offers an opportunity to explore predictive biomarkers of efficacy that could be translated to human research. The finding that cyclin D1 levels are negatively associated with sensitivity to enzastaurin is one that should be further validated.
The effect of enzastaurin on cyclin D1 and the observation that cyclin D1 shRNA appears to abrogate the resistance phenotype underscore a mechanistic association. Arguably, in those cell lines with high baseline cyclin D1 expression, cyclin D1 levels cannot be reduced enough to render the cells sensitive. However, by depleting cyclin D1 expression using shRNA, we can render these cell lines sensitive to enzastaurin. Since the majority of oncology therapy is based on empiric approaches in unselected patient populations, predictive biomarkers that are simple to measure, such as cyclin D1 immunohistochemistry, would allow individualized treatment that increases the likelihood of benefit.
Inhibition of AKT by enzastaurin can involve direct binding to the ATP pocket preventing activation however, our results would suggest that inhibition of phosphorylation at T308 or S473 occurs several hours after exposure to enzastaurin (Figure 4 and data not shown) implicating an indirect effect. Conversely, AKT regulation of cyclin D1 by mechanisms other than mTOR has been described in other models but not in SCCHN (32). AKT stabilizes cyclin D1 protein levels by inhibiting GSK3β function through direct Ser9 phosphorylation. However, we could not demonstrate this in the SCCHN cell lines we examined (data not shown) and enzastaurin had minimal effect on cyclin D1 degradation. AKT has also been implicated in transcriptional control of CCND1 through regulation of FoxO family members (33, 34) or cAMP response element-binding protein 1(35). It is possible that the effects we observed on cyclin D1 are mediated through AKT regulated CCND1 transcription and when this is disrupted by other mechanisms driving cyclin D1 expression, CCND1 amplification for example, cells are resistant to enzastaurin.
The present study illustrates that signaling context is critical to our understanding and development of novel compounds, especially those with multiple targets, and allows construction of a model specific to enzastaurin efficacy in SCCHN (Figure 6). Our data support the utility of enzastaurin in SCCHN treatment but only in tumors with moderate to low baseline cyclin D1 expression that is physiologically regulated. Nonetheless, results from preclinical experiments must be interpreted with caution as they are de facto artificially engineered to replicate human cancer biology. For example, human head and neck cancer and hind-limb xenografts have clear differences in location, stromal cell species origin, and immunocompetence of the host. Thus, although our results provide a potential predictive biomarker to select patients for enzastaurin therapy and a general paradigm for multi-kinase inhibitor development, this warrants further exploration and validation in human studies.
Figure 6. Differential responsiveness of SCCHN cells to enzastaurin depends on signaling context.
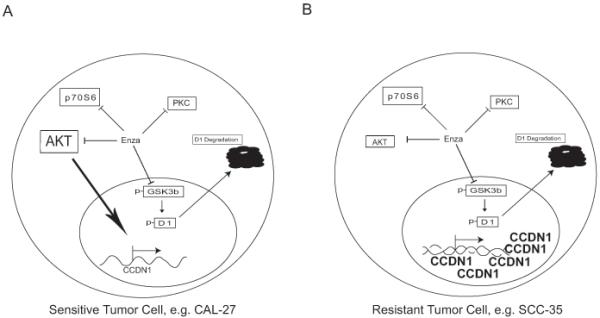
A) In the enzastaurin sensitive cell line, CAL27, cyclin D1 is regulated by AKT leading to protein synthesis and by GSK3β leading to degradation. Both processes are inhibited by enzastaurin although AKT induction of cyclin D1 (large arrow) plays a greater role in determining cyclin D1 levels which are reduced upon exposure to enzastaurin. B) In the enzastaurin resistant cell line, SCC35, CCND1 gene amplification results in elevated protein expression that is unaffected by AKT inhibition by enzastaurin or depletion by siRNA and, conversely, by inhibition of phospho-GSKβ.
Supplementary Material
Acknowledgments
Supported by research funds from the National Institutes of Health grants R01-CA109278 (WLK, MRR, EEWC) and P30-CA14599 (EEV, RW, EEWC), and Eli Lilly and Company (WLK, JL, EEWC)
Footnotes
Disclosure of Potential Conflicts of Interest: EEWC has served as a consultant for Eli Lilly Co. No other disclosure of conflicts of interest.
References
- 1.Choong NW, Cohen EE. Forthcoming receptor tyrosine kinase inhibitors. Expert opinion on therapeutic targets. 2006;10:793–7. doi: 10.1517/14728222.10.6.793. [DOI] [PubMed] [Google Scholar]
- 2.Chmura SJ, Dolan ME, Cha A, Mauceri HJ, Kufe DW, Weichselbaum RR. In vitro and in vivo activity of protein kinase C inhibitor chelerythrine chloride induces tumor cell toxicity and growth delay in vivo. Clin Cancer Res. 2000;6:737–42. [PubMed] [Google Scholar]
- 3.Cohen EE, Lingen MW, Zhu B, et al. Protein kinase C zeta mediates epidermal growth factor-induced growth of head and neck tumor cells by regulating mitogen-activated protein kinase. Cancer Res. 2006;66:6296–303. doi: 10.1158/0008-5472.CAN-05-3139. [DOI] [PubMed] [Google Scholar]
- 4.Cohen EE, Zhu H, Lingen MW, et al. A feed-forward loop involving protein kinase Calpha and microRNAs regulates tumor cell cycle. Cancer Res. 2009;69:65–74. doi: 10.1158/0008-5472.CAN-08-0377. [DOI] [PMC free article] [PubMed] [Google Scholar]
- 5.Gokmen-Polar Y, Murray NR, Velasco MA, Gatalica Z, Fields AP. Elevated protein kinase C betaII is an early promotive event in colon carcinogenesis. Cancer Res. 2001;61:1375–81. [PubMed] [Google Scholar]
- 6.da Rocha AB, Mans DR, Regner A, Schwartsmann G. Targeting protein kinase C: new therapeutic opportunities against high-grade malignant gliomas? Oncologist. 2002;7:17–33. doi: 10.1634/theoncologist.7-1-17. [DOI] [PubMed] [Google Scholar]
- 7.Tabatabai G, Frank B, Wick A, et al. Synergistic antiglioma activity of radiotherapy and enzastaurin. Ann Neurol. 2007;61(2):153–61. doi: 10.1002/ana.21057. [DOI] [PubMed] [Google Scholar]
- 8.Podar K, Raab MS, Zhang J, et al. Targeting PKC in multiple myeloma: in vitro and in vivo effects of the novel, orally available small-molecule inhibitor Enzastaurin ( LY317615.HCl) Blood. 2006;109(4):1669–77. doi: 10.1182/blood-2006-08-042747. Epub 2006 Oct 5. [DOI] [PMC free article] [PubMed] [Google Scholar]
- 9.Shipp MA, Ross KN, Tamayo P, et al. Diffuse large B-cell lymphoma outcome prediction by gene-expression profiling and supervised machine learning. Nat Med. 2002;8:68–74. doi: 10.1038/nm0102-68. [DOI] [PubMed] [Google Scholar]
- 10.Gelardi T, Caputo R, Damiano V, et al. Enzastaurin inhibits tumours sensitive and resistant to anti-EGFR drugs. Br J Cancer. 2008;99:473–80. doi: 10.1038/sj.bjc.6604493. [DOI] [PMC free article] [PubMed] [Google Scholar]
- 11.Li CWW. DNA-Chip Analyzer (dChip) In: Parmigiani GGE, Irizarry R, Zeger SL, editors. The analysis of gene expression data: methods and software. Springer; New York: 2003. pp. 120–41. [Google Scholar]
- 12.Doniger SW, Salomonis N, Dahlquist KD, Vranizan K, Lawlor SC, Conklin BR. MAPPFinder: using Gene Ontology and GenMAPP to create a global gene-expression profile from microarray data. Genome Biol. 2003;4:R7. doi: 10.1186/gb-2003-4-1-r7. [DOI] [PMC free article] [PubMed] [Google Scholar]
- 13.Graff JR, McNulty AM, Hanna KR, et al. The protein kinase Cbeta-selective inhibitor, Enzastaurin ( LY317615.HCl), suppresses signaling through the AKT pathway, induces apoptosis, and suppresses growth of human colon cancer and glioblastoma xenografts. Cancer Res. 2005;65:7462–9. doi: 10.1158/0008-5472.CAN-05-0071. [DOI] [PubMed] [Google Scholar]
- 14.Rizvi MA, Ghias K, Davies KM, et al. Enzastaurin ( LY317615), a protein kinase Cbeta inhibitor, inhibits the AKT pathway and induces apoptosis in multiple myeloma cell lines. Mol Cancer Ther. 2006;5:1783–9. doi: 10.1158/1535-7163.MCT-05-0465. [DOI] [PubMed] [Google Scholar]
- 15.Querfeld C, Rizvi MA, Kuzel TM, et al. The selective protein kinase C beta inhibitor enzastaurin induces apoptosis in cutaneous T-cell lymphoma cell lines through the AKT pathway. J Invest Dermatol. 2006;126:1641–7. doi: 10.1038/sj.jid.5700322. [DOI] [PubMed] [Google Scholar]
- 16.Cohen EE. Novel therapeutic targets in squamous cell carcinoma of the head and neck. Seminars in oncology. 2004;31:755–68. doi: 10.1053/j.seminoncol.2004.09.010. [DOI] [PubMed] [Google Scholar]
- 17.Mamane Y, Petroulakis E, LeBacquer O, Sonenberg N. mTOR, translation initiation and cancer. Oncogene. 2006;25:6416–22. doi: 10.1038/sj.onc.1209888. [DOI] [PubMed] [Google Scholar]
- 18.Diehl JA, Zindy F, Sherr CJ. Inhibition of cyclin D1 phosphorylation on threonine-286 prevents its rapid degradation via the ubiquitin-proteasome pathway. Genes Dev. 1997;11:957–72. doi: 10.1101/gad.11.8.957. [DOI] [PubMed] [Google Scholar]
- 19.Diehl JA, Cheng M, Roussel MF, Sherr CJ. Glycogen synthase kinase-3beta regulates cyclin D1 proteolysis and subcellular localization. Genes Dev. 1998;12:3499–511. doi: 10.1101/gad.12.22.3499. [DOI] [PMC free article] [PubMed] [Google Scholar]
- 20.Takahashi-Yanaga F, Sasaguri T. GSK-3beta regulates cyclin D1 expression: a new target for chemotherapy. Cell Signal. 2008;20:581–9. doi: 10.1016/j.cellsig.2007.10.018. [DOI] [PubMed] [Google Scholar]
- 21.Bartkova J, Lukas J, Muller H, Strauss M, Gusterson B, Bartek J. Abnormal patterns of D-type cyclin expression and G1 regulation in human head and neck cancer. Cancer Res. 1995;55:949–56. [PubMed] [Google Scholar]
- 22.Papadimitrakopoulou VA, Izzo J, Mao L, et al. Cyclin D1 and p16 alterations in advanced premalignant lesions of the upper aerodigestive tract: role in response to chemoprevention and cancer development. Clin Cancer Res. 2001;7:3127–34. [PubMed] [Google Scholar]
- 23.Bellacosa A, Almadori G, Cavallo S, et al. Cyclin D1 gene amplification in human laryngeal squamous cell carcinomas: prognostic significance and clinical implications. Clin Cancer Res. 1996;2:175–80. [PubMed] [Google Scholar]
- 24.Michalides RJ, van Veelen NM, Kristel PM, et al. Overexpression of cyclin D1 indicates a poor prognosis in squamous cell carcinoma of the head and neck. Arch Otolaryngol Head Neck Surg. 1997;123:497–502. doi: 10.1001/archotol.1997.01900050045005. [DOI] [PubMed] [Google Scholar]
- 25.Mineta H, Miura K, Takebayashi S, et al. Cyclin D1 overexpression correlates with poor prognosis in patients with tongue squamous cell carcinoma. Oral Oncol. 2000;36:194–8. doi: 10.1016/s1368-8375(99)00078-0. [DOI] [PubMed] [Google Scholar]
- 26.Muller D, Millon R, Velten M, et al. Amplification of 11q13 DNA markers in head and neck squamous cell carcinomas: correlation with clinical outcome. Eur J Cancer. 1997;33:2203–10. doi: 10.1016/s0959-8049(97)00198-6. [DOI] [PubMed] [Google Scholar]
- 27.Akervall J, Kurnit DM, Adams M, et al. Overexpression of cyclin D1 correlates with sensitivity to cisplatin in squamous cell carcinoma cell lines of the head and neck. Acta Otolaryngol. 2004;124:851–7. doi: 10.1080/00016480410017323. [DOI] [PubMed] [Google Scholar]
- 28.Kalish LH, Kwong RA, Cole IE, Gallagher RM, Sutherland RL, Musgrove EA. Deregulated cyclin D1 expression is associated with decreased efficacy of the selective epidermal growth factor receptor tyrosine kinase inhibitor gefitinib in head and neck squamous cell carcinoma cell lines. Clin Cancer Res. 2004;10:7764–74. doi: 10.1158/1078-0432.CCR-04-0012. [DOI] [PubMed] [Google Scholar]
- 29.Nakashima T, Clayman GL. Antisense inhibition of cyclin D1 in human head and neck squamous cell carcinoma. Arch Otolaryngol Head Neck Surg. 2000;126:957–61. doi: 10.1001/archotol.126.8.957. [DOI] [PubMed] [Google Scholar]
- 30.Wang MB, Yip HT, Srivatsan ES. Antisense cyclin D1 enhances sensitivity of head and neck cancer cells to cisplatin. Laryngoscope. 2001;111:982–8. doi: 10.1097/00005537-200106000-00010. [DOI] [PubMed] [Google Scholar]
- 31.Chen YB, LaCasce AS. Enzastaurin. Expert Opin Investig Drugs. 2008;17:939–44. doi: 10.1517/13543784.17.6.939. [DOI] [PubMed] [Google Scholar]
- 32.Liang J, Slingerland JM. Multiple roles of the PI3K/PKB (Akt) pathway in cell cycle progression. Cell Cycle. 2003;2:339–45. [PubMed] [Google Scholar]
- 33.Arden KC, Biggs WH., 3rd. Regulation of the FoxO family of transcription factors by phosphatidylinositol-3 kinase-activated signaling. Arch Biochem Biophys. 2002;403:292–8. doi: 10.1016/s0003-9861(02)00207-2. [DOI] [PubMed] [Google Scholar]
- 34.Schmidt M, Fernandez de Mattos S, van der Horst A, et al. Cell cycle inhibition by FoxO forkhead transcription factors involves downregulation of cyclin D. Mol Cell Biol. 2002;22:7842–52. doi: 10.1128/MCB.22.22.7842-7852.2002. [DOI] [PMC free article] [PubMed] [Google Scholar]
- 35.Kumar AP, Bhaskaran S, Ganapathy M, et al. Akt/cAMP-responsive element binding protein/cyclin D1 network: a novel target for prostate cancer inhibition in transgenic adenocarcinoma of mouse prostate model mediated by Nexrutine, a Phellodendron amurense bark extract. Clin Cancer Res. 2007;13:2784–94. doi: 10.1158/1078-0432.CCR-06-2974. [DOI] [PMC free article] [PubMed] [Google Scholar]
Associated Data
This section collects any data citations, data availability statements, or supplementary materials included in this article.