

Abstract
We use a new, unsupervised multivariate imaging and analysis strategy to identify related patterns of reduced white matter integrity, measured with the fractional anisotropy (FA) derived from diffusion tensor imaging (DTI), and decreases in cortical thickness, measured by high resolution T1-weighted imaging, in Alzheimer's disease (AD) and frontotemporal dementia (FTD). This process is based on a novel computational model derived from sparse canonical correlation analysis (SCCA) that allows us to automatically identify mutually predictive, distributed neuroanatomical regions from different imaging modalities. We apply the SCCA model to a dataset that includes 23 control subjects that are demographically-matched to 49 subjects with autopsy or CSF-biomarker-diagnosed AD (n=24) and FTD (n=25) with both DTI and T1-weighted structural imaging. SCCA shows that the FTD-related frontal and temporal degeneration pattern is correlated across modalities with permutation corrected p < 0.0005. In AD, we find significant association between cortical thinning and reduction in white matter integrity within a distributed parietal and temporal network (p < 0.0005). Furthermore, we show that—within SCCA identified regions—significant differences exist between FTD and AD cortical-connective degeneration patterns. We validate these distinct, multimodal imaging patterns by showing unique relationships with cognitive measures in AD and FTD. We conclude that SCCA is a potentially valuable approach in image analysis that can be applied productively to distinguishing between neurodegenerative conditions.
Keywords: dementia, multivariate, correlation, diffusion tensor, cortical thickness, AD, FTD, canonical correlation
1. Introduction
Neuroimaging studies suggest that frontotemporal dementia (FTD) leads to decreases in cortical thickness and white matter integrity, and these may reflect degraded cortical and white matter neural networks underlying language, social and executive functioning. Alzheimer's disease (AD) also induces large-scale neurodegeneration that, in contrast to FTD, may reflect episodic memory loss. However, the distinguishing, integrated effects of these diseases on the cortical and white matter networks underlying these behavioral changes has not been established.
FTD is an early-onset neurodegenerative condition with an average age of onset in the sixth decade of life (Hodges et al., 2003; Neary and Snowden, 1996; Grossman, 2006). The disease is due to a disorder of tau metabolism (Lee et al., 2001) or the accumulation of a ubiquinated protein known as TDP-43 (Neumann et al., 2006). The condition is almost as common as AD in individuals less than 65 years of age (Rosso et al., 2003; Knopman et al., 2004; Cairns et al., 2006). Survival is typically eight years from onset (Hodges et al., 2003; Cairns et al., 2006; Xie et al., 2008). Developing biomarkers for early detection of disease and assessment of treatment is of great significance because of the development of therapies specifically for this condition.
One common, inexpensive, non-invasive tool in diagnosis of FTD is clinical measurement of cognitive abilities and behavior. Diagnosis of FTD consequently includes observation of syndromes such as primary progressive aphasia (PPA) and/or a disorder of social comportment and personality together with limited executive resources (McKhann et al., 2001; Neary et al., 1998). Recent studies have begun to demonstrate longitudinal decline on language and cognitive measures in clinical (Blair et al., 2007; Libon et al., 2009b) and pathologically-defined (Grossman et al., 2008) populations. However, when validated against autopsy defined series, clinical diagnostic assessment may be inaccurate in up to 30 % of cases (Forman et al., 2006). Most of the missed diagnoses are uncommon, young-onset presentations of AD. Thus, comparative studies of patients with neurodegenerative conditions are needed to demonstrate the specificity of a method for accurate diagnosis.
One potential source of additional diagnostic information involves biofluids such as cerebrospinal fluid (CSF). In a series of patients with known pathology, the ratio of CSF-tau to CSF beta-amyloid achieved an overall diagnostic accuracy of 93%, with excellent sensitivity and specificity (Bian et al., 2008). However, CSF ratio measures require an invasive lumbar puncture and their levels may not change enough over time to be useful for monitoring treatment response (Buchhave et al., 2009).
Magnetic resonance imaging is a non-invasive alternative to characterize the disease process in terms of objective, quantitative measurements of brain function and anatomy. Many studies have analyzed the spatial pattern of atrophy (Jack et al., 1992; Laakso et al., 2000; Chan et al., 2001; Galton et al., 2001; Frisoni et al., 2002; Thompson et al., 2003; Ballmaier et al., 2004; Studholme et al., 2004, 2006) by contrasting control and neurodegenerative populations. These studies show atrophy in several frontal and temporal regions in FTD. Attempts to validate these findings include examining cortical atrophy in patients with autopsy-defined disease (Whitwell and Jack, 2005) and relating cortical atrophy in autopsy-defined cases directly to the clinical phenotype through regression studies (Grossman et al., 2007a). Cross-sectional studies have related language deficits to neuroanatomic substrates using MRI in clinical (Grossman et al., 2004) and pathologically-defined (Josephs et al., 2006a; Grossman et al., 2007b) populations.
However, there have been few comparative studies assessing MRI changes in FTD relative to AD. MRI assessments of gray matter atrophy in AD show significant changes in the hippocampus as well as neocortical areas of the posterior temporal, parietal and lateral frontal lobes (Bocti et al., 2006; Rabinovici et al., 2007). However, direct contrasts of autopsy-proven cases of AD and FTD show only subtle differences (Grossman et al., 2007a; Whitwell et al., 2008a), perhaps because subgroups of patients with FTD can have changes in these same areas. For example, patients with semantic dementia tend to have relatively more hippocampal and temporal neocortical disease, and patients with behavioral-variant FTD have disease focused more in frontal brain regions.
Most studies analyze progressive cortical atrophy during the course of FTD with T1-weighted MRI (Whitwell and Jack, 2005; Brambati et al., 2007). However, additional insight into the anatomic consequences of dementia may be provided by diffusion tensor imaging (DTI) (Larsson et al., 2004; Yoshiura et al., 2006; Borroni et al., 2007). This modality provides a surrogate measure of white matter integrity. There is considerable evidence that the pathologies associated with FTD cause significant white matter disease (Forman et al., 2002; Neumann et al., 2006). DTI studies in FTD are rare. One study (Zhang et al., 2009) suggested that DTI-derived white matter degeneration is more prominent in FTD compared to AD. However, there is some concern about these results because the participating patients were diagnosed clinically and there was no independent validation of the diagnosis with autopsy or CSF biomarker data. Thus, the first contribution of our study is to use DTI and T1 imaging simultaneously to help describe large-scale patterns of difference in patients with autopsy or CSF biomarker-diagnosed diseases.
The second innovation in the current study concerns the manner in which we combine these two imaging modalities. While T1-weighted and DTI modalities provide complementary windows into disease, the degree to which the appearance of gray matter and white matter disease are correlated across modalities is unknown. Multivariate relationships between cortical and white matter signals such as this have been challenging to address due to their essentially disjoint nature and the tremendous number of multiple comparisons required to directly assess such correlations. While research performed on separate modalities in non-overlapping groups provides compelling evidence that both FTD and AD affect white and gray matter tissue, no study has yet been performed to assess the reciprocity provided by these modalities or to quantify the extent to which white matter and cortex change together, as measured by MRI. To achieve this, new multiple modality techniques must be adopted that enable us to determine whether neurodegeneration occurs across cortical and white matter networks.
Few studies have investigated the extent to which cortical atrophy and white matter integrity are quantitatively related. Most studies perform separate analyses for T1 structural and DTI modalities, where voxel-based morphometry is used separately for cortical and white matter analysis (Thivard et al., 2007; Ibrahim et al., 2009) and avoid explicit investigation into correlated DTI and T1 effects. In contrast, Sydykova et al. (2007) used a single region of interest (ROI) to show that, in AD, the average fractional anisotropy (FA) in anterior and posterior corpus callosum correlated with anterior and posterior cortical atrophy, where atrophy was measured by voxel-based morphometry. Kochunov et al. (2007) also used ROIs in white matter to show correlations, in normal aging, between average brain and corpus callosum FA and cortical thickness averaged across the whole brain and across hemispheres. Here, we use recent advances in a well-established statistical technique to provide a new method for correlating multiple imaging modalities.
Canonical correlation analysis (CCA) (Hotelling, 1936) is an established method for estimating the linear relationship between two sets of measurements taken across subjects. Hotelling proposed CCA in 1936 and it remains a method that is ideally suited to investigating multi-view problems, that is, datasets with two different real-world measurements of some “hidden” underlying phenomenon. CCA, a multi-view extension of principal component analysis (PCA), finds canonical variates that allow an estimation of the extent to which one view correlates with the other, via a projection. Its output is the correlation value itself and the projection vectors, which provide a set of canonical weights on the original data that give the best projection, when combined across all subjects, of one view onto the other. CCA has been used in medical imaging to investigate anatomical correlations (Rao et al., 2008) where one may assess the degree to which, for example, left hemisphere caudate volume predicts right hemisphere caudate volume. CCA is also used in pre/post-processing for fMRI studies (Ragnehed et al., 2009; Bruguier et al., 2008). These studies use designs where the number of subjects is greater than or equal to the number of multi-view measurements, a primary numerical prerequisite for application of CCA. While extremely powerful, traditional CCA has been severely limited by this condition, as most imaging datasets contain a number of measurements (e.g. voxels), p, that is much larger than the number of subjects in the dataset, n.
Recent advances in sparse statistical methods, spurred by the gene expression analysis community, have resolved some of these issues. In particular, Sparse CCA (SCCA) was recently proposed by a number of different researchers (Witten and Tibshirani, 2009; Witten et al., 2009; Parkhomenko et al., 2009; Cao et al., 2009). SCCA makes CCA computationally feasible and applicable in the case when only a fraction of the p measurements is likely to be important for the problem at hand. Sparse CCA can be used to find which subsets of voxels, genes, or other measurements in each modality best predict the other modality. In our application, SCCA enabled the computation of the significance of correlations between the most predictive subsets of fractional anisotropy and cortical thickness voxels. The size of these subsets is a controllable parameter that corresponds to the “sparseness” of the computation. Sparse CCA has advantages over other integrative approaches that rely on spatially overlapping signals (Avants et al., 2007, 2008) as SCCA is ideal for computing spatially disjoint multivariate associations.
Here, we use SCCA to elucidate cortical thickness and fractional anisotropy relationships in both AD and FTD. Moreover, we hypothesize that the regions identified by SCCA correspond to tissue regions affected by disease. To test this hypothesis, and ensure the validity of the resulting analyses, each patient's clinical diagnosis was confirmed at autopsy or was consistent with CSF analyses of proteins informative for distinguishing between FTD and AD. Additionally, we use regression with neuropsychological testing to assess patterns of clinical-anatomical associations that are relevant for these diseases. Lastly, we will show that SCCA may be used for dimensionality reduction to sensibly restrict regions over which voxel-wise analyses are performed.
2. Methods
2.1. Subjects
We studied 49 patients diagnosed clinically and without use of imaging, along with 23 matched controls. Twenty-five patients had FTD spectrum disorder and 24 were diagnosed with AD at the Department of Neurology at the University of Pennsylvania. Initial clinical diagnosis was established by an experienced neurologist (M.G.) using published criteria (McKhann et al., 1984, 2001). Subsequently, at least two trained reviewers of a consensus committee confirmed the presence of diagnostic criteria based on an independent review of the semi-structured history, mental status examination and neurological examination. Clinical diagnosis was confirmed at autopsy (n=13) or aided by CSF biomarker-diagnosis which is based on a validated CSF analysis derived from a population with known pathology (Bian et al., 2008). Bian et al explicitly used CSF biomarkers to differentiate AD and FTD in vivo and found an accuracy of 93 % when comparing with autopsy results. If the error rate is identical in this cohort, then this would lead to misdiagnosis of three or four subjects. Exclusion criteria included the presence of other neurological conditions such as stroke or hydrocephalus, primary psychiatric disorders such as depression or psychosis, or a systemic illness that can interfere with cognitive functioning. Some of these patients were taking a fixed dosage of an acetylcholinesterase inhibitor (e.g. donepezil, rivastigmine or galantamine). Some of these patients may have been medicated with a low dosage of a non-sedating anti-depressant (e.g. serotonin-specific reuptake inhibitors such as sertraline) or an atypical neuroleptic agent (e.g quetiapine), as indicated clinically, but none of the patients demonstrated any evidence of sedation suggesting over-medication. These patients and their legal representatives participated in an informed consent procedure approved by the Institutional Review Board at the University of Pennsylvania.
The age (mean ±S.D. = 61.3 ±9 years) of the FTD patients was typical of the younger age of onset in FTD. The FTD patients were right-handed, high school-educated (education = 15.3 ±2.9 years) native English-speakers with a mean MMSE at the examination of 24.5 (±5.1). In this study, we group all FTD subjects together as there were insufficient numbers of participants to assess each phenotype (progressive nonfluent aphasia = 7, semantic dementia = 5, behavioral variant = 13). Future work will seek to address this concern with larger cohorts. AD subjects were matched in terms of disease duration, gender, handedness, age (63.9±7.5), MMSE (21.4±8.2) and education (16.4±3.1), as verified by two-tailed T-tests for statistical difference, all of which failed to reach significance level of p < 0.05. A healthy control population (n=23) were also right-handed, high school-educated native English-speakers, gender and age (65.3±8.9) matched to the full patient population.
2.2. Imaging Methods
Image Acquisition
All images were acquired with a Siemens Trio 3.0 tesla MRI scanner. Each study began with a rapid sagittal T1-weighted scan to determine patient position. A T1-weighted structural acquisition was then acquired with TR (repetition time) = 1620ms, TE (echo time) = 3ms, slice thickness: 1 mm, in-plane resolution: .9766mm × .9766mm and field of view (FOV) 256 × 256 × 192. The diffusion tensor imaging sequence was acquired last with a 30 direction single shot, spin-echo EPI sequence, FOV: 22 cm; matrix: 96×112; TR: 6.5 sec; TE: 99 ms; b-value: 0, 1000 s/mm2; 3 averages with a total scan time of 8 min for 72 2 mm thickness slices with in-plane resolution: 2mm2.
Multivariate Assessment of Cortical Thickness and White Matter Integrity
The overall image analysis experimental design is as follows:
Spatially normalize DTI and T1-weighted imaging data from healthy controls and patients with FTD and AD diagnoses.
Define a white matter region of interest in the DTI template and a cortical region of interest in the T1 template. In this study, the whole cortex and all white matter with FA > 0.2 were used.
Apply SCCA within a collection of multivariate data to compute the subset of voxels within each ROI that are most strongly correlated with the alternate modality. Note that this step does not use diagnosis or neuropsychological testing.
Perform permutation testing of one of the two modalities to assess the significance of the correlation.
Leverage the SCCA projections to summarize DTI and T1 relationships across all selected voxels and/or to constrain further testing such as computing imaging relationships with neuropsychological evaluations or group tests.
This design allows us to assess the hypothesis that SCCA helps identify disease relevant regions of the brain. The outcome is, first, the significance of the multivariate association. Second, via step 5, we test whether the associated regions are significant with respect to disease and/or cognition.
Here, we use diffeomorphic normalization of the T1 and diffusion tensor modalities as a pre-processing step that will cluster the image-based features before down-stream SCCA. The DTI and T1 modalities are processed separately due to the presence of inter-modality distortion and because SCCA does not require the two views of the patient to be spatially aligned. In contrast, normalization of all subjects within a modality is important to maximize the within-modality anatomical alignment across the subjects in the population. The processing for each modality is described below.
T1 Processing for Estimating Cortical Thickness
Reliable cortical thickness estimation and group analysis requires state-of-the-art normalization and segmentation. The analysis of T1 imaging is based on the publicly available and open-source Advanced Normalization Tools (ANTS, http://www.picsl.upenn.edu/ANTS/) and the associated pipelining framework PipeDream (http://sourceforge.net/projects/neuropipedream/). PipeDream automates and quality assures ANTS processing via a single parameter file and data organization hierarchy. Each subject's T1 imaging data are inhomogeneity corrected via the Insight Journal implementation of N3 (Sled et al., 1998; Tustison and Gee, 2009). PipeDream then performs diffeomorphic normalization via the top-performing (Klein et al., 2009) symmetric normalization methodology, available in ANTS, to map each subject to an existing, labeled elderly/neurodegenerative population template, built from the same scanner and imaging parameters. The template contains prior labeling and probability maps that are used to guide both brain extraction and three-tissue segmentation. Three tissue-segmentation is performed with a Markov Random Field approach (Zhang et al., 2001) implemented in the ANTS ImageMath tool. The cortical and white matter probability maps, in the individual space, are then input to Diffeomorphic Registration-Based Cortical Thickness (DiReCT), a robust tool for image-based thickness estimation that respects sulcal boundaries and prevents over-estimation of thickness via prior-based restrictions (Das et al., 2009). The resulting thickness images are then mapped—via diffeomorphism—back to the space of the T1 imaging template and smoothed with a 2mm standard deviation Gaussian kernel. Finally, the template cortex is used as a region-of-interest over which we will ultimately extract thickness data for input to SCCA.
DTI Processing for Estimating White Matter Integrity
Diffusion-weighted images were pre-processed using the PipeDream interface (http://sourceforge.net/projects/neuropipedream/) to ANTS and the Camino toolkit (Cook et al., 2006). Motion and distortion artifacts were removed by affine co-registration of each diffusion-weighted image to the unweighted (b = 0) image in the diffusion imaging sequence. Diffusion tensors were computed using a linear least squares algorithm (Salvador et al., 2005) implemented in Camino. The diffusion-tensor normalization and template was computed using the DTITK software (http://www.nitrc.org/projects/dtitk/). DTITK uses an iterative procedure (Zhang et al., 2007) to compute deformable, tensor-based mappings that explicitly optimize tensor similarity (Zhang et al., 2006) between each image and an unbiased template. Subject diffusion tensor images were upsampled to 1mm isotropic resolution during the template construction process. The overview of this procedure is in Figure 1.
Figure 1.
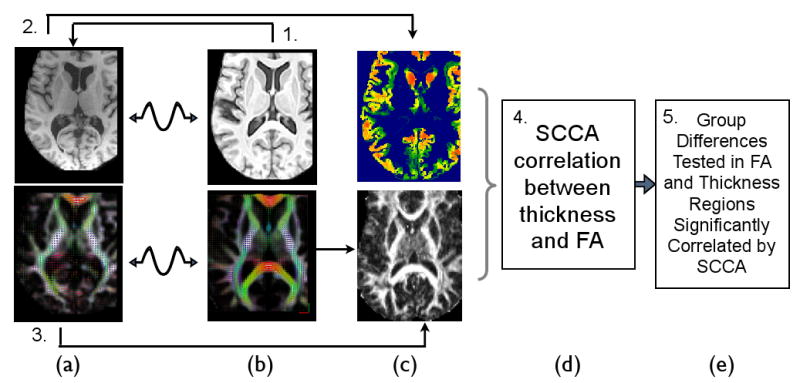
The multivariate image analysis strategy used in this study analyzes DTI and T1 separately until the last step. The individual's DT and T1 space, in column (a), is mapped to the DT and T1 components of the template, in column (b), by modality-specific registration strategies. The Fractional anisotropy in template space is then derived from the deformed DTI data, bottom column (c). The cortical thickness is separately derived from the individual T1 data by performing prior-based image segmentation and DiReCT (Das et al., 2009) thickness estimation. The derived voxel-wise thickness image is then mapped to the template space. In (d), SCCA is used to analyze positive correlations between thickness and FA, without respect to group labelings. Finally, in (e), downstream statistics may be assessed within the significantly correlated regions identified by SCCA. For instance, group statistical tests may be restricted to those voxels in T1 and DTI that are mutually informative thus reducing the multiple comparisons problem while increasing interpretability in bi-modality studies.
2.3. Sparse Canonical Correlation
We use sparse canonical correlation analysis to empirically assess the extent to which white matter disease and cortical disease are predictive of each other in our multivariate data. SCCA achieves this by computing a reduced, optimal “weighted average” of the voxels in each modality's ROI that maximizes the correlation between modalities. This “sparse” selection process serves to control the influence of outliers on the computed correlations and automatically locates the most reliable, but spatially distributed voxels from the ROI. Standard methods of assessing correlation require a more detailed definition of an ROI by hand wherein all voxels are weighted equally. In contrast, SCCA increases power over this traditional strategy by using a regularized energy minimization approach to define the sets of voxels in one modality that are most informative about the other.
Each of N subjects in this study is represented by a normalized thickness image, Tj(x), and a normalized FA image FAj(y). The thickness domain is indexed by x and the FA (DTI space) domain is indexed by y. Within thickness space, we define a cortical mask with nT voxels. Within FA space, we have a mask with nFA voxels. We may then represent the full, masked datasets as two matrices, T and FA, of size N × nT and N × nFA respectively. Note that each entry in the matrix is uniquely associated with one individual and one position in the imaging domain. SCCA's goal is then to find a pair of nT and nFA entry weight vectors, ωT and ωFA, such that the Correlation(TωT, FAωFA) is maximized (with additional constraints ‖ωT‖2 ≤ 1, ‖ωFA‖2 ≤ 1). For each subject, then, we have a projection of that subject's data given by the ω. The thickness projection for subject j is then TjωT and the sum over TjiωTi indexes the spatial variation through the thickness mask. Similarly, the FA projection is given by FAjωFA. To make this computation feasible and the solution unique, one of a variety of constraints on the problem may be used (Witten and Tibshirani, 2009; Witten et al., 2009; Parkhomenko et al., 2009; Cao et al., 2009). Here, we assume that the within-modality covariance matrices can be approximated by the identity; we also center our data matrices s.t. each subject's data vector has zero mean.
For the problem of multivariate association between cortical thickness and FA, we choose positivity and sparseness constraints as proposed by Witten et al. (2009). These constraints improve interpretability of our results by enabling only unidirectional associations to be investigated. Positivity constraints enable us to test, specifically, the linear, positive variation of FA with cortical thickness. Sparsity constraints are also attractive from an interpretation standpoint—the method's sparsity excludes the voxels in each modality that are of little importance in predicting the voxels in the other modality. One thus localizes the relationship to important brain sub-regions that are correlated across modalities. These constraints are ωTi ≥ 0, ωFAk ≥ 0 and ‖ωT‖1 ≤ CT, ‖ωFA‖1 ≤ CF where C is a constant related to the desired sparseness imposed by the L1 penalty, ‖ · ‖1. The positivity constraint guarantees that both ω will have positive entries and may thus be viewed as a weighted average of the data. The sparseness constraint influences the fraction of masked voxels that will have non-zero weights or, equivalently, the number of entries in the ω that will be greater than zero. Under this formulation, SCCA will optimize the following maximization criterion:
| (1) |
where ‖ωT‖2 ≤ 1, ‖ωFA‖2 ≤ 1, the λ are inversely related to C and with additional constraints that ωTi ≥ 0, wFAk ≥ 0. Witten and Tibshirani (2009) provide a solution to this optimization problem, which may also be thought of as maximizing the Pearson correlation between the projections under the given constraints. The free parameters λF, λT determine the sparseness of the calculation where the penalty term ‖ · ‖1 indicates the L1 norm or “lasso” penalty. Decreasing λ increases the number of non-zero terms in the ω. Note that by masking the FA and T images in pre-processing we are fixing some of the weights in the domain of the weight vectors to be zero. For this study, we choose λF, λT such that approximately half of the voxels within the input mask for each modality are non-zero on output. This choice was made to focus the study on distributed networks of effects while also reducing non-informative noise in the input data. Note also that we take only the first component of the SCCA solution. Importantly, we note that ongoing work shows that CCA and some implementations of PLS may be equivalent (e.g. Chen et al. (2009a); Sun et al. (2009)). In particular, the least squares (not penalty) term in our objective is equivalent to that provided by the Chen et al. (2009a) PLS implementation. However, Chen, et al. do not use sparsity or positivity constraints.
We may also use permutation testing to quantify the significance of the networks identified by SCCA. For a given study group, we randomly reassign the pairings of the input images such that many pairs (FAi, Tj) occur with i ≠ j. Thus, the SCCA will be computed on paired data where the two views are not taken from the same subject. One then stores the estimated correlation values for the multi-view solution for all of P permutations of labels. The p-value of the original correlation is then ρ/P where ρ is the number of times the permuted correlation equaled or exceeded the original correlation value. If the p-value of the SCCA correlations is high, the identified network is not significantly related to the distinct pairing of the individual's cortical and white matter anatomy. We also used Monte-Carlo simulations with randomized data to show that our permutation-based design indeed produces only 44 instances over 1000 simulations with p-values < 0.05.
3. Results
Syndrome-Specific Patterns of Network Degeneration
Permutation testing of SCCA correlations were performed on the combined FTD and control dataset and, separately, the combined AD and control dataset. This design assesses disease-specific variation relative to controls (versus combining all patients with controls or assessing FTD plus AD variation without controls). Both SCCA runs were performed with 2000 iterations with no single instance of permuted outcome exceeding the unpermuted correlation. Thus permuted p < 0.0005. Furthermore, the weight vectors (the canonical weights) resulting from these analyses are shown in Figure 2 and indicate a pattern of effects that are brought out distinctly between FTD and AD. The non-zero weighted regions determined by SCCA provide a unique anatomical signature associated with each syndrome. We diffeomorphically mapped the DT template to the T1 template space to enable display of the multivariate results in the T1 template space. The mapping technique uses a cross-correlation similarity measure between the FA of the DTI template and the T1-weighted MRI. However, this was done after all statistics were computed and was used only for visualization.
Figure 2.
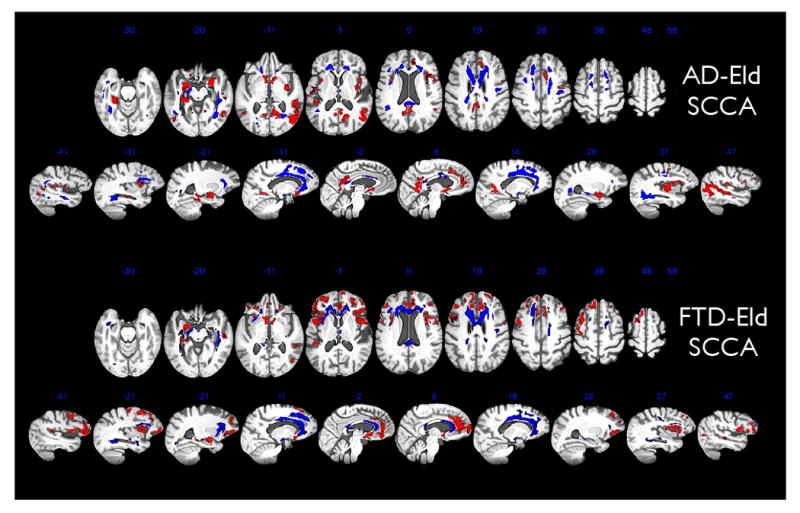
This figure shows FA regions in blue that SCCA-correlate with the cortical atrophy in the red areas for both the AD-Eld and FTD-Eld analysis. Results are aggregated in a population-specific template across 23 elderly subjects, 25 FTD and 24 AD subjects and which integrates modalities into a common reference frame. Thickness and FA values derived from T1 and DTI are then related across elderly, AD and FTD through our multivariate SCCA imaging strategy. In this figure, the DTI component of the analysis has been mapped diffeomorphically to the T1 template in order to show both cortical (red) and white matter effects (blue) within the same space. For both images, brighter red/blue voxels indicate greater importance for the correlation. Most of the variation in brightness is along the edges of the regions. Both axial views and sagittal views of our imaging results are shown. The AD-Eld SCCA analysis shows the SCCA weights derived from grouping the elderly and AD data. The FTD-Eld SCCA analysis shows the SCCA weights derived from grouping the elderly and FTD data. The significance of the SCCA associations for each group was p < 0.005, assessed by permutation.
Cortico-Connective Network Differences Between Populations
The projected FA and thickness values for each experiment are shown in Figure 5. SCCA projections provide a separating trend between the groups that is induced naturally from the variance that exists within the data. One-sided T-tests were performed between the projected values to evaluate whether significant differences between groups occur in the set of selected FA and thickness voxels. When testing the hypothesis that AD FA is reduced relative to elderly controls, we find p < 0.0008; the same test on cortical thickness gives p < 0.0004. For the FTD versus elderly contrast in FA, we find p < 1.831e − 05; for the FTD versus elderly contrast in thickness, p < 0.0002. Note that we explicitly test whether the diseased groups have reduced values relative to controls (one-sided tests). Figure 5 also reveals a trend suggesting that FTD provides a steeper gradient of association between cortical and white matter atrophy when compared to AD. Both AD and FTD subjects delineate steeper trends of association when projection data is fit with regression lines separately from the controls.
Figure 5.
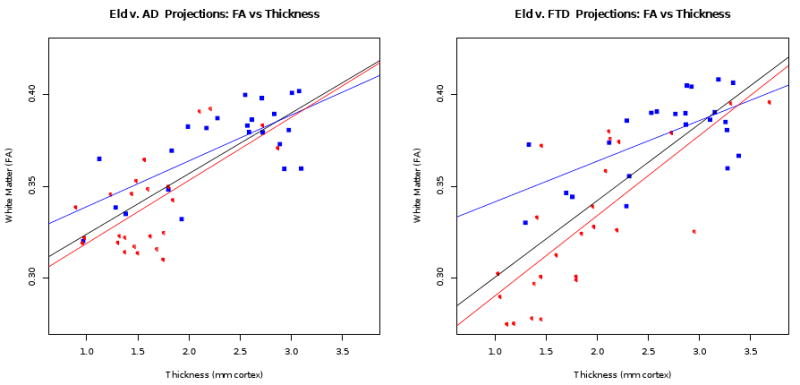
FA and thickness projections for elderly and AD groups (left) and elderly and FTD groups (right). Each subject is projected to a point on this graph where we have an aggregate summary of the FA and thickness relationships over the network of voxels selected from each modality by SCCA. In each plot, red open circle points indicate the diseased group and blue closed squares indicate the control group. The black regression line fits all data points while red fits the diseased group and blue the control group. The regression lines are each fitted between the FA projection and the thickness projection, for each group.
We further refine these observations by using SCCA for dimensionality reduction. SCCA pre-processing is used to select voxels before directly contrasting AD with elderly controls, FTD with elderly controls and the more subtle AD versus FTD group differences. In each case, we apply SCCA to the full groupings (without diagnosis information) and then perform mass univariate group tests within the SCCA selected voxels. Here, we apply voxel-wise Wilcoxon rank-test comparisons to test for differences in thickness or FA. These analyses use one-sided tests. For each diseased group, relative to controls, we test where the diseased group has reduced FA/thickness within their respective SCCA-defined masks. That is, for the AD < control comparison, we use the AD-Eld mask and, for the FTD < control comparison, we use the FTD-Eld mask. For the contrasts FTD < AD and AD < FTD, we used an AD-FTD SCCA mask. Thus, tests are performed within the relevant SCCA-identified networks. We also restrict the analysis to the non-zero components of the SCCA weights in order to both increase interpretability of differences and increase sensitivity by reducing the multiple comparisons problem. Significance of the voxel-wise, false-discovery rate corrected comparison of AD-FTD groups along these restricted regions is visualized in Figure 3 and reported—region-wise—in Table 1 and Table 2. Regions were identified with the aid of labeled templates shown in figure 4. The tables were produced by analyzing the volume of effect within each labeled region in both the T1 and DTI template and reporting the minimum p-values within each region.
Figure 3.
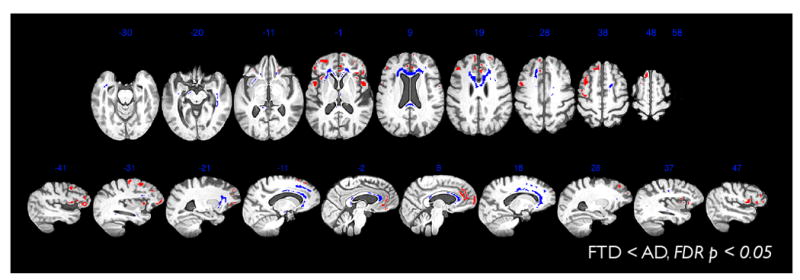
SCCA is valuable for dimensionality reduction. Thus, we use the regions found in AD-FTD SCCA to test for AD < FTD effects. No results were found where the FDR corrected p-value < 0.05. We also test for FTD < AD effects. Results are shown here which survive FDR corrected p-value < 0.05. FTD < AD effects are present in both white matter and cortex in many of the original areas selected by SCCA. Note that when the same FTD-AD analyses are performed within a mask including all voxels in the brain, the results do not survive FDR correction for either FA or cortical thickness. Thus, the SCCA restricted comparison has, in this study, enhanced detection power.
Table 1.
The table summarizes cortical group statistics within cortical regions that significantly SCCA-correlate in toto with white matter integrity. The significantly affected volume within each anatomical area is reported as Vol along with the minimum p-value in that region. Voxel-wise Wilcoxon rank-sum statistics were used. The raw p-values were then FDR corrected with significance selected at corrected p-value < 0.05 with a minimum cluster size of 20 mm3. The AD-Elderly test were performed using the AD-SCCA regions as a mask. The FTD-Elderly and FTD-AD tests used the FTD-SCCA regions as a mask. No highlighting indicates all contrasts are significant; blue highlighting indicates only the FTD contrasts; yellow highlighting indicates that both the contrasts with elderly are significant; gray highlighting indicates only the FTD-Elderly contrasts reach significance; pink indicates AD-Elderly alone is significant.
| Cortical anatomy | AD < ELD | FTD < ELD | FTD < AD | |||
|---|---|---|---|---|---|---|
| Vol. (mm3) | Min p | Vol. | Min p | Vol. | Min p | |
| L. Cingulate Gyrus | 616 | 0.00001 | 1928 | 0.00002 | 1024 | 0.00187 |
| R. Cingulate Gyrus | 2960 | 0.00001 | 2600 | 0.00004 | 1096 | 0.01882 |
| R. Insula | 1616 | 0.00031 | 488 | 0.00001 | 416 | 0.00593 |
| L. Sup. Frontal Gyrus | 136 | 0.01309 | 3448 | 0.00002 | 2208 | 0.00890 |
| R. Sup. Frontal Gyrus | 1880 | 0.00026 | 2776 | 0.00014 | 912 | 0.01882 |
| R. Mid. Frontal Gyrus | 1296 | 0.00058 | 1328 | 0.00012 | 384 | 0.01533 |
| R. Inf. Frontal Gyrus | 1480 | 0.00022 | 1864 | 0.00000 | 1736 | 0.00073 |
| R. Orbital Frontal Gyrus | 560 | 0.00214 | 1840 | 0.00001 | 1008 | 0.00318 |
| R. Precentral Gyrus | 912 | 0.00046 | 264 | 0.00009 | 152 | 0.01700 |
| L. Temporal Pole | 296 | 0.00014 | — | — | — | — |
| R. Temporal Pole | 184 | 0.00996 | — | — | — | — |
| R. Parahippocampal Gyrus | 1288 | 0.00001 | — | — | — | — |
| L. Sup. Parietal/Precuneus | 96 | 0.00000 | — | — | — | — |
| R. Sup. Parietal/Precuneus | 720 | 0.00001 | — | — | — | — |
| R. Postcentral Gyrus | 856 | 0.00106 | — | — | — | — |
| R. Sup. Temp. Gyrus | 1376 | 0.00002 | 40 | 0.00803 | — | — |
| L. Infero. Temp. Gyrus | 72 | 0.00122 | 192 | 0.00087 | — | — |
| R. Infero. Temp. Gyrus | 4720 | 0.00004 | 504 | 0.00008 | — | — |
| L. Parahippocampal Gyrus | 680 | 0.00000 | 880 | 0.00005 | — | — |
| R. Inf. Parietal Lobe | 6216 | 0.00002 | 200 | 0.00060 | — | — |
| L. Sup. Temp. Gyrus | — | — | 760 | 0.00044 | — | — |
| L. Inf. Parietal Lobe | — | — | 440 | 0.00212 | — | — |
| L. Postcentral Gyrus | — | — | 264 | 0.00478 | — | — |
| L. Insula | — | — | 888 | 0.00001 | 288 | 0.02652 |
| L. Frontal Pole | — | — | 1392 | 0.00011 | 1040 | 0.01615 |
| R. Frontal Pole | — | — | 2032 | 0.00016 | 592 | 0.01789 |
| L. Mid. Frontal Gyrus | — | — | 3984 | 0.00000 | 2336 | 0.00098 |
| L. Inf. Frontal Gyrus | — | — | 2592 | 0.00000 | 1576 | 0.00079 |
| L. Orbital Frontal Gyrus | — | — | 5000 | 0.00001 | 3464 | 0.00031 |
| L. Precentral Gyrus | — | — | 832 | 0.00000 | 336 | 0.01615 |
Table 2.
The table summarizes white matter group statistics within white matter regions that significantly SCCA-correlate in toto with cortical thickness. Voxel-wise Wilcoxon rank-sum statistics were used. The raw p-values were then FDR corrected with significance selected at corrected p-value < 0.05 with a minimum cluster size of 20 mm3. The AD-Elderly test were performed using the AD-SCCA regions as a mask. The FTD-Elderly and FTD-AD tests used the FTD-SCCA regions as a mask. White matter regions in FTD focus in the left anterior corona radiata, the splenium, the genu, the bilateral uncinate (left in particular) and the inferior longitudinal fasciculus. In contrast, AD more strongly involves right superior longitudinal fasciculus and the mid-body of the callosum, along with anterior, right temporal lobe white matter tracts and supplemental motor area. No highlighting indicates all contrasts are significant; blue highlighting indicates only the FTD contrasts; yellow highlighting indicates that both the contrasts with elderly are significant; gray highlighting indicates only the FTD-Elderly contrasts reach significance; pink indicates AD-Elderly alone is significant.
| White matter anatomy | AD < ELD | FTD < ELD | FTD < AD | |||
|---|---|---|---|---|---|---|
| Vol. (mm3) | Min p | Vol. | Min p | Vol. | Min p | |
| L. corticospinal Tract | 1696 | 0.00020963 | 608 | 1.01E-06 | 280 | 0.00064981 |
| R. corticospinal Tract | 2000 | 0.000158966 | 344 | 0.000141561 | 48 | 0.0157923 |
| L. inferior longitudinal fasciculus | 24 | 0.0206661 | 424 | 7.34E-05 | 24 | 0.0108836 |
| R. inferior longitudinal fasciculus | 1952 | 0.000357449 | 720 | 1.42E-05 | 280 | 0.015609 |
| L. inferior fronto-occipital fasciculus | 968 | 0.000174463 | 3728 | 1.13E-06 | 1408 | 3.39E-05 |
| R. inferior fronto-occipital fasciculus | 2224 | 9.87E-05 | 2432 | 2.80E-06 | 1512 | 0.00293112 |
| L. uncinate fasciculus | 160 | 0.000229537 | 536 | 8.94E-07 | 424 | 0.00013715 |
| R. uncinate fasciculus | 256 | 0.00220811 | 216 | 0.000312626 | 216 | 0.00385225 |
| Anterior corpus callosum | 5368 | 4.90E-05 | 8088 | 2.38E-07 | 5976 | 0.000945151 |
| Posterior corpus callosum | 3824 | 2.44E-06 | 1744 | 1.67E-06 | 376 | 0.00135899 |
| Mid-body corpus callosum | 480 | 8.12E-05 | 5208 | 0.000202656 | 232 | 0.01732 |
| L. superior longitudinal fasciculus | 992 | 0.000229537 | — | — | — | — |
| R. superior longitudinal fasciculus | 408 | 0.000822663 | 480 | 0.00615722 | — | — |
Figure 4.
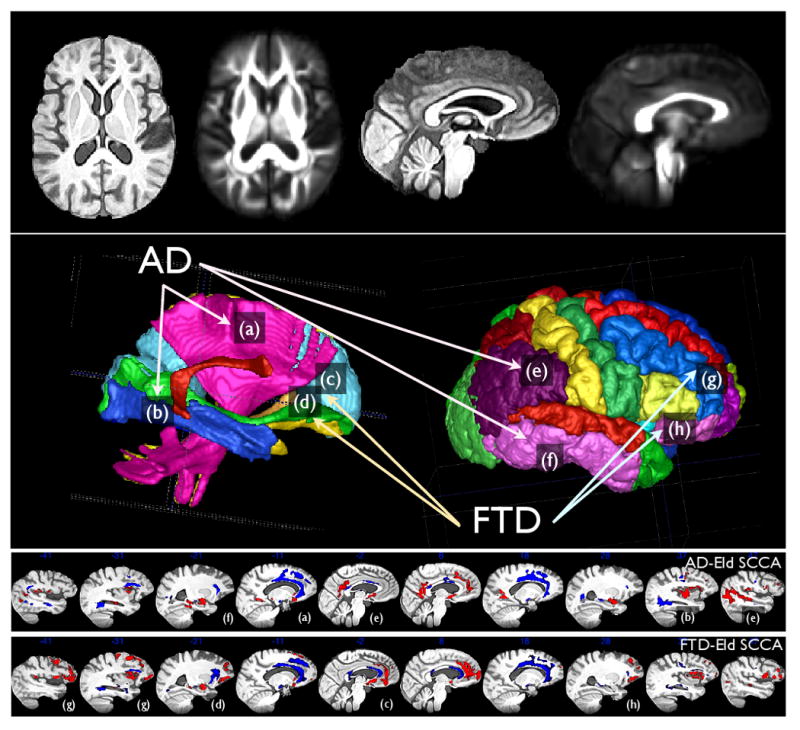
The DTI template's FA image and the T1 template are shown together after diffeomorphically mapping to the same space in the top row. The middle row shows the labels that aided the annotation in the results tables and to help guide interpretation. The bottom rows reproduce the sagittal slices of the AD and FTD SCCA results. The figure also connects some of the prominent labeled anatomical regions with the SCCA results. Label (a) indicates the corticospinal tract (cst) in both the labeled DTI space (middle left) and in the AD-Eld SCCA results. We also highlight the inferior longitudinal fasiculus (b), anterior corpus callosum (c) and the inferior fronto-occipital fasciculus (d). Cortical labeling points to the inferior parietal lobe/posterior cingulate (e), the inferior temporal lobe (f), the middle frontal gyrus (g) and the orbitofrontal cortex (h). These regions were selected to bring attention to some areas of difference between FTD and AD SCCA results.
Specifically, FTD cortical thickness showed the strongest and largest differences from controls in bilateral insula, left middle frontal gyrus, bilateral inferior frontal gyrus, bilateral orbitofrontal gyrus and left precentral gyrus, as well as left and right cingulate gyrus, with the burden focused in the anterior/inferior part of the cingulate. Likewise, in white matter, the uncinate, inferior-frontal-occipital and anterior corpus callosum projections are densely involved in FTD. SCCA also revealed that, of the three groups, FTD showed the strongest associations between large-scale variation in FA and variation in cortical thickness as evidenced by Figure 5.
Cortical regions where AD induces the strongest differences from controls are the left temporal pole, right superior/inferior temporal gyrus, left and right parahippocampal/hippocampal regions, right inferior parietal lobe and left and right precuneus. Correlated white matter tracts that are significantly compromised in AD include the superior longitudinal fasciculus, inferior frontal-occipital fasciculus, descending corticospinal fibers and the corpus callosum.
When we compare the FTD-Elderly contrast with the AD-Elderly contrast, we see that AD shows relatively distinct temporal-parietal, posterior temporal, precuneus and hippocampal regions and greater involvement of superior longitudinal, inferior frontal-occipital and arcuate fasciculi and mid-body of the corpus callosum. AD also more strongly affects the temporal pole, the right parahippocampal gyrus and the precuneus relative to FTD, with respect to controls, although these effects do not appear in the direct contrast of the diseases. In FTD, extensive regions of frontal cortex were significantly thinner relative to AD, while reduced FA in genu contributed to the correlation with frontal-lobe cortex. Anterior cingulate, in particular, is strongly present in FTD SCCA results relative to AD. In AD, the mid-body of the callosum was involved along with white matter superior to the mid-body of the cingulate gyrus.
Network Degeneration and Behavioral Correlations
The projected thickness and FA values are determined from the selected, correlated voxels as determined by both the FTD and AD experiments. Given the unique etiology of these diseases and their unique cognitive signatures, we further test whether the projections relate to neuropsychological tests derived from the same subjects. Mini-Mental State Examination (MMSE) is routinely applied in AD diagnosis, has previously been associated with AD-related decline (Moon et al., 2008) and correlates with episodic memory loss (Hill and Baeckman, 1995; Small et al., 1997; Carcaillon et al., 2009). MMSE is also shown to correlate with the presence of neurofibrillary tangles (Sabbagh et al., 2009). While MMSE is a reliable measure of disease severity in AD, MMSE does not reliably reflect dementia severity in FTD and many severely impaired FTD patients may have a normal MMSE score (Gregory et al., 1999; Libon et al., 2007b,a; Torralva et al., 2009). The verbal fluency test, FAS, has been used to examine executive function deficits in FTD (Giovagnoli et al., 2008; Huey et al., 2009). In longitudinal studies of autopsy-confirmed cases, patients with FTD spectrum pathology are significantly more impaired than AD throughout the entire course of disease (Grossman et al., 2008). We thus use linear regression to determine the extent which the projected FA and projected thickness values for each group predict FAS and MMSE scores. The standard regression representation is S ≈ βFAFAproj + βTHTHproj + ε where S is the vector of cognitive scores, β are scalars and the thickness and FA projections are vectors. For AD, we find a significant association of the FA plus thickness model with MMSE score (p < 0.048) while there is no significant association between the projections and verbal fluency (p < 0.8). In contrast, the FTD projections reveal a strong relationship between FA plus thickness and verbal fluency (p < 0.008) and no relationship with MMSE (p < 0.17). These tests suggest the projections derived by SCCA provide valuable unsupervised selection of regions of interest that have a relevant relationship to neuropsychological performance. All statistical tests were performed with R software (www.r-project.org).
4. Discussion
SCCA revealed significantly correlated, disease-specific patterns of white matter degeneration and cortical atrophy across the brain that differ in FTD and AD. While both diseases cause significant differences from healthy elderly controls, FTD appears to have a more severe effect over those white matter and cortical regions which undergo correlated atrophy. The SCCA projections, when examined by sub-group statistical tests, revealed significant large-scale differences between elderly controls and patients that derive largely from the regions defined in Tables 1, 2 and visualized in Figure 2. The AD disease pattern presented a unique relationship with MMSE, while the FTD pattern related to verbal fluency. Moreover, distinct cortical-white matter networks that are degraded in AD and FTD correspond to areas of disease observed in pathologic studies of the anatomic distribution of lesion burden. In sum, SCCA provides an unsupervised approach to defining disease-relevant, degraded cortical-white matter networks. At the same time, SCCA greatly reduces the multiple comparisons problem.
4.1. Comparison with the ROI Approach
The most common approach to performing cross-modality analysis in medical imaging is the ROI technique (Kochunov et al., 2007; Sydykova et al., 2007). Region of interest methodology requires identifying sub-regions manually, in one modality, for correlation across all voxels in the second modality. There are several limitations to such an approach. First, this strategy is asymmetric—one must decide to correlate a white matter region with all gray matter voxels or vice versa. SCCA, in contrast, offers an unsupervised, yet principled, solution to this correspondence problem. The second limitation is apparent when one considers performing this type of analysis over “all pairs”, that is, to correlate N cortical thickness voxels with M voxels in another modality, such as FA. In this case, one obtains a cross-product matrix of correlations that would have N × M number of entries—N × M would typically be in the one million squared range. Computing such a matrix is far more computationally expensive than an efficiently implemented SCCA. Finally, the multiple comparisons correction for such an analysis would be highly conservative. Thus, for all of these reasons, traditional ROI analyses are currently constrained to few regions and do not lend themselves to large-scale evaluation of associations between imaging modalities.
SCCA provides one way to resolve two additional disadvantages of the ROI strategy. First, ROIs require one to compress a complex signal pattern into a single statistic such as a regional average or median value. This may result in loss of detection power. Our alternative, SCCA, computes a set of weights that prioritize the most informative voxels in the dataset and provide a linear combination between the input datasets that is optimal with respect to Pearson correlation. Second, traditional correlation is sensitive to the vector basis used to represent multi-dimensional data, a problem resolved by SCCA (Hardoon et al., 2004). That is, SCCA computes the basis (coordinate system) that maximizes the correlation matrix. A well-known example may be found in (Borga, 2001). In comparison to ROIs, SCCA optimally leverages the predictive relationship between sets of features acting together in a complex way. While SCCA has advantages over the ROI strategy, the regions selected by SCCA are not directly hypothesis-driven as are a priori defined ROIs. On the other hand, SCCA has the advantage of minimizing experimenter bias while using the data to drive associations that are relevant to neuroimaging studies. Below, we discuss our experimental evidence that, in this application, unsupervised SCCA is “choosing” neuroanatomical areas that are disease-relevant.
4.2. Validity of SCCA Results and Relevance of SCCA Regions
The anatomic networks selected by SCCA correspond to expected areas of disease based on other T1, DTI and pathology studies. In patients with autopsy- and CSF-confirmed disease, SCCA revealed that FTD affects frontal cortical-connectivity networks with a spatial distribution shown in Figure 2. The overwhelming bulk of the disease involves frontal and temporal cortical regions, as observed in clinical-pathological studies (Forman et al., 2006; Grossman et al., 2007a, 2008; Josephs et al., 2006b). The areas involved in FTD may provide a neuroanatomical substrate for executive function and mental search, important cognitive components underlying performance on confrontation tests (Grossman et al., 2004). In AD, SCCA revealed strong parieto-temporal involvement across both white matter and cortex. In particular, the AD network involves a large parietal lobe region of cortex and a large anterior cingulate region of cortex, though focused more superiorly than the anterior cingulate effect of FTD. The areas localized to AD in this study have been hypothesized as neuroanatomical substrates for visuospatial and episodic memory (Hodges et al., 1999; Jagust et al., 2006) and their deficit may underly the association between the SCCA projections and MMSE. Precuneus and medial temporal lobe have been identified in post-mortem studies of AD (Rabinovici et al., 2007; Sabbagh et al., 2009), while temporal pole atrophy in AD has been validated post-mortem (Arnold et al., 1994). Sabbagh et al. (2009) also showed that neuropsychological testing correlates with neuropathology in AD, while Whitwell et al. (2008b) showed that MRI atrophy patterns relate to anatomical distribution of neurofibrillary tangle pathology. Overall, as anticipated in our diseased-group versus healthy control analysis, AD also showed a stronger medial temporal lobe and posterior temporal/inferior parietal and posterior cingulate cortical involvement in contrast to FTD.
Our direct comparison of AD and FTD shows significantly greater cortical atrophy and reduced FA in FTD, relative to AD in inferior frontal, medial frontal and prefrontal cortical regions. In particular, anterior cingulate gyrus and middle, inferior and orbitofrontal gyrus were thinner in FTD than in AD, with greater differences on the left. Left superior frontal gyrus was also reduced. In cortex-associated white matter, the genu of the corpus callosum, the left inferior fronto-occipital fasciculus and the cingulum showed the primary differences, along with the left-sided uncinate and bilateral anterior corona radiata. One smaller region of periventricular splenium also showed reduced FA in FTD relative to AD. AD showed no areas of significant reduction in cortical thickness or white matter integrity relative to FTD. However, for reference, we report in Figure 6 an uncorrected, one-sided statistical test for locations where, in FA or thickness, AD < FTD. A trend towards significant difference appears in the inferior parietal lobe in FA and in the precuneus and posterior temporal lobe in thickness. However, these do not survive FDR correction. Though our results do not directly support it, this study design cannot rule out the possibility of an AD-induced correlation between precuneus atrophy and posterior parietal FA reduction.
Figure 6.
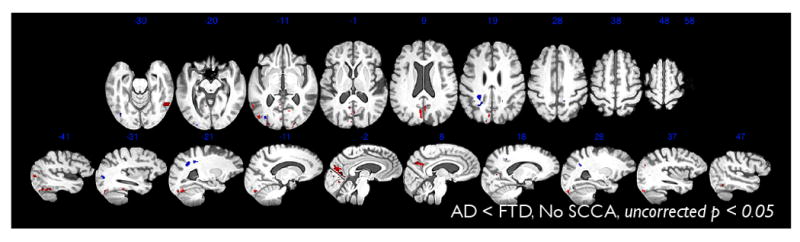
This figure shows slices from a whole brain, uncorrected map (p < 0.05) of the regions where AD < FTD in either cortical thickness (red) or FA (blue). This contrast indicates that some regions of the brain show a trend towards being more affected by AD than FTD, although these effects did not survive FDR correction, were not selected by CCA and may not show cross-modality association.
A series of studies have contrasted image-based cortical atrophy patterns between FTD and AD (Grossman et al., 2004; Bonte et al., 2004; Bocti et al., 2006; Du et al., 2007; Richards et al., 2009; Young et al., 2009); some have used machine learning (Kloeppel et al., 2008); few have used post-mortem or CSF biomarker diagnoses (Whitwell et al., 2008a,b), and few have contrasted distinguishing white matter patterns (Chen et al., 2009b; Zhang et al., 2009). None have performed a bivariate analysis like that performed here where we use data from autopsy or CSF biomarker-diagnosed patients and take advantage of the innate variability in disease and imaging to identify significantly associated effects in DT and T1-derived measures.
In white matter, (Zhang et al., 2009) also showed reduced FA in FTD relative to AD, with no effects in the opposite direction. Similarly, (Whitwell et al., 2008a) used T1-weighted MRI from autopsy proven subjects to show a greater rate of overall atrophy in FTD relative to AD (ventricular expansion of 23 ml/year compared to 10 ml/year). (Krueger et al., 2009) also showed that regional atrophy rates were not significantly higher for AD in any brain region compared with frontotemporal dementia. Barnes et al. (2007) used autopsy or genetically confirmed patient data—with the AD group age-matched to the FTD group—to show higher atrophy rates in FTD relative to AD in anterior cingulate. Richards et al. (2009) showed that precuneus and medial temporal lobe atrophy may be greater in AD than in FTD, but the subjects recruited in that study were considerably older than typical FTD (average age 75.1), the subjects lacked pathologically confirmed or CSF biomarker-aided diagnosis and the groups were unbalanced (38 AD vs. 11 FTD). Du et al. (2007) showed that clinically diagnosed AD had higher atrophy in precuneus and in left temporal regions, relative to clinically diagnosed FTD—but the AD group appeared to be more clinically impaired because of their significantly lower MMSE than the FTD group. However, MMSE is a poor overall measure of severity in FTD. Thus, one may also consider that our FTD subjects—matched by MMSE to our AD subjects—may be relatively more impaired than those in (Du et al., 2007). Although our groups with autopsy or CSF biomarker-diagnosed disease were matched demographically at the time of imaging and equally sized, we cannot rule out that our power is not enough to detect the smaller regions where AD atrophy out-paces FTD. Additional comparative studies with larger group sizes of well-defined patients are needed to address this possibility.
4.3. Cognition and Disease Pathways
Another source of validation comes from cognitive assessments. This study revealed unique regions of involvement induced by FTD and AD in both cortical and connective tissues and that in toto, these regions represent thickness and FA values that relate to distinct cognitive measures that are impaired in these patient groups. The MMSE is much more sensitive to disease severity in AD than FTD. Correspondingly, the MMSE was significantly related to the degraded cortical-white matter network in AD as identified by SCCA, but was not correlated with the FTD profile. Previous work has related MMSE to cortical atrophy (Moon et al., 2008) and pathology (Sabbagh et al., 2009).
By comparison, FTD are much more sensitive to the FAS measure of category naming fluency than AD patients. We found that FAS performance correlated with the degraded network identified by SCCA in FTD but not AD. Previous work has related FAS category naming fluency to imaging (Libon et al., 2009a) and pathology in FTD (Grossman et al., 2007a, 2008). This double dissociation underlines from an entirely different perspective the unique patterns of degraded cortical-white matter networks found in FTD and AD. Complex cognitive measures such as these are thought to be supported by large-scale neural networks that involve cortical regions integrated by white matter projections and whose disruption may underly functional network deficits (Seeley et al., 2009). SCCA represents an important and novel method for examining the network basis for cognitive deficits in neurodegenerative diseases.
4.4. Limitations of the Approach
Several caveats should be kept in mind when considering our results. One limitation of this study is the lack of statistical power. As SCCA is sensitive to variability in a population, a small group will reduce detection power for a given SCCA study. So, in many cases, group sizes of less than a few dozen may prove too small to lead to significance under permutation. Similarly, because SCCA requires a degree of variability across modalities to detect effects, SCCA will fail to produce significant associations when either floor or ceiling effects are present in the data. That is, when a variable reaches a minimum in one modality and not another, SCCA will not produce unique correlations under permutation due to the lack of variance in the modality that has the floor/ceiling effect. Additionally, we examined only a limited range of clinical-imaging correlations and more work is needed to fully assess other cognitive measures in these patient groups.
SCCA may be used to automatically locate regions across modalities that are significantly associated. In contrast, SCCA will not identify disease-effects that occur in only one of the two modalities. A separate univariate design and follow-up comparison with SCCA results through conjunction methods would be required to locate regions that are affected in only one of the two modalities. Similarly, to localize cognition-anatomy correlations to specific voxels (as opposed to the aggregate effects we sought there), one would require a univariate, voxel-wise design that would cause severe multiple comparisons correction that SCCA allowed us to avoid here. Parameter selection is also important. Our model is insensitive to inverse relationships between modalities because we sought only positive correlations. Depending on how the sparseness parameter is selected, one will either gain large, distributed regions or a much smaller, isolated set of regions. Large regions have the advantage of revealing wide-spread effects, but also the disadvantage of reducing the resolution of the findings. As in this work, a large set of SCCA-defined regions must be investigated further to localize differences in more detail within the regions. Also, here, we have investigated only the first canonical variate. Similar disadvantages in interpretation arise when one considers more than just the first canonical variate, an enterprise we leave to future work.
Double-dipping (Kriegeskorte et al., 2009) is another possible concern with this analysis. Double-dipping is characterized by reusing training data as testing data with the same outcome measures or predicted variables in both stages. A typical example would proceed as follows: (1) correlate all imaging data with a neurocognitive score; (2) use outcome of (1) to select regions of interest; (3) relate ROI values with the neurocognitive score in the same subjects. In this toy example, the problem is that the neurocognitive score is used in both (1) and (3) and with the same imaging dataset. Our study avoids this because the SCCA analyses are unsupervised and do not directly reference neurocognitive scores or diagnoses. SCCA instead uses mutual variance in the data to drive the voxel selection process. Thus, testing for differences in measures between groups is an independent question, as is whether the SCCA projections are related to neurocognitive scores within diagnosis groups as these variables do not enter the voxel selection criteria. Thus, we recommend future work to use the following recipe when using SCCA for dimensionality reduction and/or assessing cross-modality association: (1) Apply SCCA to select voxels independent of diagnosis within a global region of interest (e.g. the cerebrum); (2) Use permutation testing to assess the significance of the cross-modality association. (3) Use the SCCA results to select subsets of the original data spaces to restrict the group analyses (dimensionality reduction) through contrast-specific masking. For instance, in our contrast of AD versus FTD we applied SCCA on the combined FTD-AD groups to select relevant sub-regions of the brain within which we test for group differences. The same is done for FTD-Elderly and AD-Elderly comparisons. As the first and second step ignore diagnosis, the third step is free of double dipping. These steps are precisely what we did in analyzing FTD-Elderly, AD-Elderly and AD-FTD differences.
5. Conclusion
To our knowledge, this is the first demonstration of a consistent and integrated analysis of DTI and cortical thickness in an autopsy and CSF biomarker-diagnosed imaging population. We established the validity of this new approach by associating its findings with both neuropsychological testing and known patterns of anatomical effects in well-studied disorders. Our findings suggest that FTD and AD induce correlated white matter and cortex degeneration and that these diseases act through unique pathways. This multivariate imaging analysis and integration with SCCA demonstrates a powerful new paradigm of investigation that may be extended to other populations and experimental designs and may be adapted to both a priori and exploratory studies. While explicitly reducing the size of the ROIs or increasing the sparseness penalty is one way to restrict the findings to smaller regions/networks, more work is needed to directly assess the statistical significance of the weights defining the canonical variates or projections. A boostrap method such as that used by Chen et al. (2009a) provides one possible solution. Future work will focus not only on assessment of the weights—and potential inclusion of more variates in the analysis—but also on extending these analyses to tri-variate studies. We also will extend these analyses to help discriminate disease patterns between FTD phenotypes.
Acknowledgments
This work was supported in part by NIH (AG17586, AG15116, NS44266, and NS53488).
Footnotes
Publisher's Disclaimer: This is a PDF file of an unedited manuscript that has been accepted for publication. As a service to our customers we are providing this early version of the manuscript. The manuscript will undergo copyediting, typesetting, and review of the resulting proof before it is published in its final citable form. Please note that during the production process errors may be discovered which could affect the content, and all legal disclaimers that apply to the journal pertain.
References
- Arnold SE, Hyman BT, Hoesen GWV. Neuropathologic changes of the temporal pole in Alzheimer's disease and Pick's disease. Arch Neurol. 1994 Feb;51(2):145–150. doi: 10.1001/archneur.1994.00540140051014. [DOI] [PubMed] [Google Scholar]
- Avants B, Duda JT, Kim J, Zhang H, Pluta J, Gee JC, Whyte J. Multivariate analysis of structural and diffusion imaging in traumatic brain injury. Acad Radiol. 2008 Nov;15(11):1360–1375. doi: 10.1016/j.acra.2008.07.007. [DOI] [PMC free article] [PubMed] [Google Scholar]
- Avants BB, Duda JT, Zhang H, Gee JC. Multivariate normalization with symmetric diffeomorphisms for multivariate studies. Med Image Comput Comput Assist Interv. 2007;10(Pt 1):359–366. doi: 10.1007/978-3-540-75757-3_44. [DOI] [PubMed] [Google Scholar]
- Ballmaier M, O'Brien JT, Burton EJ, Thompson PM, Rex DE, Narr KL, McKeith IG, DeLuca H, Toga AW. Comparing gray matter loss profiles between dementia with lewy bodies and Alzheimer's disease using cortical pattern matching: diagnosis and gender effects. Neuroimage. 2004;23:325–335. doi: 10.1016/j.neuroimage.2004.04.026. [DOI] [PubMed] [Google Scholar]
- Barnes J, Godbolt AK, Frost C, Boyes RG, Jones BF, Scahill RI, Rossor MN, Fox NC. Atrophy rates of the cingulate gyrus and hippocampus in AD and FTLD. Neurobiol Aging. 2007 Jan;28(1):20–28. doi: 10.1016/j.neurobiolaging.2005.11.012. [DOI] [PubMed] [Google Scholar]
- Bian H, Swieten JCV, Leight S, Massimo L, Wood E, Forman M, Moore P, de Koning I, Clark CM, Rosso S, Trojanowski J, Lee VMY, Grossman M. CSF biomarkers in frontotemporal lobar degeneration with known pathology. Neurology. 2008 May;70(19 Pt 2):1827–1835. doi: 10.1212/01.wnl.0000311445.21321.fc. [DOI] [PMC free article] [PubMed] [Google Scholar]
- Blair M, Marczinski CA, Davis-Faroque N, Kertesz A. A longitudinal study of language decline in Alzheimers disease and frontotemporal dementia. J Int Neuropsychol Soc. 2007;13:237–245. doi: 10.1017/S1355617707070269. [DOI] [PubMed] [Google Scholar]
- Bocti C, Rockel C, Roy P, Gao F, Black SE. Topographical patterns of lobar atrophy in frontotemporal dementia and Alzheimer's disease. Dement Geriatr Cogn Disord. 2006;21(5-6):364–372. doi: 10.1159/000091838. [DOI] [PubMed] [Google Scholar]
- Bonte FJ, Harris TS, Roney CA, Hynan LS. Differential diagnosis between Alzheimer's and frontotemporal disease by the posterior cingulate sign. J Nucl Med. 2004;45(5):771–774. [PubMed] [Google Scholar]
- Borga M. Canonical correlation: a tutorial. 2001 http://people.imt.liu.se/magnus/cca.
- Borroni B, Brambati SM, Agosti C, Gipponi S, Bellelli G, Gasparotti R, Garibotto V, Luca MD, Scifo P, Perani D, Padovani A. Evidence of white matter changes on diffusion tensor imaging in frontotemporal dementia. Arch Neurol. 2007 Feb;64(2):246–251. doi: 10.1001/archneur.64.2.246. [DOI] [PubMed] [Google Scholar]
- Brambati SM, Renda NC, Rankin KP, Rosen HJ, Seeley WW, Ashburner J, Weiner MW, Miller BL, Gorno-Tempini ML. A tensor based morphometry study of longitudinal gray matter contraction in FTD. Neuroimage. 2007;35(3):998–1003. doi: 10.1016/j.neuroimage.2007.01.028. [DOI] [PMC free article] [PubMed] [Google Scholar]
- Bruguier A, Preuschoff K, Quartz S, Bossaerts P. Investigating signal integration with canonical correlation analysis of fMRI brain activation data. Neuroimage. 2008 May;41(1):35–44. doi: 10.1016/j.neuroimage.2008.01.062. [DOI] [PubMed] [Google Scholar]
- Buchhave P, Blennow K, Zetterberg H, Stomrud E, Londos E, Andreasen N, Minthon L, Hansson O. Longitudinal study of CSF biomarkers in patients with Alzheimer's disease. PLoS One. 2009;4(7):e6294. doi: 10.1371/journal.pone.0006294. [DOI] [PMC free article] [PubMed] [Google Scholar]
- Cairns N, Lee V, Trojanowski JQ. Ch. Frontotemporal dementia. Guilford; 2006. The human frontal lobes: Functions and Disorders; pp. 408–421. [Google Scholar]
- Cao KAL, Martin PGP, Robert-Grani C, Besse P. Sparse canonical methods for biological data integration: application to a cross-platform study. BMC Bioinformatics. 2009;10:34. doi: 10.1186/1471-2105-10-34. [DOI] [PMC free article] [PubMed] [Google Scholar]
- Carcaillon L, Amieva H, Auriacombe S, Helmer C, Dartigues JF. A subtest of the MMSE as a valid test of episodic memory? Comparison with the free and cued reminding test. Dement Geriatr Cogn Disord. 2009;27(5):429–438. doi: 10.1159/000214632. [DOI] [PubMed] [Google Scholar]
- Chan D, Fox NC, Scahill RI. Patterns of temporal lobe atrophy in semantic dementia and Alzheimer's disease. Ann Neurol. 2001;49:433–442. [PubMed] [Google Scholar]
- Chen K, Reiman EM, Huan Z, Caselli RJ, Bandy D, Ayutyanont N, Alexander GE. Linking functional and structural brain images with multivariate network analyses: a novel application of the partial least square method. Neuroimage. 2009a Aug;47(2):602–610. doi: 10.1016/j.neuroimage.2009.04.053. [DOI] [PMC free article] [PubMed] [Google Scholar]
- Chen TF, Lin CC, Chen YF, Liu HM, Hua MS, Huang YC, Chiu MJ. Diffusion tensor changes in patients with amnesic mild cognitive impairment and various dementias. Psychiatry Res. 2009b Jul;173(1):15–21. doi: 10.1016/j.pscychresns.2008.09.002. [DOI] [PubMed] [Google Scholar]
- Cook PA, Bai Y, Nedjati-Gilani S, Seunarine KK, Hall MG, Parker GJM, Alexander DC. Camino: Open-source diffusion-MRI reconstruction and processing. International Society for Magnetic Resonance in Medicine 14th Scientific Meeting; Berkeley. 2006. p. 2759. [Google Scholar]
- Das SR, Avants BB, Grossman M, Gee JC. Registration based cortical thickness measurement. Neuroimage. 2009 Apr;45(3):867–879. doi: 10.1016/j.neuroimage.2008.12.016. [DOI] [PMC free article] [PubMed] [Google Scholar]
- Du AT, Schuff N, Kramer JH, Rosen HJ, Gorno-Tempini ML, Rankin K, Miller BL, Weiner MW. Different regional patterns of cortical thinning in Alzheimer's disease and frontotemporal dementia. Brain. 2007 Apr;130(Pt 4):1159–1166. doi: 10.1093/brain/awm016. [DOI] [PMC free article] [PubMed] [Google Scholar]
- Forman MS, Farmer J, Johnson JK, Clark CM, Arnold SE, Coslett HB, Chatterjee A, Hurtig HI, Karlawish JH, Rosen HJ, Deerlin VV, Lee VMY, Miller BL, Trojanowski JQ, Grossman M. Frontotemporal dementia: clinicopathological correlations. Ann Neurol. 2006 Jun;59(6):952–962. doi: 10.1002/ana.20873. [DOI] [PMC free article] [PubMed] [Google Scholar]
- Forman MS, Zhukareva V, Bergeron C, Chin SSM, Grossman M, Clark C, Lee VMY, Trojanowski JQ. Signature tau neuropathology in gray and white matter of corticobasal degeneration. Am J Pathol. 2002 Jun;160(6):2045–2053. doi: 10.1016/S0002-9440(10)61154-6. [DOI] [PMC free article] [PubMed] [Google Scholar]
- Frisoni GB, Testa C, Zorzan A, Beltramello FSA, Soininen H, Laakso M. Detection of grey matter loss in mild Alzheimer's disease with voxel-based morphometry. Journal of Neurology, Neurosurgery and Psychiatry. 2002;73:657–664. doi: 10.1136/jnnp.73.6.657. [DOI] [PMC free article] [PubMed] [Google Scholar]
- Galton CJ, Patterson K, Graham KS, Ralph MAL, Williams G, Antoun N, Sahakian BJ, Hodges JR. Differing patterns of temporal atrophy in Alzheimer's disease and semantic dementia. Neurology. 2001;57:216–225. doi: 10.1212/wnl.57.2.216. [DOI] [PubMed] [Google Scholar]
- Giovagnoli AR, Erbetta A, Reati F, Bugiani O. Differential neuropsychological patterns of frontal variant frontotemporal dementia and Alzheimer's disease in a study of diagnostic concordance. Neuropsychologia. 2008 Apr;46(5):1495–1504. doi: 10.1016/j.neuropsychologia.2007.12.023. [DOI] [PubMed] [Google Scholar]
- Gregory CA, Serra-Mestres J, Hodges JR. Early diagnosis of the frontal variant of frontotemporal dementia: how sensitive are standard neuroimaging and neuropsychologic tests? Neuropsychiatry Neuropsychol Behav Neurol. 1999 Apr;12(2):128–135. [PubMed] [Google Scholar]
- Grossman M. Ch. Imaging in frontotemporal dementia. Guilford; 2006. The human frontal lobes: Functions and Disorders; pp. 408–421. [Google Scholar]
- Grossman M, Libon DJ, Forman MS, Massimo L, Wood E, Moore P, Anderson C, Farmer J, Chatterjee A, Clark CM, Coslett HB, Hurtig HI, Lee VMY, Trojanowski JQ. Distinct antemortem profiles in patients with pathologically defined frontotemporal dementia. Arch Neurol. 2007a Nov;64(11):1601–1609. doi: 10.1001/archneur.64.11.1601. [DOI] [PubMed] [Google Scholar]
- Grossman M, McMillan C, Moore P, Ding L, Glosser G, Work M, Gee J. What's in a name: voxel-based morphometric analyses of MRI and naming difficulty in Alzheimer's disease, frontotemporal dementia and corticobasal degeneration. Brain. 2004 Mar;127(Pt 3):628–649. doi: 10.1093/brain/awh075. [DOI] [PubMed] [Google Scholar]
- Grossman M, Wood EM, Moore P, Neumann M, Kwong L, Forman MS, Clark CM, McCluskey LF, Miller BL, Lee VMY, Trojanowski JQ. TDP-43 pathologic lesions and clinical phenotype in frontotemporal lobar degeneration with ubiquitin-positive inclusions. Arch Neurol. 2007b Oct;64(10):1449–1454. doi: 10.1001/archneur.64.10.1449. [DOI] [PubMed] [Google Scholar]
- Grossman M, Xie SX, Libon DJ, Wang X, Massimo L, Moore P, Vesely L, Berkowitz R, Chatterjee A, Coslett HB, Hurtig HI, Forman MS, Lee VMY, Trojanowski JQ. Longitudinal decline in autopsy-defined frontotemporal lobar degeneration. Neurology. 2008 May;70(22):2036–2045. doi: 10.1212/01.wnl.0000303816.25065.bc. [DOI] [PMC free article] [PubMed] [Google Scholar]
- Hardoon DR, Szedmak S, Shawe-Taylor J. Canonical correlation analysis: An overview with application to learning methods. Neural Computation. 2004;16:2639–2664. doi: 10.1162/0899766042321814. [DOI] [PubMed] [Google Scholar]
- Hill RD, Baeckman L. The relationship between the mini-mental state examination and cognitive functioning in normal elderly adults: a componential analysis. Age Ageing. 1995 Sep;24(5):440–446. doi: 10.1093/ageing/24.5.440. [DOI] [PubMed] [Google Scholar]
- Hodges JR, Davies R, Xuereb J, Kril J, Halliday G. Survival in frontotemporal dementia. Neurology. 2003 Aug;61(3):349–354. doi: 10.1212/01.wnl.0000078928.20107.52. [DOI] [PubMed] [Google Scholar]
- Hodges JR, Patterson K, Ward R, Garrard P, Bak T, Perry R, Gregory CA. The differentiation of semantic dementia and frontal lobe dementia (temporal and frontal variants of frontotemporal dementia) from early Alzheimer's disease: A comparative neuropsychological study. Neuropsychology. 1999;13:31–40. doi: 10.1037//0894-4105.13.1.31. [DOI] [PubMed] [Google Scholar]
- Hotelling H. Relations between two sets of variants. Biometrika; 1936. pp. 321–377. [Google Scholar]
- Huey ED, Goveia EN, Paviol S, Pardini M, Krueger F, Zamboni G, Tierney MC, Wassermann EM, Grafman J. Executive dysfunction in frontotemporal dementia and corticobasal syndrome. Neurology. 2009 Feb;72(5):453–459. doi: 10.1212/01.wnl.0000341781.39164.26. [DOI] [PMC free article] [PubMed] [Google Scholar]
- Ibrahim I, Horacek J, Bartos A, Hajek M, Ripova D, Brunovsky M, Tintera J. Combination of voxel based morphometry and diffusion tensor imaging in patients with Alzheimer's disease. Neuro Endocrinol Lett. 2009 Mar;30(1):39–45. [PubMed] [Google Scholar]
- Jack CR, Petersen RC, O'Brien PC, Tangalos EG. MR-based hippocampal volumetry in the diagnosis of Alzheimer's disease. Neurology. 1992;42:183–188. doi: 10.1212/wnl.42.1.183. [DOI] [PubMed] [Google Scholar]
- Jagust W, Gitcho A, Sun F, Kuczynski B, Mungas D, Haan M. Brain imaging evidence of preclinical Alzheimer's disease in normal aging. Ann Neurol. 2006 Apr;59(4):673–681. doi: 10.1002/ana.20799. [DOI] [PubMed] [Google Scholar]
- Josephs KA, Duffy JR, Strand EA, Whitwell JL, Layton KF, Parisi JE, Hauser MF, Witte JR, Boeve BF, Knopman DS, Dickson DW, Jack CR, Petersen RC. Clinicopathological and imaging correlates of progressive aphasia and apraxia of speech. Brain. 2006a;129:1385–1398. doi: 10.1093/brain/awl078. [DOI] [PMC free article] [PubMed] [Google Scholar]
- Josephs KA, Petersen RC, Knopman DS, Boeve BF, Whitwell JL, Duffy JR, Parisi JE, Dickson DW. Clinicopathologic analysis of frontotemporal and corticobasal degenerations and PSP. Neurology. 2006b Jan;66(1):41–48. doi: 10.1212/01.wnl.0000191307.69661.c3. [DOI] [PubMed] [Google Scholar]
- Klein A, Andersson J, Ardekani BA, Ashburner J, Avants B, Chiang MC, Christensen GE, Collins DL, Gee J, Hellier P, Song JH, Jenkinson M, Lepage C, Rueckert D, Thompson P, Vercauteren T, Woods RP, Mann JJ, Parsey RV. Evaluation of 14 nonlinear deformation algorithms applied to human brain MRI registration. Neuroimage. 2009 Jul;46(3):786–802. doi: 10.1016/j.neuroimage.2008.12.037. [DOI] [PMC free article] [PubMed] [Google Scholar]
- Kloeppel S, Draganski B, Golding CV, Chu C, Nagy Z, Cook PA, Hicks SL, Kennard C, Alexander DC, Parker GJM, Tabrizi SJ, Frackowiak RSJ. White matter connections reflect changes in voluntary-guided saccades in pre-symptomatic Huntington's disease. Brain. 2008 Jan;131(Pt 1):196–204. doi: 10.1093/brain/awm275. [DOI] [PubMed] [Google Scholar]
- Knopman DS, Petersen RC, Edland SD, Cha RH, Rocca WA. The incidence of frontotemporal lobar degeneration in Rochester, Minnesota, 1990 through 1994. Neurology. 2004 Feb;62(3):506–508. doi: 10.1212/01.wnl.0000106827.39764.7e. [DOI] [PubMed] [Google Scholar]
- Kochunov P, Thompson PM, Lancaster JL, Bartzokis G, Smith S, Coyle T, Royall DR, Laird A, Fox PT. Relationship between white matter fractional anisotropy and other indices of cerebral health in normal aging: tract-based spatial statistics study of aging. Neuroimage. 2007 Apr;35(2):478–487. doi: 10.1016/j.neuroimage.2006.12.021. [DOI] [PubMed] [Google Scholar]
- Kriegeskorte N, Simmons WK, Bellgowan PSF, Baker CI. Circular analysis in systems neuroscience: the dangers of double dipping. Nat Neurosci. 2009 May;12(5):535–540. doi: 10.1038/nn.2303. [DOI] [PMC free article] [PubMed] [Google Scholar]
- Krueger CE, Dean DL, Rosen HJ, Halabi C, Weiner M, Miller BL, Kramer JH. Longitudinal rates of lobar atrophy in frontotemporal dementia, semantic dementia, and Alzheimer's disease. Alzheimer Dis Assoc Disord. 2009 Jun; doi: 10.1097/WAD.0b013e3181a6f101. [DOI] [PMC free article] [PubMed] [Google Scholar]
- Laakso M, Frisoni GB, Kononen M, Mikkonen M, Beltramello A, Geroldi C, Bianchetti A, Trabucchi M, Soininen H, Aronen HJ. Hippocampal and entorhinal cortex in frontotemporal dementia and Alzheimer's disease: A morphometric MRI study. Biological Psychiatry. 2000;47:1056–1063. doi: 10.1016/s0006-3223(99)00306-6. [DOI] [PubMed] [Google Scholar]
- Larsson EM, Englund E, Sjbeck M, Ltt J, Brockstedt S. MRI with diffusion tensor imaging post-mortem at 3.0 T in a patient with frontotemporal dementia. Dement Geriatr Cogn Disord. 2004;17(4):316–319. doi: 10.1159/000077162. [DOI] [PubMed] [Google Scholar]
- Lee VM, Goedert M, Trojanowski JQ. Neurodegenerative tauopathies. Annu Rev Neurosci. 2001;24:1121–1159. doi: 10.1146/annurev.neuro.24.1.1121. [DOI] [PubMed] [Google Scholar]
- Libon DJ, Massimo L, Moore P, Coslett HB, Chatterjee A, Aguirre GK, Rice A, Vesely L, Grossman M. Screening for frontotemporal dementias and Alzheimer's disease with the Philadelphia Brief Assessment of Cognition: a preliminary analysis. Dement Geriatr Cogn Disord. 2007a;24(6):441–447. doi: 10.1159/000110577. [DOI] [PubMed] [Google Scholar]
- Libon DJ, McMillan C, Gunawardena D, Powers C, Massimo L, Khan A, Morgan B, Farag C, Richmond L, Weinstein J, Moore P, Coslett HB, Chatterjee A, Aguirre G, Grossman M. Neurocognitive contributions to verbal fluency deficits in frontotemporal lobar degeneration. Neurology. 2009a Aug;73(7):535–542. doi: 10.1212/WNL.0b013e3181b2a4f5. [DOI] [PMC free article] [PubMed] [Google Scholar]
- Libon DJ, Xie SX, Moore P, Farmer J, Antani S, McCawley G, Cross K, Grossman M. Patterns of neuropsychological impairment in frontotemporal dementia. Neurology. 2007b;78:369–375. doi: 10.1212/01.wnl.0000252820.81313.9b. [DOI] [PubMed] [Google Scholar]
- Libon DJ, Xie SX, Wang X, Massimo L, Moore P, Vesely L, Khan A, Chatterjee A, Coslett HB, Hurtig HI, Liang TW, Grossman M. Neuropsychological decline in frontotemporal lobar degeneration: a longitudinal analysis. Neuropsychology. 2009b May;23(3):337–346. doi: 10.1037/a0014995. [DOI] [PMC free article] [PubMed] [Google Scholar]
- McKhann G, Drachman D, Folstein M, Katzman R, Price D, Stadian EM. Clinical diagnosis of Alzheimer's disease: Report on the NINCDS-ADRDA work group under the auspices of the Department of Health and Human Services Task Force on Alzheimer's disease. Neurology. 1984;34:939–944. doi: 10.1212/wnl.34.7.939. [DOI] [PubMed] [Google Scholar]
- McKhann G, Trojanowski JQ, Grossman M, Miller BL, Dickson D, Albert M. Clinical and pathological diagnosis of frontotemporal dementia: Report of a work group on frontotemporal dementia and Pick's disease. Arch Neurol. 2001;58:1803–1809. doi: 10.1001/archneur.58.11.1803. [DOI] [PubMed] [Google Scholar]
- Moon WJ, Kim HJ, Roh HG, Han SH. Atrophy measurement of the anterior commissure and substantia innominata with 3T high-resolution MR imaging: does the measurement differ for patients with frontotemporal lobar degeneration and Alzheimer disease and for healthy subjects? AJNR Am J Neuroradiol. 2008 Aug;29(7):1308–1313. doi: 10.3174/ajnr.A1103. [DOI] [PMC free article] [PubMed] [Google Scholar]
- Neary D, Snowden J. Fronto-temporal dementia: nosology, neuropsychology, and neuropathology. Brain Cogn. 1996 Jul;31(2):176–187. doi: 10.1006/brcg.1996.0041. [DOI] [PubMed] [Google Scholar]
- Neary D, Snowden JS, Gustafson L, Passant U, Stuss D, Black S, Freedman M, Kertesz A, Robert PH, Albert M, Boone K, Miller BL, Cummings J, Benson DF. Frontotemporal lobar degeneration: a consensus on clinical diagnostic criteria. Neurology. 1998 Dec;51(6):1546–1554. doi: 10.1212/wnl.51.6.1546. [DOI] [PubMed] [Google Scholar]
- Neumann M, Sampathu DM, Kwong LK, Truax AC, Micsenyi MC, Chou TT, Bruce J, Schuck T, Grossman M, Clark CM, McCluskey LF, Miller BL, Masliah E, Mackenzie IR, Feldman H, Feiden W, Kretzschmar HA, Trojanowski JQ, Lee VMY. Ubiquitinated TDP-43 in frontotemporal lobar degeneration and amyotrophic lateral sclerosis. Science. 2006 Oct;314(5796):130–133. doi: 10.1126/science.1134108. [DOI] [PubMed] [Google Scholar]
- Parkhomenko E, Tritchler D, Beyene J. Sparse canonical correlation analysis with application to genomic data integration. Stat Appl Genet Mol Biol. 2009 Jan;8(1) doi: 10.2202/1544-6115.1406. Article 1. [DOI] [PubMed] [Google Scholar]
- Rabinovici GD, Seeley WW, Kim EJ, Gorno-Tempini ML, Rascovsky K, Pagliaro TA, Allison SC, Halabi C, Kramer JH, Johnson JK, Weiner MW, Forman MS, Trojanowski JQ, Dearmond SJ, Miller BL, Rosen HJ. Distinct MRI atrophy patterns in autopsy-proven Alzheimer's disease and frontotemporal lobar degeneration. Am J Alzheimers Dis Other Demen. 2007;22(6):474–488. doi: 10.1177/1533317507308779. [DOI] [PMC free article] [PubMed] [Google Scholar]
- Ragnehed M, Engstrm M, Knutsson H, Sderfeldt B, Lundberg P. Restricted canonical correlation analysis in functional MRI-validation and a novel thresholding technique. J Magn Reson Imaging. 2009 Jan;29(1):146–154. doi: 10.1002/jmri.21494. [DOI] [PubMed] [Google Scholar]
- Rao A, Aljabar P, Rueckert D. Hierarchical statistical shape analysis and prediction of sub-cortical brain structures. Med Image Anal. 2008 Feb;12(1):55–68. doi: 10.1016/j.media.2007.06.006. [DOI] [PubMed] [Google Scholar]
- Richards BA, Chertkow H, Singh V, Robillard A, Massoud F, Evans AC, Kabani NJ. Patterns of cortical thinning in Alzheimer's disease and frontotemporal dementia. Neurobiol Aging. 2009 Oct;30(10):1626–1636. doi: 10.1016/j.neurobiolaging.2007.12.019. [DOI] [PubMed] [Google Scholar]
- Rosso SM, Kaatand LD, Baksand T, Joosseand M, de Koningand L, Pijnenburgand Y, de Jongand D, Dooijesand D, Kamphorstand W, Ravidand R, Niermeijerand MF, Verheijand F, Kre-merand HP, Scheltensand P, van Duijnand CM, van Heutinkand P, Swietenand JC. Frontotemporal dementia in the netherlands: patient characteristics and prevalence estimates from a population-based study. Brain. 2003;126:2016–2022. doi: 10.1093/brain/awg204. [DOI] [PubMed] [Google Scholar]
- Sabbagh MN, Cooper K, Delange DOJ, Stoehr JD, Thind K, Lahti RT, Reisberg B, Sue L, Vedders L, Fleming SR, Thomas P, Beach G. Functional, global and cognitive decline correlates to accumulation of Alzheimer's pathology in MCI and AD. Curr Alzheimer Res. 2009 Dec; doi: 10.2174/156720510791162340. [DOI] [PMC free article] [PubMed] [Google Scholar]
- Salvador R, Peña A, Menon DK, Carpenter TA, Pickard JD, Bullmore ET. Formal characterization and extension of the linearized diffusion tensor model. Human Brain Mapping. 2005;24:144–155. doi: 10.1002/hbm.20076. [DOI] [PMC free article] [PubMed] [Google Scholar]
- Seeley WW, Crawford RK, Zhou J, Miller BL, Greicius MD. Neurodegenerative diseases target large-scale human brain networks. Neuron. 2009 Apr;62(1):42–52. doi: 10.1016/j.neuron.2009.03.024. [DOI] [PMC free article] [PubMed] [Google Scholar]
- Sled JG, Zijdenbos AP, Evans AC. A nonparametric method for automatic correction of intensity nonuniformity in MRI data. IEEE Trans Med Imaging. 1998 Feb;17(1):87–97. doi: 10.1109/42.668698. [DOI] [PubMed] [Google Scholar]
- Small BJ, Viitanen M, Bckman L. Mini-mental state examination item scores as predictors of Alzheimer's disease: Incidence data from the Kungsholmen Project, Stockholm. J Gerontol A Biol Sci Med Sci. 1997 Sep;52(5):M299–M304. doi: 10.1093/gerona/52a.5.m299. [DOI] [PubMed] [Google Scholar]
- Studholme C, Cardenas V, Blumenfeld R, Schuff N, Rosen HJ, Miller B, Weiner M. Deformation tensor morphometry of semantic dementia with quantitative validation. Neuroimage. 2004;21(4):1387–1398. doi: 10.1016/j.neuroimage.2003.12.009. [DOI] [PubMed] [Google Scholar]
- Studholme C, Drapaca C, Iordanova B, Cardenas V. Deformation-based mapping of volume change from serial brain MRI in the presence of local tissue contrast change. IEEE Trans Med Imaging. 2006;25(5):626–639. doi: 10.1109/TMI.2006.872745. [DOI] [PubMed] [Google Scholar]
- Sun L, Ji S, Yu S, Ye J. On the equivalence between canonical correlation analysis and orthonormalized partial least squares. IJCAI. 2009:1230–1235. [Google Scholar]
- Sydykova D, Stahl R, Dietrich O, Ewers M, Reiser MF, Schoenberg SO, Mller HJ, Hampel H, Teipel SJ. Fiber connections between the cerebral cortex and the corpus callosum in Alzheimer's disease: a diffusion tensor imaging and voxel-based morphometry study. Cereb Cortex. 2007 Oct;17(10):2276–2282. doi: 10.1093/cercor/bhl136. [DOI] [PubMed] [Google Scholar]
- Thivard L, Pradat PF, Lehricy S, Lacomblez L, Dormont D, Chiras J, Benali H, Meininger V. Diffusion tensor imaging and voxel based morphometry study in amyotrophic lateral sclerosis: relationships with motor disability. J Neurol Neurosurg Psychiatry. 2007 Aug;78(8):889–892. doi: 10.1136/jnnp.2006.101758. [DOI] [PMC free article] [PubMed] [Google Scholar]
- Thompson PM, Hayashi KM, de Zubicaray G, Janke AL, Rose SE, Semple J, Herman D, Hong MS, Dittmer SS, Doddrell DM, Toga AW. Dynamics of gray matter loss in Alzheimer's disease. J Neurosci. 2003 Feb;23(3):994–1005. doi: 10.1523/JNEUROSCI.23-03-00994.2003. [DOI] [PMC free article] [PubMed] [Google Scholar]
- Torralva T, Roca M, Gleichgerrcht E, Bekinschtein T, Manes F. A neuropsychological battery to detect specific executive and social cognitive impairments in early frontotemporal dementia. Brain. 2009 May;132(Pt 5):1299–1309. doi: 10.1093/brain/awp041. [DOI] [PubMed] [Google Scholar]
- Tustison NJ, Gee JC. N4ITK: Nick's N3 ITK implementation for MRI bias field correction. Insight Journal 2009 [Google Scholar]
- Whitwell JL, Jack CR. Comparisons between Alzheimer disease, frontotemporal lobar degeneration, and normal aging with brain mapping. Top Magn Reson Imaging. 2005 Dec;16(6):409–425. doi: 10.1097/01.rmr.0000245457.98029.e1. [DOI] [PubMed] [Google Scholar]
- Whitwell JL, Jack CR, Pankratz VS, Parisi JE, Knopman DS, Boeve BF, Petersen RC, Dickson DW, Josephs KA. Rates of brain atrophy over time in autopsy-proven frontotemporal dementia and Alzheimer disease. Neuroimage. 2008a Feb;39(3):1034–1040. doi: 10.1016/j.neuroimage.2007.10.001. [DOI] [PMC free article] [PubMed] [Google Scholar]
- Whitwell JL, Josephs KA, Murray ME, Kantarci K, Przybelski SA, Weigand SD, Vemuri P, Senjem ML, Parisi JE, Knopman DS, Boeve BF, Petersen RC, Dickson DW, Jack CR. MRI correlates of neurofibrillary tangle pathology at autopsy: a voxel-based morphometry study. Neurology. 2008b Sep;71(10):743–749. doi: 10.1212/01.wnl.0000324924.91351.7d. [DOI] [PMC free article] [PubMed] [Google Scholar]
- Witten DM, Tibshirani R, Hastie T. A penalized matrix decomposition, with applications to sparse principal components and canonical correlation analysis. Biostatistics. 2009 Jul;10(3):515–534. doi: 10.1093/biostatistics/kxp008. [DOI] [PMC free article] [PubMed] [Google Scholar]
- Witten DM, Tibshirani RJ. Extensions of sparse canonical correlation analysis with applications to genomic data. Stat Appl Genet Mol Biol. 2009;8(1) doi: 10.2202/1544-6115.1470. Article28. [DOI] [PMC free article] [PubMed] [Google Scholar]
- Xie SX, Forman MS, Farmer J, Moore P, Wang Y, Wang X, Clark CM, Coslett HB, Chatterjee A, Arnold SE, Rosen H, Karlawish JHT, Deerlin VMV, Lee VMY, Trojanowski JQ, Grossman M. Factors associated with survival probability in autopsy-proven frontotemporal lobar degeneration. J Neurol Neurosurg Psychiatry. 2008 Feb;79(2):126–129. doi: 10.1136/jnnp.2006.110288. [DOI] [PubMed] [Google Scholar]
- Yoshiura T, Mihara F, Koga H, Noguchi T, Togao O, Ohyagi Y, Ogomori K, Ichimiya A, Kanba S, Honda H. Cerebral white matter degeneration in frontotemporal dementia detected by diffusion-weighted magnetic resonance imaging. Acad Radiol. 2006 Nov;13(11):1373–1378. doi: 10.1016/j.acra.2006.08.009. [DOI] [PubMed] [Google Scholar]
- Young K, Du AT, Kramer J, Rosen H, Miller B, Weiner M, Schuff N. Patterns of structural complexity in Alzheimer's disease and frontotemporal dementia. Hum Brain Mapp. 2009 May;30(5):1667–1677. doi: 10.1002/hbm.20632. [DOI] [PMC free article] [PubMed] [Google Scholar]
- Zhang H, Yushkevich PA, Alexander DC, Gee JC. Deformable registration of diffusion tensor MR images with explicit orientation optimization. Medical Image Analysis. 2006;10:764–785. doi: 10.1016/j.media.2006.06.004. [DOI] [PubMed] [Google Scholar]
- Zhang H, Yushkevich PA, Rueckert D, Gee JC. Unbiased white matter atlas construction using diffusion tensor images. In: Ayache N, Ourselin S, Maeder A, editors. Medical Image Computing and Computer-Assisted Intervention. Vol. 4792 of Lecture Notes in Computer Science. Springer-Verlag; Heidelberg: 2007. pp. 211–218. [DOI] [PubMed] [Google Scholar]
- Zhang Y, Brady M, Smith S. Segmentation of brain MR images through a hidden Markov random field model and the expectation-maximization algorithm. IEEE Trans Med Imaging. 2001 Jan;20(1):45–57. doi: 10.1109/42.906424. [DOI] [PubMed] [Google Scholar]
- Zhang Y, Schuff N, Du AT, Rosen HJ, Kramer JH, Gorno-Tempini ML, Miller BL, Weiner MW. White matter damage in frontotemporal dementia and Alzheimer's disease measured by diffusion MRI. Brain. 2009 Sep;132(Pt 9):2579–2592. doi: 10.1093/brain/awp071. [DOI] [PMC free article] [PubMed] [Google Scholar]