Abstract
Tissue profiling and imaging by MALDI mass spectrometry has allowed the direct analysis and localization of biomolecules in tissue. However, due to the in situ nature of this technique, the complexity of tissue, and the need for a chemical matrix in MALDI, the signal recorded can be extremely complex and difficult to assign. Combining ion mobility with matrix-assisted laser desorption/ionization is a very powerful technique for fast separation and analysis of biomolecules in complex mixtures (such as tissue and cells), as isobaric lipid, peptide, and oligonucleotide molecular ions are pre-separated in the mobility cell before mass analysis. Differences in drift time of as much as 30% are obtained in a timescale of hundreds of microseconds. Molecular ions of the same biochemical family fall along trend lines when plotted in 2D plots of mobility drift time as a function of m/z. In this chapter ion mobility MALDI-MS ability to analyze various biomolecules in tissue, that is, lipids and proteins, as well as its ability to separate species from all of the major phospholipid classes from tissue and extracts, the effects that radyl chain length, degree of unsaturation, head group composition have upon their ion’s cross section in the gas phase, and how it can be used not only to distinguish them from other biochemical groups in a mixture but also to differentiate them from other lipid species will be illustrated.
Keywords: MALDI, ion mobility, lipids, imaging, peptides, drugs, profiling
1. Introduction
The lipid membrane maintains a cell’s shape and its connection to other cells. It also allows certain molecules into and out of the cell, so it is selectively permeable. The membrane is a sea of lipids in which proteins and glycoproteins that govern the cell’s interactions are floating; thus it is the gate of the cell. The main lipid components of the cell’s membrane are phospholipids, cholesterol, and sphingolipids. The development of easy to use, highly accurate, and affordable mass spectrometers has made the study of lipids more accessible to many researchers and has led to the rapid growth of the field of lipidomics (1–6). Matrix-assisted laser desorption/ionization mass spectrometry (MALDI-MS) has become a valuable technique for imaging of biomolecules directly from tissue (see Chapters 1 and 2); although initially used for peptides and proteins, lipids have begun to be imaged recently.
The combining of MALDI-MS with ion mobility (IM) mass spectrometry has allowed for a wide range of samples to be analyzed by MALDI-IM MS (7, 8). In MALDI-IM MS, ions formed by the (MALDI) process enter the electric field of a gas-filled mobility drift cell region where they acquire an average drift velocity based on their collision cross section (Ω) to charge ratio, thus allowing the rapid separation of molecules according to their conformation (7–12). We have previously demonstrated that IM MS separates biomolecules along trend lines according to their composition, thus allowing the assignments of the ions’ chemical types based on their specific m/z and mobility drift time (12). Due to the rapid gas-phase separation of molecules in ion mobility, it offers unique advantages for mass spectrometry imaging of tissues and has led to some recent studies using MALDI-IM MS for imaging (13–15). Examples of the use of MALDI-IM MS will be discussed below.
2. Materials
2.1. Ion Mobility Mass Spectrometer Hardware and Software
MALDI-IM-TOFMS (Ionwerks, Inc., Houston, TX, USA).
X–Y sample stage (Model MM-3 M-F-2, National Aperture, Inc., Salem, NH, USA).
Nd:YLF UV laser (Crystalaser, Reno, NV, USA).
IDL software (Research Systems, Boulder, CO, USA).
2.2. Matrix and Standard Solutions
2,5-Dihydroxy benzoic acid, DHB (Fluka, Switzerland), prepared at 30 mg/ml in 50% ethanol for tissue profiling or at 100 mg/ml in 90% ethanol.
6-Aza-2-thiothymine, ATT (Sigma, St. Louis, MO, USA), prepared as a saturated solution in 50% ethanol.
Sinapic acid, SA (Fluka), prepared as a saturated solution in 50% ethanol.
2,6-Dihydroxyacetophenone, DHA (Fluka), prepared at 30 mg/ml in 50% ethanol (see Note 1).
2,4,6-Trihydroxyacetophenone, THA (Fluka), prepared as a saturated solution in 50% ethanol.
PSG gold colloid (2.0 nm, 2.6×10¹⁵ particles/ml) (nanoComposix, San Diego, CA, USA) diluted 1:4 v/v in ethanol.
Lipid standard tissue extracts (Avanti Polar Lipids, Alabaster, AL, USA): PCs from porcine brain, PIs from bovine liver, PSs from porcine brain, and SMs from porcine brain were prepared in chloroform:methanol (2:1 v/v) at a concentration of 10 nmol/μl. Further dilution was done directly in the matrix solutions.
Cocaine hydrochloride (Sigma) was prepared at 20 mg/kg free base in normal saline.
2.3. Tissue Harvesting, Sectioning, Preparation
Male Sprague–Dawley rats (Harlan Industries, Indianapolis, IN, USA).
Isoflurane (Baxter, Deerfield, IL, USA).
Isopentane (J T Baker, Phillipsburg, NJ, USA).
Cryostat (CM 3050 S; Leica Microsystems Nussloch GmbH, Nussloch, Germany).
Artistic airbrush14 (Aztek A470/80 Airbrush System; Testor Corporation, Rockford, IL, USA).
3. Methods
3.1. Ion Mobility Mass Spectrometry
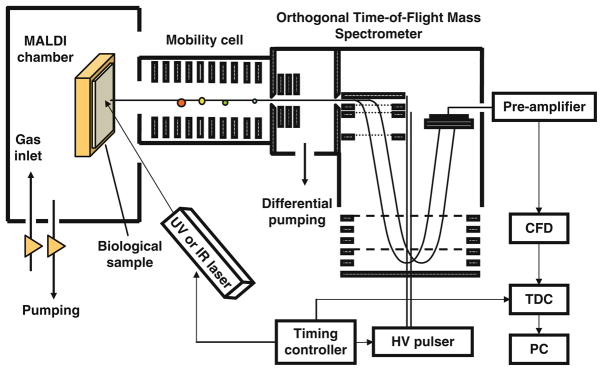
The ion mobility mass spectrometer used in this study is a periodic focusing MALDI-IM-TOFMS instrument with positive ion mode (see Note 2) and is illustrated in Fig. 5.1 A mobility resolution of 30 (FWHM of drift time) and a mass resolution of 3,000 for m/z 1,000 using an orthogonal time-of-flight mass spectrometer (o-TOFMS) are routinely achieved on calibration standards. Ions are drawn into the mobility cell by a voltage between the sample and the exit of the helium-filled IM cell so that the ion’s drift velocity is proportional to the density (surface area) of the ion. The length of the mobility cell is 15 cm. It is operated at 1,700 V with 3.5 torr helium pressure. An X–Y sample stage provides 1 μm accuracy in beam positioning and sample scanning. A Nd:YLF UV laser (λ = 349 nm at 200 Hz) is used to generate ions in the source at the operating pressure of the mobility cell.
Fig. 5.1.
Schematic diagram of MALDI-IM-TOFMS instrument.
Separation of ions with the same mass but different surface areas is thus possible. Small dense ions quickly traverse the IM cell and enter the mass spectrometer where a pulsed voltage applied to the orthogonal extraction region deflects the ion beam into a time-of-flight mass spectrometer equipped with a reflectron, which measures the ions’ m/z directly and their ion mobility elution time indirectly. This indirect determination of the IM time is accomplished by “tagging” each such o-TOF mass spectrum with the elapsed time since the firing of laser pulse onto the sample. Ion drift times are typically under 1 ms for m/z 5,000 yet the time of flight in the mass spectrometer is only a few tens of microseconds. Thus after each UV laser desorption pulse, several hundred mass spectra can be obtained from the eluted ions separated in the IM cell.
In this work, the data is presented as 2D contour plots of ion intensity as a function of ion mobility drift time (y-axis) and m/z (x-axis). In the 2D contour plots of ion mobility versus mass, compounds that have the same molecular weight but different structures are observed along ion groupings, which have different slopes. All contour plots were produced using IDL software. The images presented below were acquired with a 200 μm spatial resolution and a 3 s acquisition time per step. The laser spot size is less than 50 μm and the angle of incidence is 60° (tilt measured from the surface normal). Thus within the 3 s acquisition, a swath of 100 μm or less is cut across the pixel. A specific region of interest in both mass and mobility dimensions is preselected within the software. Offsets in both mass and mobility data acquisition parameters limit incoming data to a narrow mass range of approximately 100 Da and a mobility drift time range spanning 16 μs (at m/z 800). The region of interest mass bins and corresponding intensities are saved to a file along with the positional coordinates.
3.2. Tissue Sectioning and Preparation
Appropriate tissue preparation is important to maintaining the spatial resolution of the biomolecules of interest. In this study, male Sprague–Dawley rats between 300 and 420 g were euthanized with isoflurane (see Note 3). Brains were quickly removed from the skull and frozen in dry ice-chilled isopentane for 15 s at −30°C, prior to storage at −80°C. For cocaine experiments, rats received ip injection of cocaine hydrochloride (20 mg/kg free base in normal saline) and were euthanized with an overdose of isoflurane 15–25 min later. The brain collection procedure was identical as described above.
Next, frozen brain tissue was cut into thin sections, between 10 and 20 μm, in a cryostat. Typically, tissue samples are attached to the cryostat sample stages using optimal cutting temperature compound (OCT). However, care must be taken not to contaminate the tissue with OCT, because of previous studies (16) showing that OCT interference can reduce the quality of the mass spectra. This is especially important for lipids in which the m/z range of interest is under 1,000 (see Note 4). After cutting, tissue sections were collected directly onto MALDI sample targets. For profiling tissue experiments, 0.1–0.3 μl (according to the size of the anatomical region of interest) matrix solution was spotted onto the tissue section prior to insertion into the mass spectrometer.
The two matrices used to spray coat the tissue sections were DHB and 2.0 nm gold particles. The matrix solutions were sprayed on the tissue sections with an artistic airbrush14 (Aztek A470/80 Airbrush System, the Testors Corporation, Rockford, IL, USA). Each target insert was sprayed with 5–6 spray cycles. A 2 min wait between spray cycles was observed to ensure sufficient evaporation of organic solvents from the target insert surface. One spray cycle is defined as an organized rastering of spraying, which results in complete coverage of the target insert surface by the spraying mist. The distance between the nozzle of the air-brush and the target plate was kept between 15 and 20 cm. The matrix was perpendicularly sprayed onto the target plate.
3.3. Biomolecules Separation by Ion Mobility in Tissue Profiling Experiments
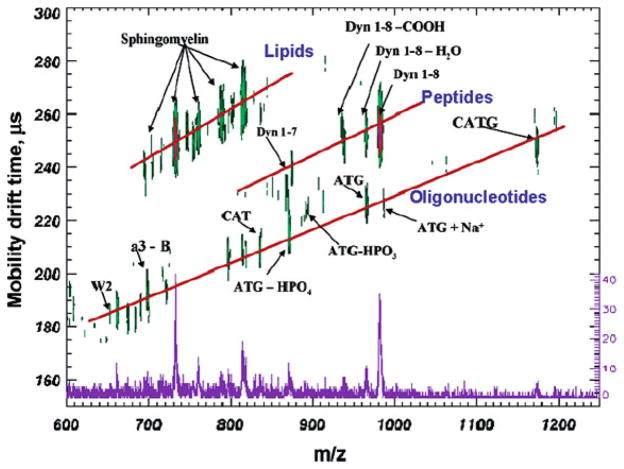
Coupling MALDI-MS with ion mobility results in the fast sorting of biomolecules along trend lines, which provides a powerful tool for the analysis of complex samples such as tissue. Figure 5.2 illustrates an MALDI-IM spectrum of a mixture containing sphin-gomyelins, dynorphin peptides, and the oligonucleotide, CATG, with ATT matrix in positive ion mode. As can be observed, each type of biomolecule falls along its own trend line. Overall, the differences in mobility drift times between isobaric ions from the three types of biomolecules tested (lipid, peptide, oligonucleotide) are approximately 15–20%. These results have been repeated for other standards and in tissue with the same pattern of mobility separation, in which the hydrophilic oligonucleotides have the fastest drift times, followed by peptides and proteins, and finally the hydrophobic lipids that usually have the slowest drift times (12, 13, 17).
Fig. 5.2.
MALDI-IM 2D plot of a mixture of lipids, peptides, and oligonucleotides with ATT matrix. Note the separation of the different types of biomolecules and their fragments along familial trend lines. Reproduced from (12) with permission from American Chemical Society.
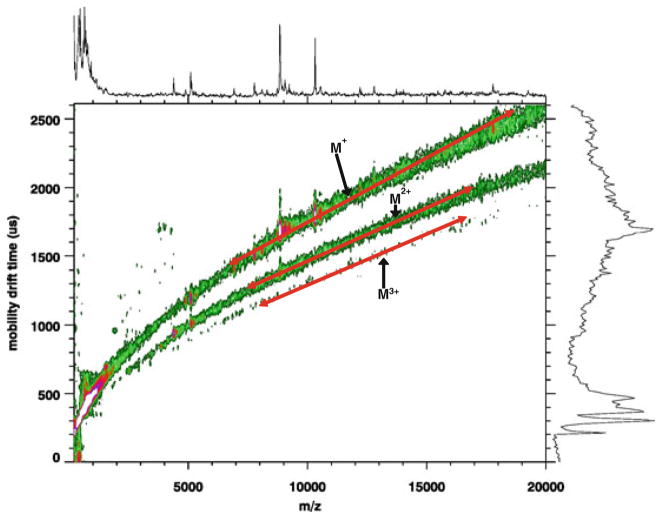
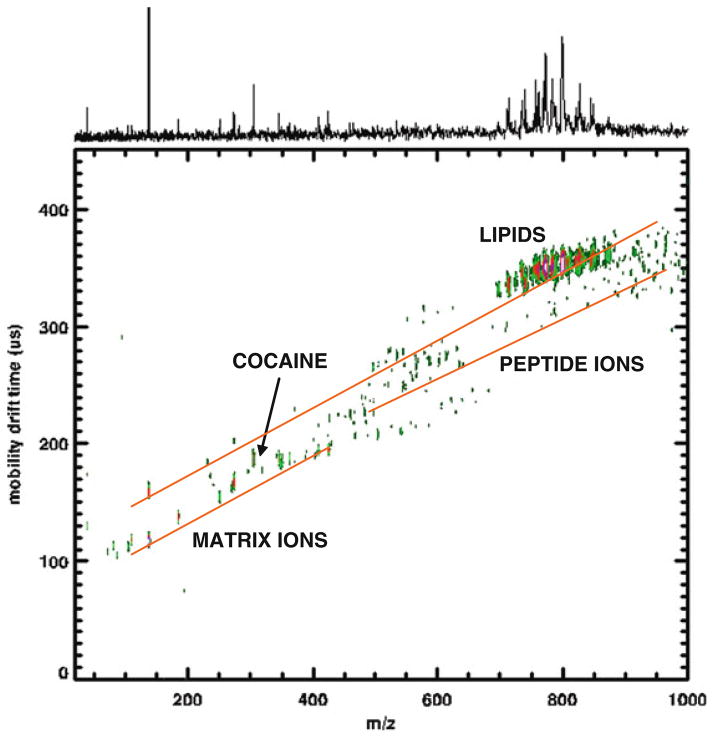
Figures 5.3 and 5.4 show two examples where mobility separation is valuable in direct tissue analysis. Figure 5.3 contains an MALDI-IM 2D plot of the cerebral caudate–putamen region in rat brain tissue with SA matrix in positive ion mode. Several mass peaks-associated peptides and proteins in the brain are recorded in the m/z range between 1,000 and 20,000. In this m/z range, three clear trend lines are observed corresponding to singly, doubly, and triply charged ions. Thus, using ion mobility MS we are able to resolve monomers and multimers of peptides and proteins, which make identification easier and allows for the imaging of pure singly charged protein ions. Figure 5.4 illustrates an MALDI-IM spectrum from the cerebrum of a cocaine-injected rat with DHB matrix. Clear mobility separation is observed between lipids and peptides but more importantly for this sample is the mobility separation of the cocaine molecular ion (M+H = 304.1) from the DHB matrix ions. Without this separation it would be quite difficult to differentiate the cocaine signal from matrix ions. Matrix interference is a major disadvantage for MALDI analysis of molecules below 500 Da.
Fig. 5.3.
MALDI-IM 2D plot of the cerebral caudate–putamen region in rat brain tissue with SA matrix. Note the separation of charge states for proteins and peptides along trend lines.
Fig. 5.4.
MALDI-IM 2D plot from the cerebrum of a cocaine-injected rat (20 mg of free base/kg), 20 min after ip injection with DHB matrix. Note the mobility separation of cocaine from matrix interference ions.
MALDI-IM MS is useful for the separation of major groups of biomolecules such as lipids, peptides, nucleic acids, but it is also capable of separating different classes of molecules within a group, for example, phospholipids. Phospholipids are present in abundance in all biological membranes and represent over half the lipid content of the brain (18). The general structural requirement for phospholipids is the presence of an alcohol, phosphate, and a fatty acid chain. Major classes of phospholipids include phosphatidylcholine (PC), phosphatidylinositols (PI), phosphatidylserine (PS), and sphingomyelin (SM). Figure 5.5a shows an overlay of MALDI-IM 2D plots of brain extracts of PCs (red), PSs (green), SMs (blue), and liver extracts of PIs (orange) with THA matrix in positive ion mode. The sample spot contained a 100 pmol from each phospholipid extract. As seen in Fig. 5.5a, different phospholipid classes occupy different drift time m/z space, which simplifies their assignment in complex mixtures. This result is due to changes on an ion’s cross section in the gas phase because of differences in head groups, acyl chains, and salt adducts among the different phospholipid classes. This phenomenon has been observed in detail previously (19). Figure 5.5b illustrates an MALDI-IM 2D plot from rat cerebral tissue with DHB matrix in positive ion mode. Several species of PC and SM were recorded as protonated, sodiated, and potassiated adducts. One clear observation from this figure is that SM species have a slightly higher drift time compared to PC species. PC and SM both contain a phosphocholine head group; however, the SM ceramide backbone differs slightly from the glycerol backbone of PC. This difference accounts for the difference in drift time and demonstrates the ability of ion mobility to separate very similar classes of molecules.
Fig. 5.5.
(a) Overlay of MALDI-IM 2D plots of brain extracts of PCs (red), PSs (green), SMs (blue), and liver extracts of PIs (orange) with THA matrix. Note the mobility separation of the different phospholipid classes based upon head groups, acyl chains, and alkali salt adducts. (b) MALDI-IM 2D plot from rat cerebral tissue with DHB matrix. Note the mobility separation of PC and SM species and between protonated and alkali adducts.
3.4. Imaging of Lipids by MALDI-IM-TOFMS
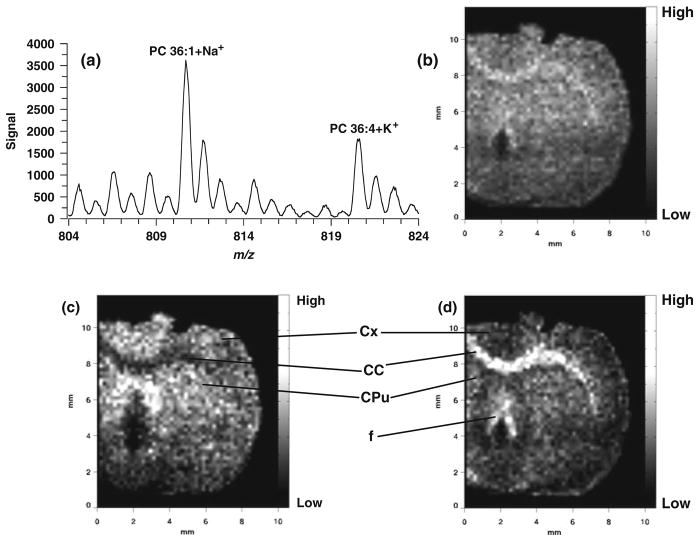
Since MALDI-IM MS separates different groups of biomolecules according to drift time and our imaging software has a drift time window of 16 μs, we are able to generate images from a single ion with no interference from other isobaric ions or corresponding dimers or multimers. Figure 5.6 shows the results of an MALDI-IM imaging run recorded with DHB matrix from rat cerebral tissue in positive ion mode. Figure 5.6a represents the total 1D mass spectrum used to generate the images in Fig. 5.6b–d. The image in Fig. 5.6b is produced using the total ion count for the 1D mass spectrum in Fig. 5.6a. Figure 5.6c shows the distribution of m/z 810.6 (PC 36:1+Na), while Fig. 5.6d illustrates the distribution of m/z 820.5 (PC 36:4+K). Anatomically distinct regions are detected in Fig. 5.6d with more signal recorded in white matter regions including the corpus callosum and fornix, while in Fig. 5.6c stronger signal is observed in the cerebral cortex and caudate–putamen, both gray matter regions.
Fig. 5.6.
MALDI-IM images using DHB matrix in positive ion mode. (a) 1D mass spectrum obtained from section. (b) Image of m/z range 804–824. (c) Image of mass peak at m/z 810.6 (PC 36:1+Na). (d) Image of mass peak at m/z 820.5 (PC 36:4+K). Images are 51 × 60 pixels. Abbreviations: Cx – cerebral cortex; CC – corpus callosum; CPu – caudate–putamen; f – fornix.
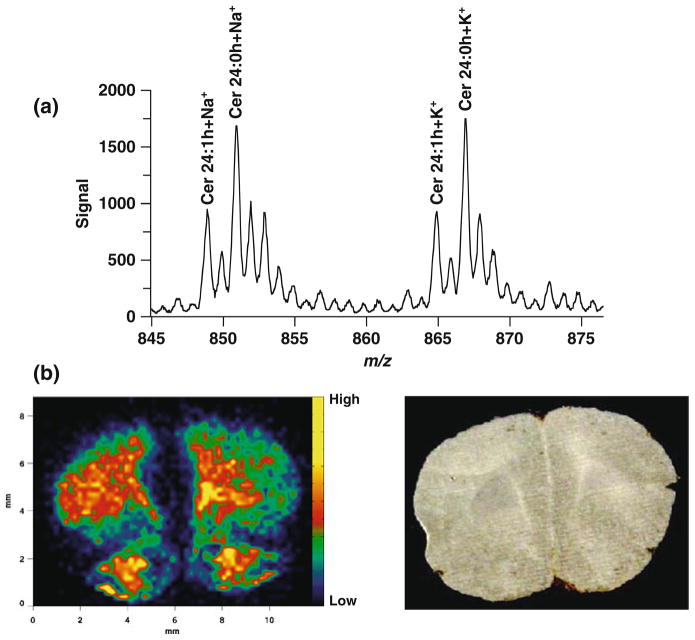
In order to demonstrate the importance of matrices in detecting different classes of lipids (see Note 5), Fig. 5.7 illustrates the results of an MALDI-IM MS image obtained using 2.0 nm gold nanoparticles as a matrix for a rat brain tissue section in positive ion mode. Previous studies have used implanted gold clusters (20, 21) and gold nanoparticles (13) to analyze cerebrosides in tissue; compared to traditional organic acid matrices, such as DHB, in which PC species are the dominant signals in this lipid mass range in positive ion mode. Figure 5.7a shows a 1D mass spectrum for the whole tissue section, in which strong signals corresponding to cerebroside 24:0 OH at m/z 850.7 and 866.8 and the sodiated and potassiated cerebroside 24:1 OH at m/z 848.7 and 864.8 were observed. Figure 5.7b shows the distribution of potassiated cerebroside 24:0 OH at m/z 866.8, which is highly concentrated in white matter regions in the brain.
Fig. 5.7.
MALDI-IM image using 2.0 nm Au particles in positive ion mode. (a) 1D mass spectrum recorded from the tissue section. (b) Image of potassiated cerebroside 24:0 OH at m/z 866.8. The image is a 45 × 60 pixel. The adjacent frame is a photograph of the rat brain section.
Acknowledgments
This research was supported by the Intramural Research Program of the National Institute on Drug Abuse, NIH. The authors thank the Office of National Drug Control Policy (ONDCP) for instrumentation funding, without which this and other projects could not have been accomplished and Dr. J Albert Schultz and Tom Egan (Ionwerks, Inc.) for assistance with the ion mobility mass spectrometer and the imaging computer software.
Footnotes
One note of caution is that DHA matrix sublimes under high vacuum pressure and may last only for 15–30 min according to the concentration and vacuum pressure of the ion source.
Although the current configuration of the MALDI-IM mass spectrometer used in this study has only positive ion mode, negative ion mode is the preferred mode for several lipid classes. In general for direct tissue analysis, PCs and SMs are easier to ionize in positive ion mode, while negative ion mode is preferred for the analysis of PEs, PSs, PIs, PGs, PAs, sulfatides, gangliosides, and cardiolipins.
All the animal work in this study abides by the Guide for the Care and Use of Laboratory Animals (NIH).
One alternative to OCT is to attach the tissue samples to the cryostat sample stages using ice slush made from distilled water (17). In this method, the ice slush only comes in contact with the tissue blocks at the surface opposing the sample stages and is frozen into a thin layer of ice within 5 s.
Proper matrix selection is one of the keys to a successful MALDI experiment and is especially important in direct tissue analysis due to the complex nature of the sample. For lipid analysis in tissue, we typically use DHA, DHB, and gold nanoparticles according to what class of lipids we are probing. In positive ion mode, both DHA and DHB work well for PCs and SMs, while gold nanoparticles are effective for targeting cerebrosides in tissue. In negative ion mode, all three work well for sulfatides, while DHA and DHB detect PIs, and DHA offers the ability to easily detect PSs, PEs, PGs, and gangliosides directly from tissue.
References
- 1.Holthuis JCM, Levine TP. Lipid traffic: floppy drives and a superhighway. Nat Rev Mol Cell Biol. 2005;6:209–220. doi: 10.1038/nrm1591. [DOI] [PubMed] [Google Scholar]
- 2.Waston AD. Lipidomics: a global approach to lipid analysis in biological systems. J Lipid Res. 2006;47:2101–2111. doi: 10.1194/jlr.R600022-JLR200. [DOI] [PubMed] [Google Scholar]
- 3.van Meer G. Cellular lipidomics. EMBO J. 2005;24:3159–3165. doi: 10.1038/sj.emboj.7600798. [DOI] [PMC free article] [PubMed] [Google Scholar]
- 4.Wenk MR. The emerging field of lipidomics. Nat Rev Drug Discov. 2005;7:594–610. doi: 10.1038/nrd1776. [DOI] [PubMed] [Google Scholar]
- 5.Piomelli D, Astarita G, Rapaka R. A neuroscientist’s guide to lipidomics. Nat Rev Neurosci. 2007;8:743–753. doi: 10.1038/nrn2233. [DOI] [PubMed] [Google Scholar]
- 6.Han X. Neurolipidomics: challenges and developments. Front Biosci. 2007;12:2601–2615. doi: 10.2741/2258. [DOI] [PMC free article] [PubMed] [Google Scholar]
- 7.Gillig KJ, Ruotolo B, Stone EG, Russell DH, Fuhrer K, Gonin M, Schultz JA. Coupling high-pressure MALDI with ion mobility/orthogonal time-of-flight mass spectrometry. Anal Chem. 2000;72:3965–3971. doi: 10.1021/ac0005619. [DOI] [PubMed] [Google Scholar]
- 8.von Helden G, Wyttenbach T, Bowers MT. Conformation of macromolecules in the gas phase: use of matrix-assisted laser desorption methods in ion chromatography. Science. 1995;267:1483–1485. doi: 10.1126/science.267.5203.1483. [DOI] [PubMed] [Google Scholar]
- 9.Baumbach JI, Eiceman GA. Ion mobility spectrometry: arriving on site and moving beyond a low profile. Appl Spectrosc. 1999;53:338A–355A. doi: 10.1366/0003702991947847. [DOI] [PubMed] [Google Scholar]
- 10.McDaniel EW, Mason EA. The Mobility and Diffusion of Ions in Gases. Wiley; New York, NY: 1973. pp. 68–72. [Google Scholar]
- 11.Collins DC, Lee ML. Developments in ion mobility spectrometry-mass spectrometry. Anal Bioanal Chem. 2002;372:66–73. doi: 10.1007/s00216-001-1195-5. [DOI] [PubMed] [Google Scholar]
- 12.Woods AS, Ugarov M, Egan T, Koomen J, Gillig KJ, Fuhrer K, Gonin M, Schultz JA. Lipid/peptide/nucleotide separation with MALDI-ion mobility-TOF MS. Anal Chem. 2004;76:2187–2195. doi: 10.1021/ac035376k. [DOI] [PubMed] [Google Scholar]
- 13.Jackson SN, Ugarov M, Egan T, Post JD, Langlais D, Schultz JA, Woods AS. MALDI-ion mobility-TOFMS imaging of lipids in rat brain tissue. J Mass Spectrom. 2007;42:1093–1098. doi: 10.1002/jms.1245. [DOI] [PMC free article] [PubMed] [Google Scholar]
- 14.McLean JA, Ridenour WB, Caprioli RM. Profiling and imaging of tissues by imaging ion mobility-mass spectrometry. J Mass Spectrom. 2007;42:1099–1105. doi: 10.1002/jms.1254. [DOI] [PubMed] [Google Scholar]
- 15.Trim PJ, Henson CM, Avery JL, McEwen A, Snel MF, Claude E, Marshall PS, West A, Princivalle AP, Clench MR. Matrix-assisted laser desorption/ionization-ion mobility separation-mass spectrometry imaging of vinblastine in whole body tissue sections. Anal Chem. 2008;80:8628–8634. doi: 10.1021/ac8015467. [DOI] [PubMed] [Google Scholar]
- 16.Schwartz SA, Reyzer ML, Caprioli RM. Direct tissue analysis using matrix-assisted laser desorption/ionization mass spectrometry: practical aspects of sample preparation. J Mass Spectrom. 2003;38:699–708. doi: 10.1002/jms.505. [DOI] [PubMed] [Google Scholar]
- 17.Jackson SN, Wang H-YJ, Woods AS, Ugarov M, Egan T, Schultz JA. Direct tissue analysis of phospholipids in rat brain using MALDI-TOFMS and MALDI-ion mobility-TOFMS. J Am Soc Mass Spectrom. 2005;16:133–138. doi: 10.1016/j.jasms.2004.10.002. [DOI] [PubMed] [Google Scholar]
- 18.Agranoff BW, Benjamins JA, Hajra AK. In: Basic Neurochemistry Molecular, Cellular and Medical Aspects. 6. Siegel GJ, et al., editors. Lippincott Williams & Wilkins; Philadelphia, PA: 1999. pp. 47–67. [Google Scholar]
- 19.Jackson SN, Ugarov M, Post JD, Egan T, Langlais D, Schultz JA, Woods AS. A study of phospholipids by ion mobility TOFMS. J Am Soc Mass Spectrom. 2008;19:1655–1662. doi: 10.1016/j.jasms.2008.07.005. [DOI] [PMC free article] [PubMed] [Google Scholar]
- 20.Novikov A, Caroff M, Della-Negra S, Lebeyec Y, Pautrat M, Schultz JA, Tempez A, Wang H-YJ, Jackson SN, Woods AS. Matrix-implanted laser desorption/ionization mass spectrometry. Anal Chem. 2004;76:7288–7293. doi: 10.1021/ac049123i. [DOI] [PubMed] [Google Scholar]
- 21.Tempez A, Ugarov M, Egan T, Schultz JA, Novikov A, Della-Negra S, Lebeyec Y, Pautrat M, Caroff M, Smentkowski VS, Wang H-YJ, Jackson SN, Woods AS. Matrix implanted laser desorption ionization (MILDI) combined with ion mobility-mass spectrometry for bio-surface analysis. J Proteome Res. 2005;4:540–545. doi: 10.1021/pr0497879. [DOI] [PubMed] [Google Scholar]


