

Abstract
Early experience affects the development of the visual system. Ocular misalignment or unilateral blur often causes amblyopia, a disorder that has become a standard for understanding developmental plasticity. Neurophysiological studies of amblyopia have focused almost entirely on the first stage of cortical processing in striate cortex. Here we provide the first extensive study of how amblyopia affects extrastriate cortex in nonhuman primates. We studied macaque monkeys (Macaca nemestrina) for which we have detailed psychophysical data, directly comparing physiological findings to perceptual capabilities. Because these subjects showed deficits in motion discrimination, we focused on area MT/V5, which plays a central role in motion processing. Most neurons in normal MT respond equally to visual stimuli presented through either eye; most recorded in amblyopes strongly preferred stimulation of the nonamblyopic (fellow) eye. The pooled responses of neurons driven by the amblyopic eye showed reduced sensitivity to coherent motion and preferred higher speeds, in agreement with behavioral measurements. MT neurons were more limited in their capacity to integrate motion information over time than expected from behavioral performance; neurons driven by the amblyopic eye had even shorter integration times than those driven by the fellow eye. We conclude that some, but not all, of the motion sensitivity deficits associated with amblyopia can be explained by abnormal development of MT.
Introduction
Amblyopia is a developmental visual disorder that manifests as a loss of acuity without an obvious organic cause. It is commonly associated with deficits in spatial vision, but behavioral studies in monkey and human amblyopes have also uncovered significant and independent impairments in visual motion processing (Ellemberg et al., 2002; Simmers et al., 2003, 2005, 2006; Constantinescu et al., 2005; Kiorpes et al., 2006). Monocular visual deprivation during early development causes dramatic changes in primary visual cortex (V1), where few neurons respond to stimulation of the deprived eye (Wiesel and Hubel, 1963; Hubel et al., 1977). Neurophysiological recordings in V1 of monkeys made amblyopic by more subtle forms of deprivation such as anisometropia and strabismus reveal reductions in binocularity, as well as poorer spatial resolution and contrast sensitivity in neurons driven by the amblyopic eye (Movshon et al., 1987; Kiorpes et al., 1998). These abnormalities do not explain the full range of perceptual deficits observed in amblyopic monkeys, particularly their deficits in motion perception, suggesting that changes in downstream cortical processing are also involved.
Many studies have shown a direct link between psychophysical performance on motion discrimination tasks and neuronal activity in MT (V5) (Newsome and Pare, 1988; Salzman et al., 1990; Britten et al., 1992). It is therefore reasonable to suppose that amblyopic deficits in motion processing might be reflected in the properties of MT neurons. Indeed, recent imaging studies have identified MT as one of several extrastriate visual areas that show reduced activation for amblyopic eye stimulation compared to fellow eye stimulation (Imamura et al., 1997; Bonhomme et al., 2006). We therefore conducted our physiological recordings in macaque area MT.
To learn how MT is affected by amblyopia, we studied amblyopic monkeys with known behavioral motion deficits (Kiorpes et al., 2006). Two monkeys became amblyopic after early anisometropic rearing, and two became amblyopic after early strabismus. When tested through the amblyopic eye, all animals showed reduced motion sensitivity at slow speeds and were unable to integrate motion signals over long temporal intervals. Importantly, these losses were independent of their deficits in spatial vision, suggesting that there might be more than one site of developmental abnormality.
To relate neuronal properties to behavior, we examined the responses of single units and population activity. Binocular interaction was reduced in MT neurons, and neurons driven by the amblyopic eye showed reduced sensitivity to coherent motion, higher preferred speeds, and shorter integration times than neurons driven by the fellow eye. We conclude that important components of motion deficit in amblyopic vision can be explained by abnormal development of extrastriate area MT. Quantitative analysis of the properties of MT cells suggests, however, that the amblyopic deficit in temporal integration is caused, in part, by neuronal changes downstream of MT.
Materials and Methods
Subjects
We recorded from neurons in visual area MT of four amblyopic pig-tailed macaque monkeys (Macaca nemestrina; three males, one female) whose behavioral motion sensitivity was tested previously (Kiorpes et al., 2006). Two monkeys were anisometropic amblyopes (HK and CY), and two were strabismic amblyopes (TX and HF). Anisometropic amblyopia developed after rearing with extended-wear soft contact lenses (−10D lens in one eye and a plano lens in the other, beginning at 3 weeks of age). Strabismic amblyopia developed after surgical misalignment of the visual axes, induced by transection of the lateral rectus muscle and resection of the medial rectus muscle of one eye, 3 weeks after birth. Our procedures for creating amblyopia experimentally have been detailed previously (Kiorpes et al., 1993). Amblyopic monkeys were ≥9 years at the time of recording. All animal care and experimental procedures were done in accordance with protocols approved by the New York University Animal Welfare Committee and conformed to the National Institutes of Health Guide for the Care and Use of Laboratory Animals.
Surgical preparation
We prepared animals for recording as described previously (Cavanaugh et al., 2002). Experiments typically lasted 5–6 d, during which anesthesia and paralysis were maintained with continuous intravenous infusion of sufentanil citrate (initially 6 μg/kg/h, adjusted to maintain a suitable level of anesthesia for each animal) and vecuronium bromide (Norcuron; 0.1 mg/kg/h) in dextrose–Normosol solution. Vital signs were monitored (EEG, heart rate, lung pressure, end-tidal pCO2, temperature, urine flow, and osmolarity) and maintained within appropriate physiological limits. Pupils were dilated with topical atropine, and the eyes were protected with oxygen-permeable contact lenses. Supplementary lenses chosen via direct ophthalmoscopy were used to make the retinas conjugate with the experimental display.
Unit recording
Extracellular recordings were made with quartz–platinum–tungsten microelectrodes (Thomas Recording) advanced mechanically through a craniotomy and durotomy centered 4–6 mm posterior to the lunate sulcus and 16–17 mm lateral to the midline. Electrode penetrations were confined to a parasaggital plane and directed downward at an angle of 20° from horizontal, passing through the lunate sulcus and entering the posterior/ventral bank of the superior temporal sulcus. We identified MT physiologically from the brisk direction-selective responses of isolated neurons. The receptive field centers of recorded neurons lay between 3 and 20° from the fovea, for the most part, in the inferior quadrant of visual space; their coverage included eccentricities from 0 to 25°. Signals from the microelectrodes were amplified, bandpass filtered (300 Hz to 10 kHz), and fed into a dual-window time-amplitude discriminator (Bak Electronics) for spike detection. Spike times were saved with a temporal resolution of 0.1 ms.
To rule out potential sampling bias, we attempted to isolate and record units every 200 μm of electrode travel. In a few cases in which this could not be achieved, we recorded multiunit activity. We also oversampled the hemisphere contralateral to the amblyopic eye to enrich our population of neurons driven by the amblyopic eye. In the contralateral and ipsilateral hemispheres, respectively, we recorded 40 and 16 neurons in HK, 46 and 25 neurons in CY, 45 and 24 neurons in TX, and 43 and 30 neurons in HF. Neurons recorded in the two hemispheres did not differ in their visual response properties.
Visual stimulation
We presented stimuli on a gamma-corrected cathode ray tube monitor (Eizo T966) at a resolution of 1280 × 960 pixels and a refresh rate of 120 Hz. Stimuli were generated using Expo software on an Apple Macintosh computer (http://corevision.cns.nyu.edu).
For each cell, we mapped the receptive field of each eye on a tangent screen. After determining ocular dominance, we presented stimuli monocularly to the cell's dominant eye, occluding the other. When possible, for MT cells that responded well in each eye, we recorded through both the fellow and amblyopic eyes on separate runs for direct comparison.
First, we used high-contrast sinusoidal gratings (mean luminance, 33 cd/m2) to measure selectivity for orientation and direction, spatial frequency, temporal frequency, and size. We compared direction selectivity for gratings and plaids constructed by adding two gratings whose orientations and directions differed by 120° to establish whether cells were component direction selective (CDS) or pattern direction selective (PDS) (Movshon et al., 1985). We then used coherent random dot stimuli to measure selectivity for dot direction, speed, and the temporal interval between successive dot presentations (temporal offset, Δt). Finally, we studied responses to motion in the preferred and antipreferred directions as a function of motion strength (coherence). Random dot displays had a density of 160 dots/deg2/s and a dot size of 0.29–0.45°. Dot luminance was 66 cd/m2, and background luminance was 13.2 cd/m2. All stimuli appeared within a circular aperture. Stimuli were presented in randomly interleaved blocks and included appropriate controls for background activity: zero contrast stimuli for gratings and 0% coherence stimuli for random dots.
Analysis
Response properties of single units
We captured the responsiveness and selectivity of MT neurons to gratings and random dots by fitting suitable descriptive functions to measured tuning curves. We compared the distributions of measures derived from these fits for neurons stimulated through either eye; cells tested separately through both eyes contributed to both populations. To evaluate the significance of differences between fellow and amblyopic eye distributions, we used permutation tests. For each comparison, we dissociated the data from their labels (fellow, amblyopic), drew two populations of the same size as the observed populations, and computed the difference between the values of an appropriately chosen measure of central tendency. We repeated this 100,000 times, generating a distribution of signed differences. From this, we determined the probability that the observed differences could have occurred by chance (see Table 1). We treated all comparisons as two-tailed and so adopted a criterion of p ≤ 0.025 for significance.
Table 1.
The probabilities that differences in the visual response properties of single units recorded in MT of amblyopic subjects could have arisen by chance
| SUA response property | Measure | Anisometropes (FE vs AE) | Strabismics (FE vs AE) |
|---|---|---|---|
| Peak response | Geometric | 0.227 | 0.130 |
| Direction index (dots) | Geometric | 0.008 | 0.290 |
| Direction index (gratings) | Geometric | 0.035 | 0.137 |
| Pattern index | Arithmetic | 0.155 | 0.280 |
| Coherence threshold | Median | 0.023 | 0.407 |
| Preferred speed | Geometric | 0.230 | 0.004 |
| Preferred spatial frequency | Geometric | 0.171 | 0.095 |
| Preferred temporal frequency | Geometric | 0.197 | 0.410 |
We show pairwise comparisons for responses of neurons from amblyopes tested through the fellow eyes (FE) and the amblyopic eyes (AE). The reported values were deemed significant and are listed in bold for p ≤ 0.025.
Quantitative measures of response
Direction tuning index.
We quantified selectivity for motion direction of gratings and random dots with a vector-based measure of tuning strength, as detailed previously (Smith et al., 2002). We computed the summed response vector and normalized its magnitude by the summed magnitude of all response vectors. Values ranged from 0 to 1, where 1 indicated responses only to a single motion direction, and 0 indicated equal responses to all directions.
Pattern index.
We classified cells as CDS or PDS by computing the pattern index, as detailed previously (Smith et al., 2005). We calculated the partial correlations between the responses to plaid stimuli and each of the component and pattern predictions. After conversion to Z-scores, we took the difference between pattern and component Z-scores as the pattern index. To be classified as PDS, the pattern index must be positive; to be classified as CDS, it must be negative. The absolute value of this index had to exceed the criterion value of 1.28, equivalent to p = 0.90.
Preferred spatial and temporal frequency.
We measured responses to high-contrast sinusoidal gratings drifting in the preferred direction, at 11 spatial frequencies (at optimal drift rate) and at 9–10 drift rates (at optimal spatial frequency). We fit appropriate descriptive functions to the data and extracted the preferred spatial and temporal frequencies.
Sensitivity to coherent motion.
We presented moving random dot fields at six coherence levels from 0 to 100% to each neuron, in both its preferred and antipreferred directions. We used standard methods derived from signal detection theory to determine the proportion of cases in which the spike count was greater for motion in the preferred and nonpreferred direction (Britten et al., 1992). We fit a cumulative Weibull function to the resulting probabilities using a maximum likelihood method and extracted a threshold corresponding to the coherence at which performance was 82% correct.
Preferred speed.
We measured responses to coherent random dot fields moving in the preferred direction at speeds ranging from 0.25 to 100 deg/s. We fit a suitable descriptive function to the resulting tuning curves (Lisberger and Movshon, 1999), from which we determine the preferred speed.
Temporal integration.
We measured responses to coherent random dot fields moving at the neuron's preferred direction and optimal speed, using a range of spatial and temporal intervals between paired dots (Δx, Δt). Though the temporal and spatial offsets of dot pairs varied jointly in these experiments, we have shown in separate control experiments that because stimuli were optimized for speed, neuronal responses depended primarily on temporal and not spatial integration. We therefore represent these data as a function of Δt. The firing rate typically fell exponentially with Δt, so we fit the data on a log response versus linear Δt axis with two straight lines: one of slope zero, the other variable. We take the integration time T as the intersection of the two lines:
where m is the variable slope and b1 and b2 are the two intercepts. T gives the largest temporal offset between paired dots at which their signals interact; at longer intervals, neurons fail to integrate motion information.
Pooled neuronal responses
To relate single-unit recordings to behavior, we simulated the MT neuronal population's sensitivity to stimuli in the fellow and amblyopic eyes. Given the specific behavioral deficits of our amblyopic subjects, we were most interested in overall sensitivity to dot coherence, speed, and temporal offset.
Neurometric functions for motion coherence
We used a simplified version of the pooling model introduced by Shadlen et al. (1996) to generate population neurometric functions for fellow and amblyopic eyes. Our model did not incorporate pooling noise, uncertainty introduced by insensitive neurons, or interneuronal correlations. Furthermore, our model pooled over interpolated responses and variances to a finer range of motion strengths than we tested experimentally. We implemented two versions of the model: discrimination and detection.
First, we fit the measured coherence response functions of individual neurons to motion in the preferred and antipreferred directions. We did this piecewise, fitting a line to responses to antipreferred directions and a second-order polynomial to responses to preferred directions. We then interpolated responses to 29 coherences (0% coherence and 14 coherence levels in each motion direction). These interpolated responses formed the basis for our population responses. For each neuron, we computed the Fano factor (ρ) as the variance-to-mean ratio of spike counts over the stimulus duration (330 ms); ρ contributed to the pooling stage described next.
We simulated a psychophysical discrimination trial by (1) drawing a single response from N neurons to motion in the preferred direction, (2) drawing a single response from N neurons to motion in the antipreferred direction, (3) computing the average response across all neurons in each pool, and (4) applying a simple decision rule to evaluate whether the pooled response in the preferred direction exceeded that in the antipreferred direction.
For each subject, N was the actual number of neurons that preferred the eye in question; these were sampled without replacement. Rather than sampling the same observed responses repeatedly on each trial, we used our measure of neuronal variability ρ to simulate responses drawn from firing rate distributions whose mean and variance matched those of the empirical measurements:
where R draw is the response drawn on a given simulation trial, R obs is the mean response observed experimentally, ρ is the Fano factor, and r is a random number drawn from a normal distribution of zero mean and unit variance.
To visualize smooth psychometric functions, we simulated 1000 trials at each of 29 coherence levels. We fit a cumulative Weibull function to the resulting functions and extracted coherence thresholds. To simulate performance on a detection task, we modified the pooling model. Instead of comparing pooled responses to preferred and antipreferred directions, we modified the decision rule to ask whether the pooled response to motion in the preferred direction at a given coherence level exceeded the pooled response to zero coherence motion. Otherwise, the implementation of detection and discrimination models was identical.
Pooling analysis of tuning
We adapted the pooling model described above to generate population responses to a range of dot speeds and temporal offsets (Δt), as well as to gratings varying in spatial and temporal frequency. We derived pooled responses to a given stimulus variation (speed, frequency, etc.) by drawing single responses, R draw, from each of N neurons, and summing the responses of all neurons to create an aggregate population response for that stimulus condition. For visualization, we simulated 1000 trials at each stimulus condition. After averaging, we fit the descriptive functions used for single-unit data to each population data set and extracted the parameters of interest as described above.
Statistical analysis of pooled responses
We used permutation tests similar to those described for single units to evaluate the significance of differences between the pooled responses of fellow and amblyopic eye neurons. To compute the probability that differences in the pooled neuronal properties could have arisen by chance, we dissociated the data from their labels and made two populations from the neuron pool by randomly assigning each neuron drawn to one eye or the other. From the resulting pools, we generated population analyses as described previously; these were based on 50 trials per condition, similar to the number of trials we measured for each neuron. We extracted parameters of interest (coherence threshold, preferred speed, preferred spatial and temporal frequency, integration time) and computed a suitable measure of the difference between the two populations. We repeated this 1000 times to collect a distribution of signed differences and computed the probability that the differences observed between pools drawn from the original data sets could have occurred by chance. As for comparisons of single-unit distributions, we used a criterion of p ≤ 0.025 for significance.
Behavioral analysis of motion sensitivity
We compared neurophysiological data to psychophysical data from the four amblyopic subjects presented in a previously published study (Kiorpes et al., 2006). Psychophysical thresholds were measured using standard operant conditioning techniques. The task was a two-alternative forced-choice directional discrimination, in which animals had to indicate the direction of translational motion (rightward or leftward) of a field of random dots by pulling one of a pair of grab bars located within reach. Stimuli were presented centrally and subtended between 7.7 and 18.8°. Motion sensitivity, the inverse of dot coherence at threshold performance (75% correct), was evaluated for a range of spatial offsets (Δx) and at several fixed temporal offsets (Δt).
Results
Here we compare results from 269 MT neurons recorded in four amblyopic monkeys. To evaluate amblyopia-induced changes for each animal, we measured interocular differences between neuronal responses recorded through the fellow and amblyopic eye. The fellow eye responses of each subject therefore served as a “benchmark” comparison, controlling for experimental differences across recording sessions and subjects (e.g., anesthesia levels and eccentricity of recordings sites). We first describe how basic response properties of MT are affected by amblyopia, before considering perceptually measured deficits in motion processing and their potential neuronal correlates. Behavioral motion sensitivity data from the four amblyopic monkeys are shown in Figure 4 (below).
Figure 4.
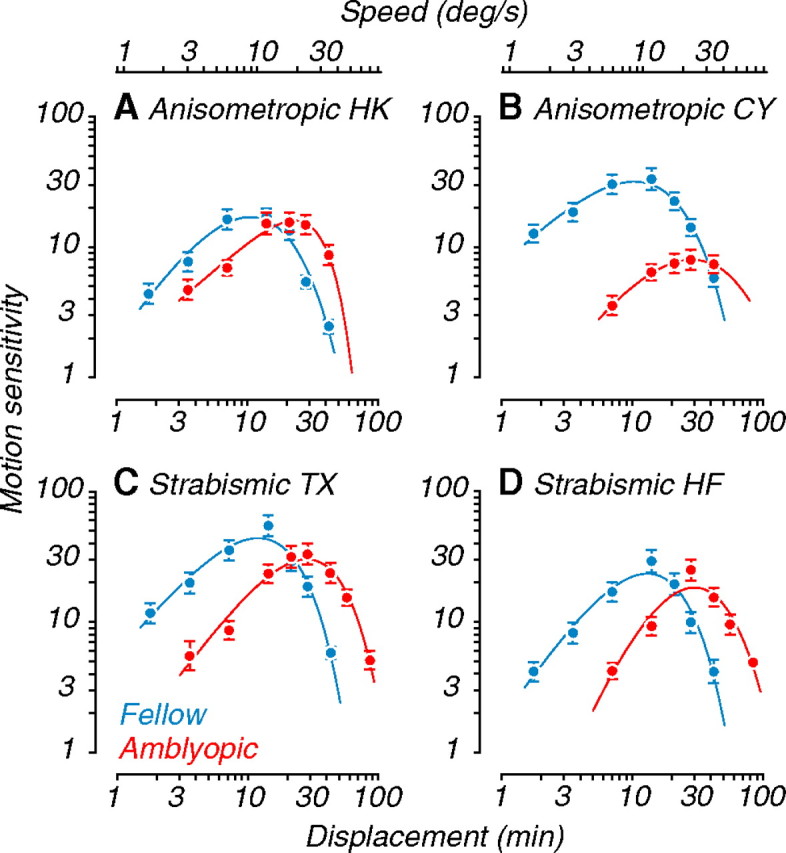
Behavioral motion sensitivity of amblyopic monkeys. Behavioral sensitivity to coherent motion in random dot fields for the amblyopic monkeys used in this study. A, B, Data for the two anisometropes. C, D, Data for the two strabismics. Peak sensitivity (inverse of coherence threshold) of amblyopic eyes was reduced and shifted toward larger dot displacements (bottom abscissa) and higher speeds (top abscissa) compared with fellow eyes. Some of these data (A and D) were published previously [Kiorpes et al. (2006), their Fig. 1].
Neuronal response properties
We measured the visual response properties of MT neurons using random dot fields, sinusoidal gratings, and plaids. In Figure 1, we show the responses of a single neuron tested separately through the amblyopic and fellow eyes (rendered in red and blue, here and hereafter). Note that it was well driven by visual stimulation in either eye, which was uncharacteristic of the population of neurons recorded in amblyopic MT (Fig. 2 B,C). Selectivity for motion direction was similar in the two eyes (Fig. 1 A). However, the neuron's preference for motion speed was shifted toward faster speeds when tested through the amblyopic eye (Fig. 1 B). Furthermore, its response to coherent motion in the preferred direction (Fig. 1 C, filled symbols) was reduced through the amblyopic eye compared with fellow eye stimulation. This weakened response to motion resulted in a higher coherence threshold for that eye (Fig. 1 D, vertical bars through each function).
Figure 1.
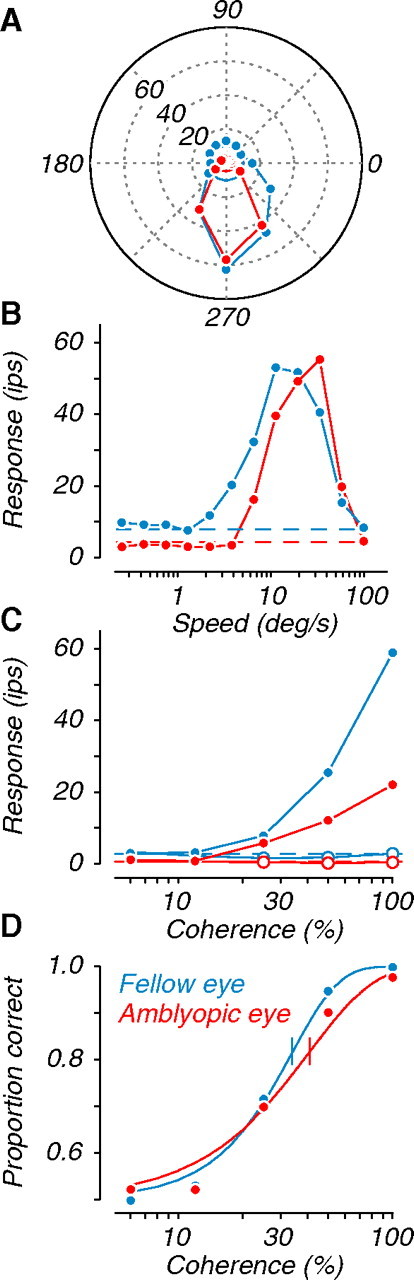
Responses of an example neuron recorded in MT of an amblyopic monkey. We presented random dot fields through the fellow (blue) and amblyopic (red) eye on separate runs. A, Tuning for the direction of motion of coherent dot fields; colored circles near the origin show baseline firing. B, Tuning for the speed of coherent dot fields moving in the preferred direction. C, Responses to dot fields of varying coherence moving in the preferred (open symbols) and antipreferred (filled symbols) directions. Dashed lines in B and C show baseline firing. D, Neurometric functions derived from data in C. Solid lines are fits to the data; the vertical tick through each function represents coherence threshold (at 82% correct).
Figure 2.
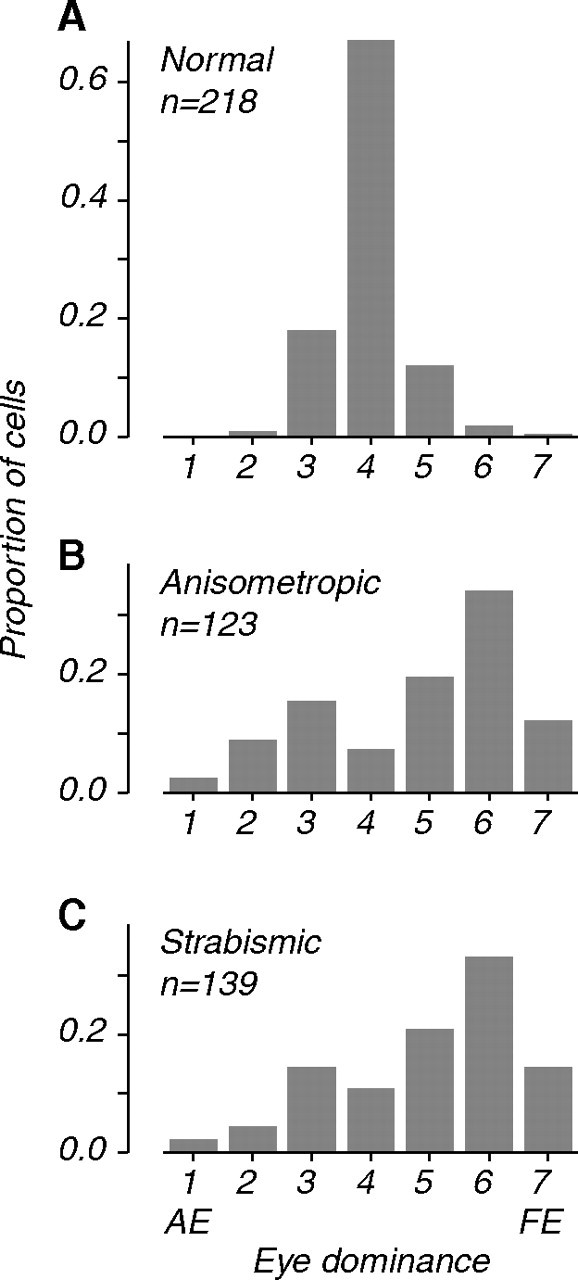
Distributions of eye dominance in MT. A, Data from visually normal controls (from Kiorpes et al., 1996). B, Data from two amblyopic anisometropes. C, Data from two strabismics. Eye dominance categories are transformed so that 1 and 7 represent neurons driven exclusively by the amblyopic (AE) and fellow (FE) eye. Eye dominance in amblyopic MT showed reduced binocularity; fewer neurons were responsive to the amblyopic eye compared to the fellow eye.
Neurons driven equally well through the two eyes were uncommon in amblyopic MT. Distributions of eye dominance showed reduced numbers of strongly binocular cells and a bias toward the fellow eye, for both anisometropes and strabismics (Fig. 2 B,C). This stood in contrast to the highly binocular nature of neurons recorded in visually normal monkeys (Fig. 2 A). In normal macaque MT, 97% of neurons were strongly binocular (categories 3–5), whereas in the amblyopes, fewer than 50% fell in this group. Although we concentrated our recordings in the hemisphere contralateral to the amblyopic eye to maximize the yield of amblyopic eye neurons, most preferred stimulation through the fellow eye. We computed the fraction of cells that were moderately responsive through each eye (categories 1–5 and 3–7). In anisometropes, 87% of neurons responded through the fellow eye compared with 54% through the amblyopic eye; in strabismics, 94% of neurons responded through the fellow eye compared with 53% through the amblyopic eye. In contrast, >98% of neurons in visually normal controls responded through either eye.
We examined several response properties of amblyopic and fellow eye neurons, including peak response, direction index, and pattern index (Fig. 3) and others listed in Table 1, which shows the results of our statistical tests. Amblyopic monkeys might show reduced motion sensitivity because the overall responsiveness of neurons driven through the amblyopic eye is reduced. We therefore evaluated the responsiveness of neurons driven by each eye under optimal stimulus conditions and compared the distributions of peak response (Fig. 3 A,B). Mean peak firing rates (arrows) for fellow and amblyopic distributions were similar for both types of amblyopes; interocular differences were not significant (Table 1).
Figure 3.

Distributions of visual response properties. Data from anisometropes (A, C, E) and strabismics (B, D, F) are shown. A, B, Peak firing rate to coherent dot fields. C, D, Distributions of direction index measured with coherent dot fields. E, F, Distributions of pattern index measured with grating and plaid stimuli; positive values indicate pattern direction selectivity; negative values indicate component selectivity (Smith et al., 2005). For distributions of peak response and direction index, arrows represent geometric mean values; for distributions of pattern index, arrows represent arithmetic mean values. Amblyopic and fellow eye neurons did not differ in peak response or pattern selectivity, but neurons tested through the amblyopic eye tended to be less direction selective (Table 1).
Nearly all MT neurons in visually normal monkeys are direction selective. We quantified direction selectivity in amblyopic MT by computing a direction tuning index based on responses to coherent random dot stimuli (Smith et al., 2002) (Fig. 3 C,D). In anisometropes, amblyopic eye neurons were significantly less direction selective than fellow eye neurons; in strabismics, this interocular difference was not significant (Table 1). We also computed a direction tuning index from responses to gratings and found a similar pattern (Table 1). Interestingly, whereas MT neurons in amblyopes were overwhelmingly direction selective, the degree of selectivity was modestly reduced by amblyopia as compared with those from visually normal animals.
Another distinctive property of MT is that ∼30% of neurons are PDS, responding selectively to the true direction of motion of complex patterns, such as plaids (Movshon et al., 1985). We were interested in examining whether amblyopia alters this property by changing the proportion of PDS cells in MT. We computed a pattern index for each cell, based on its responses to gratings and plaids (Smith et al., 2005). The distributions of pattern indices for neurons driven by the amblyopic and fellow eyes were similar for both groups (Fig. 3 E,F), and no interocular comparisons were significant (Table 1). This suggests that the observed motion processing deficits do not arise from selective losses of either component or pattern cells in MT.
We quantified neuronal variability by computing the Fano factor (variance-to-mean ratio of spike counts; data not shown). We did not find significant interocular differences in Fano factor for neurons in amblyopic monkeys (p = 0.45 for strabismics, p = 0.31 for anisometropes), suggesting that differences in neuronal variability do not contribute to differences in behavioral motion sensitivity between fellow and amblyopic eyes. However, amblyopic MT neurons were, on average, more variable than those recorded in visually normal animals. The geometric mean Fano factor for neurons recorded in normal MT was 1.94 (our unpublished observations), whereas we found a mean of 2.11 in neurons from strabismic amblyopes and 2.77 in neurons from anisometropic amblyopes. Elevated neuronal variability may contribute to the overall inefficiency of amblyopic vision (Kiorpes et al., 1999; Levi et al., 2008).
Behavioral measurements
Our primary goal was to learn whether neuronal responses in area MT of amblyopic monkeys could explain the abnormal behavioral motion sensitivity of our recording subjects. We now turn to consider direct measurements of neuronal properties that could underlie the perceptual deficits. When tested psychophysically using random dot stimuli, all four animals showed specific motion deficits in the amblyopic eye compared with the fellow eye (Fig. 4). Motion sensitivity, the inverse of coherence threshold, was reduced at fine spatial scales (bottom abscissa), corresponding to slower speeds (top abscissa). Correspondingly, the range of best sensitivity for the amblyopic eye was shifted toward coarse spatial scales (faster speeds). Note that some subjects had much stronger effects than others [Fig. 4, compare A (monkey HK), B (monkey CY)]. In addition, three of the four amblyopic monkeys showed an overall reduction in coherence sensitivity when viewing with the amblyopic eye.
Coherence sensitivity
For comparison with the behavioral data, we studied the responses of MT neurons to motion coherence using random dot stimuli. The distributions of coherence thresholds obtained from the neurometric functions of single units (see Fig. 1 D, for example) are shown in Figure 5, A and B. While many neurons were highly sensitive, responding at low coherence, others were quite insensitive. Neurons whose neurometric functions failed to reach the criterion of 82% correct even at full coherence are binned separately (labeled “U” for unclassified). In anisometropes, amblyopic eye neurons were significantly less sensitive to coherence than fellow eye neurons (arrows); we found no significant difference for strabismics (Table 1). The proportion of unclassified cells was higher in anisometropes (43% of amblyopic eye neurons, and 25% of fellow eye neurons) than in strabismics (18 and 17%, respectively). This population appears to be larger in amblyopic MT compared with visually normal animals (where fewer than 15% of neurons were unclassified), suggesting an overall reduction in sensitivity to coherent motion.
Figure 5.

Coherence thresholds of single units and neuronal populations. A, Distributions of coherence threshold for single units recorded in anisometropes. B, Similar data recorded in strabismics. Insensitive cells that did not reach criterion performance even at 100% coherence are labeled “U” for “unclassified”; arrows represent median values. Amblyopic eye distributions were shifted to higher thresholds; this was significant for anisometropes (Table 1). C–F, Neurometric functions computed from pooling analyses of direction discrimination. Solid lines are fits to the data; vertical ticks indicate coherence thresholds. For all subjects, amblyopic eye functions were shifted to the right of fellow eye functions, indicating elevated coherence thresholds (Table 2).
Since behavioral performance on a motion discrimination task is unlikely to be mediated by the responses of single neurons, we examined the behavior of populations of neurons. We used an analysis based on pooling single-unit responses to coherent motion (see Materials and Methods). Figure 5 C–F shows the resulting pooled neurometric functions for each eye of each amblyope; statistical comparisons are listed in Table 2. For each amblyopic monkey, the pooled neurometric function for the amblyopic eye was shifted to the right, reflecting an elevation of coherence threshold. Subject CY showed the largest shift in coherence threshold (fellow eye, 5.1%; amblyopic eye, 21.1%); he was the deepest amblyope of the group, based on contrast sensitivity testing (Kozma and Kiorpes, 2003), he showed the largest loss of motion sensitivity (Fig. 4), and he was the only subject whose neuronal interocular coherence threshold ratio differed significantly from 1 (Table 2). However, when we evaluated the data for all four amblyopes together, the coherence thresholds for the fellow and amblyopic eye populations were significantly different (Table 2).
Table 2.
The probabilities that interocular differences in the visual response properties of simulated populations of amblyopic MT neurons could have arisen by chance
| Simulated population response property | Anisometropes |
Strabismics |
All | ||
|---|---|---|---|---|---|
| HK | CY | TX | HF | ||
| Coherence threshold | 0.237 | <0.001 | 0.098 | 0.039 | 0.003 |
| Preferred speed | 0.259 | 0.072 | 0.022 | 0.008 | 0.004 |
| Spatial frequency | 0.404 | 0.008 | 0.043 | 0.437 | 0.057 |
| Temporal frequency | 0.216 | 0.256 | 0.307 | 0.207 | 0.491 |
| Integration time | 0.076 | 0.374 | 0.020 | 0.132 | 0.011 |
We show pairwise comparisons for simulated populations of fellow and amblyopic eye neurons (fellow eyes vs amblyopic eyes) for individual animals, as well as across all amblyopic subjects (All). The reported values were deemed significant and are listed in bold for p ≤ 0.025.
Higher coherence thresholds of amblyopic eyes could emerge from reduced direction selectivity in neurons driven by that eye, because discrimination performance depends on the difference in neuronal response to the two directions of motion. The distributions of direction tuning indices (Fig. 3 C,D) do not show consistent interocular differences for either type of amblyope, arguing against this notion. However, to address the idea more directly, we modified the pooling analysis to simulate a detection task, rather than a discrimination task (see Materials and Methods). In this task, only the sensitivity of the neurons to random dot motion, and not their directional selectivity, contributes to performance. Figure 6 compares detection and discrimination performance for neurons driven by each eye of the amblyopic subjects. The thresholds for both simulated tasks were well matched, lying along the diagonal and indicating that neurons driven by the amblyopic eye were not simply impaired at motion direction discrimination.
Figure 6.

Comparison of population coherence thresholds for motion discrimination and detection. Detection thresholds are plotted against discrimination thresholds; both were computed from population analyses. The dashed line represents the identity diagonal. Detection and discrimination coherence thresholds were well matched, suggesting that interocular differences in coherence thresholds observed in Figure 5 C–F were not caused by reduced directional selectivity in amblyopic eye neurons.
Selectivity for speed
Behavioral motion sensitivity in the amblyopic eyes of our recording subjects was also biased toward faster speeds (Fig. 4). We have previously reported that this shift was, in part, related to the reduced spatial scale of the amblyopic eye (Kiorpes et al., 2006). To evaluate whether neuronal preference for motion speed was similarly shifted, we measured responses to coherent random dot fields of varying speeds moving in the neurons' preferred direction. Figure 7, A and B, shows the distributions of preferred speed for single units. Although the distributions largely overlap, average preferred speeds for amblyopic eye neurons were indeed shifted relative to fellow eye neurons (arrows). This was clearer in strabismics, where the distribution of preferred speed for amblyopic eye neurons was significantly different from that for fellow eye neurons. Although the mean of the distribution for amblyopic eye neurons was also higher than for the fellow eye neurons in anisometropic amblyopes, the difference was not statistically significant (Table 1). These results suggest that the observed behavioral bias toward fast speeds in amblyopic subjects may be mediated, in part, by changes in speed tuning at the level of MT.
Figure 7.

Speed tuning of single units and neuronal populations. A, Distributions of preferred speed for single units recorded in anisometropes in. B, Similar data recorded in strabismics. Arrows represent geometric mean preferred speeds. C–F, Speed tuning for each amblyope, computed from pooling analyses; data were normalized to the peak amplitude of the fellow eye. Amblyopic eye data had higher preferred speeds compared with the fellow eye (Tables 1, 2).
To examine neuronal selectivity for motion speed on a population level, we used a pooling approach (see Materials and Methods). The aggregate speed tuning curves for each amblyopic subject are shown in Figure 7 C–F. To compare data from the two eyes, we normalized the curves to the peak amplitude of the fellow eye. Amblyopic eye curves had lower overall magnitudes relative to fellow eye curves, presumably because of the smaller proportion of neurons driven through the amblyopic eye (Fig. 2). This interocular magnitude difference is unlikely to reflect reduced activity in the amblyopic response pool because we found similar distributions of peak firing rates in the fellow and amblyopic eyes (Fig. 3 A,B). The curves in Figure 7 C–F show another characteristic echoing the psychophysical data: optimal speeds for amblyopic eyes were higher than for fellow eyes. These amblyopia-induced shifts were evident for all amblyopes and were significant for both strabismic subjects (Table 2). The difference was less clear and eluded significance for the anisometropic subjects (Table 2). When data were combined across all amblyopes, the speed shift between amblyopic and fellow eyes was highly significant.
Basis for amblyopic shifts in neuronal speed preference
To understand the basis for the observed amblyopia-induced shifts in speed preference in MT (Fig. 7 C–F), we asked whether these shifts were predictable from the spatiotemporal properties of the neurons. We therefore examined selectivity for the spatial (Fig. 8) and temporal (Fig. 9) frequency of drifting gratings. Figure 8, A and B, shows the distributions of preferred spatial frequency for single units. Neurons driven by the amblyopic eye tended to have lower preferred spatial frequencies compared with the fellow eye; however, these interocular differences were not significant when collapsed across subjects (Table 1). Previous recordings in amblyopic V1 have reported significant interocular differences in spatial frequency preference, with neurons driven by the amblyopic eye tuned to lower spatial frequencies (Movshon et al., 1987; Kiorpes et al., 1998). This finding was directly related to the depth of amblyopia and was apparent mainly for the deepest amblyopic subjects. Similarly, in the current study, single-unit distributions of neurons recorded in our most severe amblyope (monkey CY; data not shown) showed the largest interocular difference individually, which approached significance (p = 0.026).
Figure 8.

Spatial frequency tuning of single units and neuronal populations. A, Distributions of preferred spatial frequency for single units recorded in anisometropes. B, Similar data recorded in strabismics. Arrows represent geometric mean preferred frequencies. C–F, Spatial frequency tuning for each amblyope, computed from pooling analyses; data were normalized to the peak amplitude of the fellow eye. Amblyopic eye data had lower preferred spatial frequencies compared to the fellow eye (Tables 1, 2).
Figure 9.

Temporal frequency tuning of single units and neuronal populations. A, Distributions of preferred temporal frequency for single units recorded in anisometropes B, Similar data recorded in strabismics. Arrows represent geometric mean preferred frequencies. C–F, Temporal frequency tuning for each amblyope, computed from pooling analyses; data were normalized to the peak amplitude of the fellow eye. Amblyopic and fellow eye data had similar preferred drift rates (Tables 1 and 2).
We examined selectivity for spatial frequency on a population level by pooling single-unit responses, as described previously for speed. Figure 8 C–F shows the aggregate spatial frequency tuning curves for each amblyopic subject. We normalized the curves to the peak amplitude of the fellow eye. Amblyopic eye curves were shifted to the left of fellow eye curves, indicating lower preferred spatial frequencies. This was clearest for our most severe amblyopes (CY and TX); the interocular difference was significant for CY but not for TX. When pooled across all animals, the interocular difference was not significant (Table 2).
Figure 9, A and B, shows the distributions of preferred temporal frequency for single units. These distributions were not statistically different for amblyopic and fellow eye neurons (Table 1), suggesting that there were no amblyopia-induced changes in the temporal tuning properties of MT neurons. We pooled these single-unit responses and examined selectivity for temporal frequency on a population level. Figure 9 C–F shows the aggregate temporal frequency tuning curves for each amblyopic subject. Again, we normalized the curves to the peak amplitude of the fellow eye. Amblyopic and fellow eye curves were similarly tuned; none of the interocular comparisons were significant (Table 2).
Although there were no apparent effects of amblyopia on the temporal properties of neurons recorded in MT, the observed shifts toward lower preferred spatial frequencies in the amblyopic eye could account for the higher preferred speeds in that eye. To evaluate whether the combined spatiotemporal properties of MT cells could predict the measured shift toward higher preferred speed, we plotted measured preferred speeds obtained from the pooling analysis (ordinate, derived from Fig. 7 C–F) against the predicted preferred speeds for each eye (abscissa, derived from the ratio of preferred temporal to spatial frequency from Figs. 8 and 9 C–F). The comparison is shown in Figure 10. Predicted and measured speed matched well for all eyes. We conclude that amblyopia-induced shifts toward higher preferred speeds in the amblyopic eyes are due simply to changes in the spatiotemporal properties of neurons in MT.
Figure 10.

Comparison of measured and predicted preferred speeds for neuronal populations. For each eye, we plot the measured preferred speed (ordinate, derived from Fig. 7 C) against the predicted preferred speed (abscissa, derived from the optimal spatial and temporal frequencies in Figs. 8 and 9); both were computed from population analyses. The dashed line represents the identity diagonal. Measured and predicted preferred speeds were well matched, suggesting that amblyopic shifts in preferred speed were caused by changes in the spatiotemporal properties of MT neurons.
Temporal integration
In our previous psychophysical study, we were struck by the large deficits in temporal integration we measured in the amblyopic eyes of both kinds of amblyopes and in the fellow eyes of strabismics (Kiorpes et al., 2006). Figure 11 A shows example behavioral data. Performance with the fellow eye was largely independent of increasing temporal offset between dots in a pair (Δt), whereas it declined gradually with the amblyopic eye. This was true for all subjects. We therefore wondered whether MT neurons recorded in amblyopes showed abnormal temporal integration properties that could account for this behavioral finding.
Figure 11.
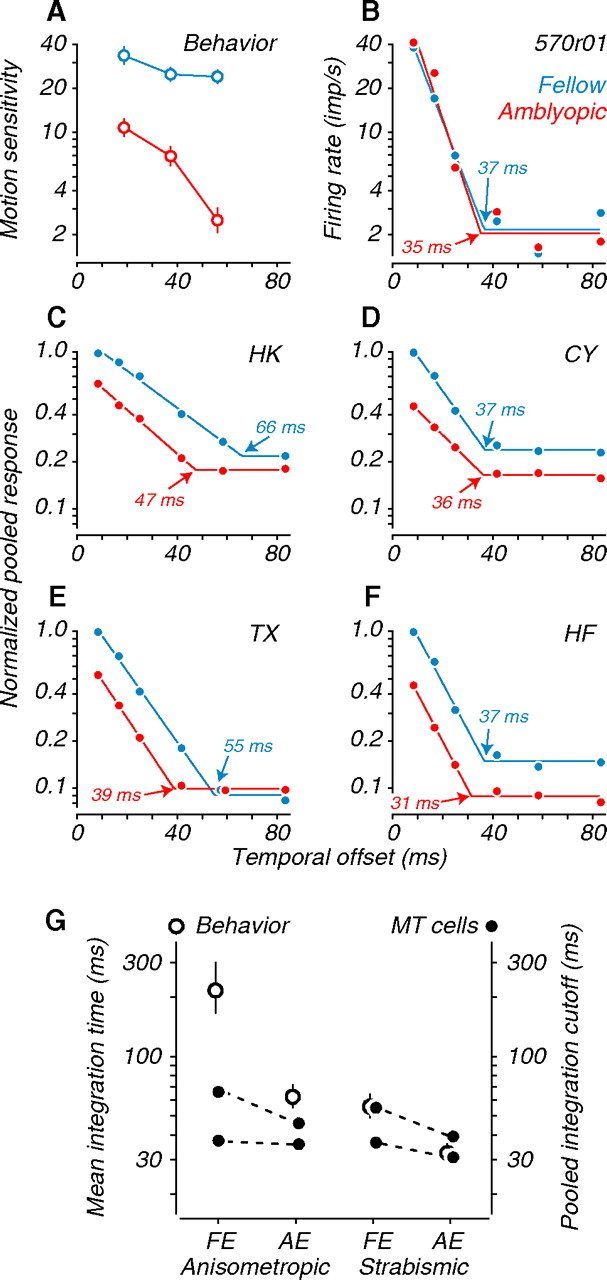
Temporal integration. A, Behavioral motion sensitivity of an example amblyopic subject. Performance through the amblyopic eye fell gradually with increasing temporal offset (Δt); fellow eye performance was stable. B, Responses of an example binocular MT neuron to coherent dot fields of optimal direction and speed. Responses fell rapidly with increasing Δt, independent of the viewing eye. The intersection of the two fitted lines (arrows) determines integration time (see Materials and Methods). Baseline firing is given by the horizontal portion of each fit; this fitted measure is similar to other measurements of baseline firing. C, D, Population responses for each anisometropic subject. E, F, Population responses for each strabismic subject. Data were normalized to the peak amplitude of the fellow eye. G, Comparison of behavioral (left ordinate, open symbols) and physiological (right ordinate, filled symbols) measures of integration time. Treatment conditions are indicated on the abscissa (FE, fellow eye; AE, amblyopic eye). MT neuron integration times were notably shorter than behavioral integration times, and shorter for amblyopic eyes than fellow eyes.
Psychophysically, temporal integration (sensitivity to variation in Δt) does not depend on the spatial offset (Δx) (Kiorpes and Movshon, 2004; Kiorpes et al., 2006). In separate control experiments in normal animals, however, we have observed that temporal integration by neurons does depend on Δx, with longer temporal integration times observed for larger values of Δx, consistent with the idea that MT neurons encode object speed (N. J. Majaj, Y. El-Shamayleh, A. Kohn, L. Hwang, and J. A. Movshon, unpublished observations). Measuring neuronal temporal integration by varying Δt at a fixed Δx would therefore conflate the effect of varying the temporal interval with the effect of changing stimulus speed. To avoid this confound, we measured temporal integration with a constant optimal speed of dot motion, varying both Δx and Δt. We represent these data as a function of Δt, interpret them as an upper bound on the temporal integration of our MT cells, and compare them on that basis with behavioral measures of temporal integration.
The responses of an example binocular neuron are shown in Figure 11 B. The physiological functions stand in contrast to their psychophysical counterparts: even though all stimuli moved at the neuron's optimal speed, the firing rate fell rapidly with Δt and fell to baseline by 40 ms, regardless of the viewing eye. This was true across all recordings in both types of amblyopes, suggesting that MT neurons fail to integrate motion cues over long temporal delays with our random dot stimuli. We again used a pooling method to examine the temporal integration performance of simulated neural populations. As for the speed-tuning analyses in Figure 7, we normalized the pooled responses to the peak amplitude of the fellow eye (Fig. 11 C–F). Pooled responses for all subjects fell rapidly with increasing Δt, regardless of the viewing eye. Interestingly, amblyopic eye profiles were shifted leftward, suggesting a specific defect in temporal integration for neurons driven through that eye. We quantified integration time for MT neurons by measuring the value of Δt for which responses fell to baseline (Fig. 11 C–F, arrows) (see Materials and Methods). When the data were pooled across all amblyopic subjects, and for subject TX individually, integration time was significantly shorter for amblyopic eye responses than for fellow eye responses (Table 2).
Figure 11 G shows neuronal integration times (solid symbols, right ordinate) alongside mean behavioral integration times (open symbols, left ordinate). Numerical comparisons between neuronal and behavioral integration times should be made with caution, because the values are measured differently and because the behavioral integration times were extrapolated from measurements made over a limited range of temporal offsets (Kiorpes et al., 2006). Even allowing for the difference in measures, physiological integration times were substantially shorter than behavioral integration times for the fellow eyes of anisometropes, suggesting a dissociation between perceptual integration of motion cues and neuronal integration at the level of MT. In contrast, the two measures of integration time were reasonably well matched for the amblyopic eyes of anisometropes and for both eyes of strabismics. A plausible interpretation is that behavioral temporal integration depends, in part, on a processing stage downstream of MT that can integrate signals over longer times than MT neurons can and that this stage is selectively impaired in amblyopes.
Discussion
Amblyopia is unusual among developmental disorders in that we have an excellent nonhuman primate model. This allows us to study developmental plasticity and to use the resulting variations in brain and behavior to relate cortical function to visual performance. Most studies of the neural correlates of amblyopia have concentrated on V1, which has been presumed since the early work of Wiesel and Hubel (1963; Hubel et al., 1977) to be the primary locus of the defect. Studies of amblyopic V1 have reported a somewhat variable reduction in the proportion of neurons that prefer visual stimulation in the amblyopic eye, as well as poorer spatial resolution and contrast sensitivity in those neurons (Movshon et al., 1987; Kiorpes et al., 1998). Although these abnormalities explain some amblyopic visual deficits, they fail to account for the full range of losses. A plausible explanation for this discrepancy is that some of the amblyopic deficit depends on losses that occur downstream of V1. Data from cats with experimental strabismus and amblyopia show ocular dominance changes in extrastriate cortex, with fewer neurons responsive to the strabismic or amblyopic eye (Sireteanu and Best, 1992; Schröder et al., 2002). Unfortunately, these studies evaluated only ocular dominance and did not measure the visual response properties of neurons in extrastriate cortex in further detail. One brief previous report in monkey extrastriate area V4 also found disruption of ocular dominance and somewhat shifted spatial frequency tuning in a small sample of neurons (Movshon et al., 1987).
In this study, we asked whether amblyopia-induced deficits in behavioral motion sensitivity were reflected in the neuronal response properties of primate extrastriate area MT. We studied MT because of its well established role in the processing and perception of visual motion. To relate neuronal and behavioral deficits, we recorded from amblyopic monkeys from which we had obtained extensive psychophysical data on a motion discrimination task. When tested through their amblyopic eyes, these animals showed reduced sensitivity to coherent motion, required faster speeds for best performance, and showed reduced temporal integration of motion signals (Kiorpes et al., 2006).
MT neurons recorded in these monkeys showed a number of abnormal response properties. In normal MT, most neurons are driven well through either eye, but in the amblyopic animals, most neurons preferred visual stimulation through the fellow eye (Fig. 2). Our previous studies of V1 in amblyopia suggested that shifts in eye dominance were either negligible (for strabismic animals) or modest (for anisometropic animals). We have previously reported losses of binocularity in MT of nonamblyopic strabismic monkeys that were not likely to be attributable to changes in V1 (Kiorpes et al., 1996). In the present MT recordings, cells recorded from both groups of amblyopes showed substantial shifts in eye dominance away from the amblyopic eye, an effect that also seems unlikely to be simply inherited from V1. Furthermore, when analyzed as a population, neurons driven by the amblyopic eye had higher coherence thresholds and faster preferred speeds than those driven by the fellow eye.
For each of our animals, we compared the extent of visual deficits measured psychophysically with those determined from neuronal measurements in MT. We customarily measure the effect of amblyopia by taking the ratio of performance in the fellow and amblyopic eyes. Figure 12 A shows the ratio of coherence thresholds measured physiologically (ordinate, derived from Fig. 5 C–F) and psychophysically (abscissa, derived from Fig. 4). The behavioral losses in sensitivity to coherent motion were closely mirrored by losses in the pooled sensitivity of neurons driven through the amblyopic eye. These differences in coherence threshold are unlikely to be inherited from V1. Because of the small size of V1 receptive fields, only a small number of coherent dots can fall within them in a physiologically relevant interval. The coherence thresholds of V1 neurons should therefore be much higher than those of MT neurons. This suggests that behavioral sensitivity to coherent motion, as measured by coherence threshold, is set and limited by neural processing in MT (Britten et al., 1992).
Figure 12.
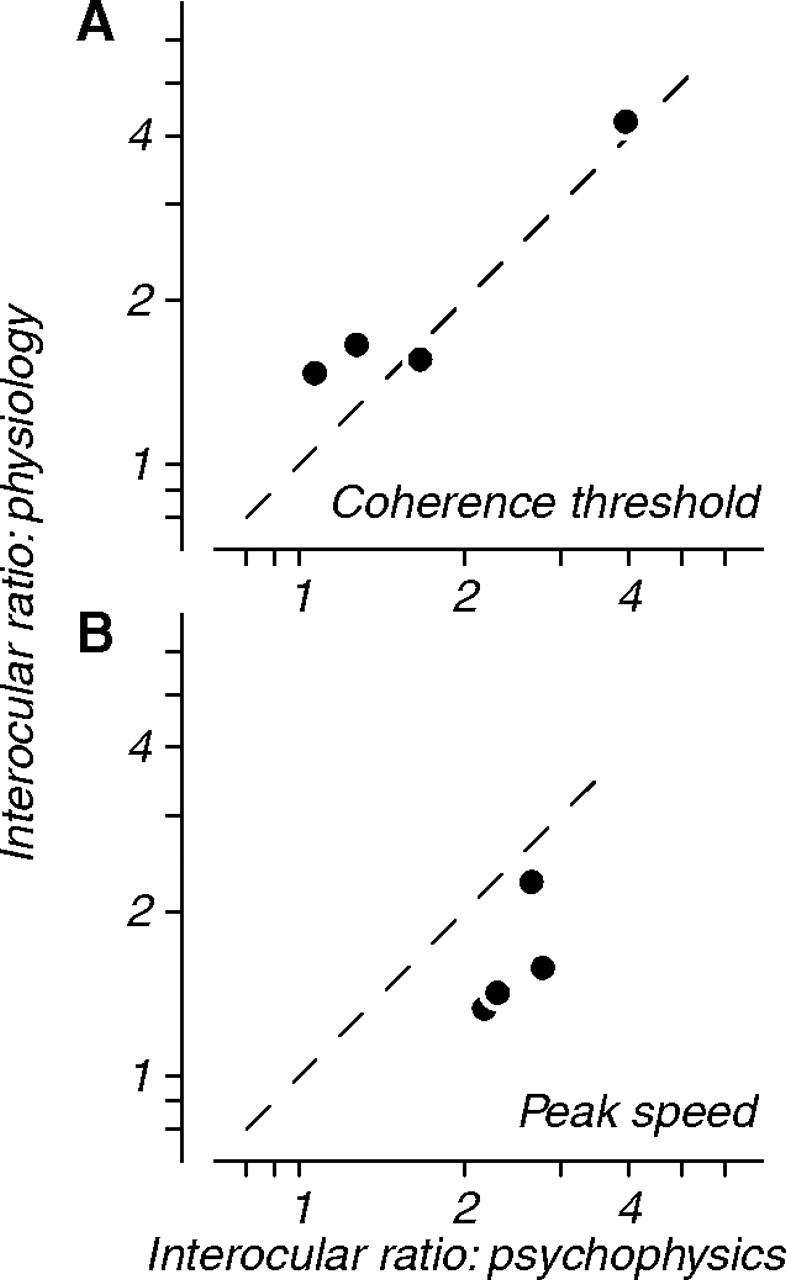
Comparison of neuronal and behavioral motion deficits. A, Interocular ratios of coherence thresholds measured physiologically from neuronal populations (ordinate, derived from Fig. 5 C–F) and behaviorally (abscissa, derived from Fig. 4). Physiological and behavioral shifts in coherence threshold were well matched. B, Interocular ratios of preferred speed measured physiologically from neuronal populations (ordinate, derived from Fig. 7 C–F) and behaviorally (abscissa, derived from Fig. 4). Physiological shifts in speed preference were correlated with behavioral changes but were more modest in magnitude.
Figure 12 B shows the ratio of preferred speed between fellow and amblyopic eyes, measured physiologically (ordinate, derived from Fig. 7 C–F) and psychophysically (abscissa, derived from Fig. 4). Changes in neuronal speed preference correlated with the behavioral shifts; pooled neuronal responses through the amblyopic eye were consistently biased toward faster speeds. These physiological shifts, however, were more modest than the behavioral changes. Changes in neuronal speed preference in MT might result from changes in the properties of V1 neurons. We have previously shown that V1 neurons driven through the amblyopic eye tend to prefer lower spatial frequencies (Movshon et al., 1987; Kiorpes et al., 1998), and neurons preferring lower spatial frequencies should also prefer higher speeds. In MT, we noted differences in peak spatial frequency between the eyes, but no consistent differences in peak temporal frequency. Across animals, the shifts in preferred speed between the two eyes were consistent with those predicted based on the spatiotemporal tuning properties of the population (Fig. 10). Because the range of spatiotemporal frequencies signaled by MT neurons could be set by the tuning properties of their V1 inputs, we cannot rule out the possibility that neuronal preference for speed is determined in V1 and is merely inherited by neurons in MT.
Temporal integration deficits have not received much attention in amblyopia, despite occasional reports of substantial losses in temporal integration (Altmann and Singer, 1986). We found clear reductions in integration time, measured behaviorally, for the amblyopic eyes of the animals in a previous study (Kiorpes et al., 2006), and we therefore looked for neuronal correlates in the temporal integration properties of MT neurons. This search was compromised by the fact that even in normal monkeys, MT neurons do not integrate signals over long intervals as well as monkeys do. Figure 11, A and B, shows that although behavioral motion discrimination is well maintained out to temporal offset (Δt) values of 60 ms and by extrapolation longer times (see also Kiorpes and Movshon, 2004), MT responses in all animals fell to baseline for Δt values longer than 40 ms. This finding shows a clear dissociation between the temporal integration properties of MT neurons and the behavioral capacity to integrate motion cues at long temporal intervals. This is not unexpected: a previous study that used stroboscopic slits to assess the limits of spatial and temporal motion integration in MT (Mikami et al., 1986) reported a mean temporal integration limit of 24 ms in MT, of the same order as our estimates from random dot stimuli.
Despite the overall discrepancy between behavioral and physiological integration times, our results show that amblyopia affected temporal integration. In three of the four amblyopic monkeys, the integration times estimated from our neuronal population analysis were shorter for the amblyopic eye than for the fellow eye (Fig. 11 C–F). The individual animal differences approached but did not reach significance, but when pooled across cases, the difference was highly significant. The discrepancy between behavioral and MT neuronal integration times suggest that this aspect of motion perception cannot be limited by cortical processing in MT alone. There is considerable psychophysical evidence for a late stage of processing that integrates motion information over long periods (Nakayama and Silverman, 1984; Verghese et al., 1999). Physiological studies of neurons in area LIP, which receive direct projections from MT, show that they integrate motion signals over longer time periods, accumulating sensory evidence before initiating goal-directed behaviors (Roitman and Shadlen, 2002). We therefore propose that amblyopia affects this downstream processing stage in addition to having the modest but reliable effects on MT integration times that we observed. It is interesting that amblyopia affects temporal integration but our other measure of temporal processing, temporal frequency tuning, was unaffected (Fig. 9). This suggests that different processes are reflected in these two measurements: temporal frequency tuning might reflect the properties of afferent inputs to MT, whereas integration over Δt might reflect processing within MT.
It should be noted that we have compared the behavioral motion deficits of amblyopic subjects to the neuronal response properties of MT recorded under anesthesia. The direction selectivity and orientation bandwidth of MT neurons have been shown to be unaltered by anesthesia (Pack et al., 2001). Furthermore, the ranges of our quantitative measurements are comparable to those obtained in awake MT by other investigators: for motion coherence thresholds (Britten et al., 1992; Shadlen et al., 1996), preferred speeds (Liu and Newsome, 2003), and temporal integration limits (Mikami et al., 1986). We are therefore confident that our comparisons are unlikely to be materially affected by anesthesia.
We conclude that some, but not all, of the amblyopic deficits in behaviorally measured motion sensitivity can be attributed to the abnormal development of area MT. Changes in speed sensitivity seem likely to be derived from the spatiotemporal properties of V1 inputs. Reduced coherence sensitivity seems likely to result from changes within MT. Shorter integration times probably depend on changes both in MT and in downstream areas. We therefore conclude that different aspects of the same behavioral capacity may be limited by neural computations in different cortical loci. Moreover, our results demonstrate for the first time that the development of visual neuronal response properties in primate extrastriate cortex, like that of striate cortex, is modified by visual experience.
Footnotes
This work was supported by National Institutes of Health Grants EY5684 (L.K.), EY2017 (J.A.M.), and RR00166 (Washington National Primate Center). We thank Chao Tang for assistance with the behavioral data, Howard Eggers for strabismus surgery and refractions, Laurence Maloney for statistical advice, and Michael Gorman for assistance with animal care and testing.
References
- Altmann L, Singer W. Temporal integration in amblyopic vision. Vision Res. 1986;26:1959–1968. doi: 10.1016/0042-6989(86)90121-5. [DOI] [PubMed] [Google Scholar]
- Bonhomme GR, Liu GT, Miki A, Francis E, Dobre MC, Modestino EJ, Aleman DO, Haselgrove JC. Decreased cortical activation in response to a motion stimulus in anisometropic amblyopic eyes using functional magnetic resonance imaging. J Aapos. 2006;10:540–546. doi: 10.1016/j.jaapos.2006.07.008. [DOI] [PubMed] [Google Scholar]
- Britten KH, Shadlen MN, Newsome WT, Movshon JA. The analysis of visual motion: a comparison of neuronal and psychophysical performance. J Neurosci. 1992;12:4745–4765. doi: 10.1523/JNEUROSCI.12-12-04745.1992. [DOI] [PMC free article] [PubMed] [Google Scholar]
- Cavanaugh JR, Bair W, Movshon JA. Nature and interaction of signals from the receptive field center and surround in macaque V1 neurons. J Neurophysiol. 2002;88:2530–2546. doi: 10.1152/jn.00692.2001. [DOI] [PubMed] [Google Scholar]
- Constantinescu T, Schmidt L, Watson R, Hess RF. A residual deficit for global motion processing after acuity recovery in deprivation amblyopia. Invest Ophthalmol Vis Sci. 2005;46:3008–3012. doi: 10.1167/iovs.05-0242. [DOI] [PubMed] [Google Scholar]
- Ellemberg D, Lewis TL, Maurer D, Brar S, Brent HP. Better perception of global motion after monocular than after binocular deprivation. Vision Res. 2002;42:169–179. doi: 10.1016/s0042-6989(01)00278-4. [DOI] [PubMed] [Google Scholar]
- Hubel DH, Wiesel TN, LeVay S. Plasticity of ocular dominance columns in monkey striate cortex. Philos Trans R Soc Lond B Biol Sci. 1977;278:377–409. doi: 10.1098/rstb.1977.0050. [DOI] [PubMed] [Google Scholar]
- Imamura K, Richter H, Fischer H, Lennerstrand G, Franzen O, Rydberg A, Andersson J, Schneider H, Onoe H, Watanabe Y, Langstrom B. Reduced activity in the extrastriate visual cortex of individuals with strabismic amblyopia. Neurosci Lett. 1997;225:173–176. doi: 10.1016/s0304-3940(97)00211-5. [DOI] [PubMed] [Google Scholar]
- Kiorpes L, Movshon JA. Neural limitations on visual development in primates. In: Chalupa LM, Werner JS, editors. The visual neurosciences. Cambridge, MA: MIT; 2004. pp. 159–173. [Google Scholar]
- Kiorpes L, Kiper DC, Movshon JA. Contrast sensitivity and vernier acuity in amblyopic monkeys. Vision Res. 1993;33:2301–2311. doi: 10.1016/0042-6989(93)90107-8. [DOI] [PubMed] [Google Scholar]
- Kiorpes L, Walton PJ, O'Keefe LP, Movshon JA, Lisberger SG. Effects of early-onset artificial strabismus on pursuit eye movements and on neuronal responses in area MT of macaque monkeys. J Neurosci. 1996;16:6537–6553. doi: 10.1523/JNEUROSCI.16-20-06537.1996. [DOI] [PMC free article] [PubMed] [Google Scholar]
- Kiorpes L, Kiper DC, O'Keefe LP, Cavanaugh JR, Movshon JA. Neuronal correlates of amblyopia in the visual cortex of macaque monkeys with experimental strabismus and anisometropia. J Neurosci. 1998;18:6411–6424. doi: 10.1523/JNEUROSCI.18-16-06411.1998. [DOI] [PMC free article] [PubMed] [Google Scholar]
- Kiorpes L, Tang C, Movshon JA. Factors limiting contrast sensitivity in experimentally amblyopic macaque monkeys. Vision Res. 1999;39:4125–4160. doi: 10.1016/s0042-6989(99)00130-3. [DOI] [PubMed] [Google Scholar]
- Kiorpes L, Tang C, Movshon JA. Sensitivity to visual motion in amblyopic macaque monkeys. Vis Neurosci. 2006;23:247–256. doi: 10.1017/S0952523806232097. [DOI] [PubMed] [Google Scholar]
- Kozma P, Kiorpes L. Contour integration in amblyopic monkeys. Vis Neurosci. 2003;20:577–588. doi: 10.1017/s0952523803205113. [DOI] [PubMed] [Google Scholar]
- Levi DM, Klein SA, Chen I. What limits performance in the amblyopic visual system: seeing signals in noise with an amblyopic brain. J Vis. 2008;8:1–23. doi: 10.1167/8.4.1. [DOI] [PubMed] [Google Scholar]
- Lisberger SG, Movshon JA. Visual motion analysis for pursuit eye movements in area MT of macaque monkeys. J Neurosci. 1999;19:2224–2246. doi: 10.1523/JNEUROSCI.19-06-02224.1999. [DOI] [PMC free article] [PubMed] [Google Scholar]
- Liu J, Newsome WT. Functional organization of speed tuned neurons in visual area MT. J Neurophysiol. 2003;89:246–256. doi: 10.1152/jn.00097.2002. [DOI] [PubMed] [Google Scholar]
- Mikami A, Newsome WT, Wurtz RH. Motion selectivity in macaque visual cortex. II. Spatiotemporal range of directional interactions in MT and V1. J Neurophysiol. 1986;55:1328–1339. doi: 10.1152/jn.1986.55.6.1328. [DOI] [PubMed] [Google Scholar]
- Movshon JA, Adelson EH, Gizzi MS, Newsome WT. The analysis of moving visual patterns. In: Chagas CRG, Gross C, editors. Pattern recognition mechanisms. New York: Springer; 1985. pp. 117–151. [Google Scholar]
- Movshon JA, Eggers HM, Gizzi MS, Hendrickson AE, Kiorpes L, Boothe RG. Effects of early unilateral blur on the macaque's visual system. III. Physiological observations. J Neurosci. 1987;7:1340–1351. doi: 10.1523/JNEUROSCI.07-05-01340.1987. [DOI] [PMC free article] [PubMed] [Google Scholar]
- Nakayama K, Silverman GH. Temporal and spatial characteristics of the upper displacement limit for motion in random dots. Vision Res. 1984;24:293–299. doi: 10.1016/0042-6989(84)90054-3. [DOI] [PubMed] [Google Scholar]
- Newsome WT, Pare EB. A selective impairment of motion perception following lesions of the middle temporal visual area (MT) J Neurosci. 1988;8:2201–2211. doi: 10.1523/JNEUROSCI.08-06-02201.1988. [DOI] [PMC free article] [PubMed] [Google Scholar]
- Pack CC, Berezovskii VK, Born RT. Dynamic properties of neurons in cortical area MT in alert and anaesthetized macaque monkeys. Nature. 2001;414:905–908. doi: 10.1038/414905a. [DOI] [PubMed] [Google Scholar]
- Roitman JD, Shadlen MN. Response of neurons in the lateral intraparietal area during a combined visual discrimination reaction time task. J Neurosci. 2002;22:9475–9489. doi: 10.1523/JNEUROSCI.22-21-09475.2002. [DOI] [PMC free article] [PubMed] [Google Scholar]
- Salzman CD, Britten KH, Newsome WT. Cortical microstimulation influences perceptual judgements of motion direction. Nature. 1990;346:174–177. doi: 10.1038/346174a0. [DOI] [PubMed] [Google Scholar]
- Schröder JH, Fries P, Roelfsema PR, Singer W, Engel AK. Ocular dominance in extrastriate cortex of strabismic amblyopic cats. Vision Res. 2002;42:29–39. doi: 10.1016/s0042-6989(01)00263-2. [DOI] [PubMed] [Google Scholar]
- Shadlen MN, Britten KH, Newsome WT, Movshon JA. A computational analysis of the relationship between neuronal and behavioral responses to visual motion. J Neurosci. 1996;16:1486–1510. doi: 10.1523/JNEUROSCI.16-04-01486.1996. [DOI] [PMC free article] [PubMed] [Google Scholar]
- Simmers AJ, Ledgeway T, Hess RF, McGraw PV. Deficits to global motion processing in human amblyopia. Vision Res. 2003;43:729–738. doi: 10.1016/s0042-6989(02)00684-3. [DOI] [PubMed] [Google Scholar]
- Simmers AJ, Ledgeway T, Hess RF. The influences of visibility and anomalous integration processes on the perception of global spatial form versus motion in human amblyopia. Vision Res. 2005;45:449–460. doi: 10.1016/j.visres.2004.08.026. [DOI] [PubMed] [Google Scholar]
- Simmers AJ, Ledgeway T, Mansouri B, Hutchinson CV, Hess RF. The extent of the dorsal extra-striate deficit in amblyopia. Vision Res. 2006;46:2571–2580. doi: 10.1016/j.visres.2006.01.009. [DOI] [PubMed] [Google Scholar]
- Sireteanu R, Best J. Squint-induced modification of visual receptive fields in the lateral suprasylvian cortex of the cat: binocular interaction, vertical effect and anomalous correspondence. Eur J Neurosci. 1992;4:235–242. doi: 10.1111/j.1460-9568.1992.tb00871.x. [DOI] [PubMed] [Google Scholar]
- Smith MA, Bair W, Movshon JA. Signals in macaque striate cortical neurons that support the perception of glass patterns. J Neurosci. 2002;22:8334–8345. doi: 10.1523/JNEUROSCI.22-18-08334.2002. [DOI] [PMC free article] [PubMed] [Google Scholar]
- Smith MA, Majaj NJ, Movshon JA. Dynamics of motion signaling by neurons in macaque area MT. Nat Neurosci. 2005;8:220–228. doi: 10.1038/nn1382. [DOI] [PubMed] [Google Scholar]
- Verghese P, Watamaniuk SN, McKee S, Grzywacz NM. Local motion detectors cannot account for the detectability of an extended trajectory in noise. Vision Res. 1999;39:19–30. doi: 10.1016/s0042-6989(98)00033-9. [DOI] [PubMed] [Google Scholar]
- Wiesel TN, Hubel DH. Singe-cell responses in striate cortex of kittens deprived of vision in one eye. J Neurophysiol. 1963;26:1003–1017. doi: 10.1152/jn.1963.26.6.1003. [DOI] [PubMed] [Google Scholar]