

Abstract
N-formyl peptide receptors (FPR) are important in host defense. Because of the potential for FPRs as therapeutic targets, recent efforts have focused on identification of non-peptide agonists for two FPR subtypes, FPR1 and FPR2. Given that a number of specific small molecule agonists have recently been identified, we hypothesized that computational structure-activity relationship (SAR) analysis of these molecules could provide new information regarding molecular features required for activity. We used a training set of 71 compounds, including 10 FPR1-specific agonists, 36 FPR2-specific agonists, and 25 non-active analogs. A sequence of (1) one-way analysis of variance selection, (2) cluster analysis, (3) linear discriminant analysis, and (4) classification tree analysis led to the derivation of SAR rules with high (95.8%) accuracy for correct classification of compounds. These SAR rules revealed key features distinguishing FPR1 versus FPR2 agonists. To verify predictive ability, we evaluated a test set of 17 additional FPR agonists, and found that the majority of these agonists (>94%) were classified correctly as agonists. This study represents the first successful application of classification tree methodology based on atom pairs to SAR analysis of FPR agonists. Importantly, these SAR rules represent a relatively simple classification approach for virtual screening of FPR1/FPR2 agonists.
Keywords: Formyl peptide receptor (FPR), FPR agonists, Atom pairs, Molecular descriptors, Structure-activity relationship analysis
1. Introduction
N-formyl peptides activate phagocytes through G protein-coupled receptors known as formyl peptide receptors (FPR) [1]. FPR1 was the first FPR cloned and encodes a high-affinity receptor for fMLF [2]. Subsequently, it was found that two additional FPRs exist in humans, and these were originally designated as FPR-like 1 (FPRL1; 69% identity to FPR1) and FPR-like 2 (FPRL2; 56% identity to FPR1) [3–5]. Recently, the FPR nomenclature has been revised such that FPRL1 and FPRL2 are now designated as FPR2 and FPR3, respectively [6].
Compared to FPR1, FPR2 exhibits a high level of ligand promiscuity and is activated by numerous chemically unrelated ligands, including synthetic peptides, pathogen-derived peptides, host-derived peptides, and lipids [reviewed in [6]]. In addition to natural peptides and endogenous arachidonic acid metabolites, novel synthetic peptides and several small-molecule non-peptide agonists of FPR1 and FPR2 have recently been reported [7–11]. Indeed, the identification and development of small-molecule ligands represents an ideal approach to analyze FPR structure and function, since such molecules are well defined and can be easily modified for structure-activity relationship (SAR) analysis. Small-molecule agonists can also have advantages over peptides or proteins as potential therapeutics, and they can provide a basis for construction of useful pharmacophore models of FPR1/FPR2 agonists.
Our analysis of novel small-molecule agonists of FPRs showed that individual ring substituents had a significant impact on FPR1/FPR2 agonist activity [12], suggesting that further structure–activity analysis of known FPR agonists could lead to optimization of these lead compounds and identification of improved agonists. In fact, SAR and quantitative SAR (QSAR) models have been instrumental in understanding the molecular mechanism of action of receptor agonists and antagonists, directing their design, and facilitating virtual screening [13–15].
To date, non-computational SAR analysis has been performed for FPR2 agonists with a benzimidazole scaffold [16], FPR1/FPR2 agonists with a pyridazin-3(2H)-one scaffold [17], and pyrazolone-derived FPR2 agonists [9]; however, there are currently no reported computational SAR models for non-peptide FPR1/FPR2 agonists.
Here, we used computational SAR analysis of a large group of FPR1/FPR2 agonists and their non-active analogs. The SAR rules obtained from classification tree analysis, which was based on six atom pair descriptors only, revealed key features that distinguished FPR1 and FPR2 agonists. These studies provide further virtual screening of FPR1/FPR2 agonists and also provide clues to the molecular features required for agonist activity. This is the first application of an atom pair-based approach to a set of FPR agonists with various scaffolds and their analogs.
2. Results and discussion
2.1. Atom pairs and their one-way ANOVA selection
While a variety of molecular parameters can be used in the computational methods for (Q)SAR analysis [18,19], some of these parameters are complex physicochemical or geometrical 3D descriptors whose calculation is associated with difficulties conditioned by molecular flexibility and adequate sampling of conformational space. Conversely, topological indices, or 2D descriptors, obtainable from the structural formula of a compound are very attractive because of their simplicity. A reasonable compromise between ease of interpretation and ease of computation was reported by Carhart et al. [20], who introduced atom pair descriptors as features of the environments of all atoms in the 2D representation of a chemical structure. This approach has been widely used in the context of fragment-based similarity searches and database mining [21–25]. Here, we applied atom pair descriptors to represent the selected molecules. The use of an atom type naming scheme from MM+ force field, as implemented in HyperChem software, is a significant feature of our approach, as it represents more sophisticated atom typing than used in previous studies [20]. This scheme assigns specific names to a given atom, depending on its surroundings in a molecule.
The 2D structures of 71 compounds (training set) that included 10 FPR1-specific agonists, 36 FPR2-specific agonists, and 25 non-active compounds (Table 1, see Materials and Methods) represented as a set of HIN files were used by our CHAIN program to generate a table of atom pairs. This program, which finds all possible paths between labeled atoms in a molecular structure, identified 726 unique atom pairs among the 71 compounds. Hence, a matrix consisting of 71 lines and 726 columns was generated, with each line containing the number of times a given atom pair was present in each molecule. Since this number of columns is too large for SAR analysis, we performed a step-by step selection of atom pairs to reduce the matrix size. This sequence of steps included one-way ANOVA, linear discriminant analysis, and binary classification tree analysis. These methodologies have a high applicability for variable pre-screening in SAR [26–28] and were also used successfully in our previous studies [22,23].
Table 1.
Structure and receptor specificity of compounds under investigation
| A. Compounds with 2-(benzimidazol-2-ylthio)-N-phenylacetamide scaffold [from [12]]. | |||
|---|---|---|---|
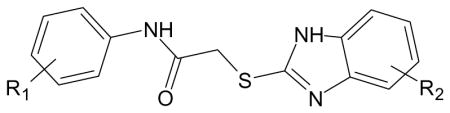 | |||
| Compound | R1 | R2 | Specificity |
| AG-09/1 | 4-NO2 | 5-OMe | FPR1 |
| AG-09/2 | 4-OEt | 5-OMe | FPR1 |
| AG-09/11 | H | H | N.A. |
| AG-09/13 | 4-OMe | 5-OEt | FPR1 |
| AG-09/17 | 3,4-diOMe | 5-OMe | FPR1/FPR2 |
| AG-09/18 | H | 5-OMe | FPR1 |
| AG-09/19 | 3-OMe | 5-OMe | FPR1 |
| AG-09/20 | 4-Cl | 5-OMe | FPR1/FPR2 |
| AG-09/21 | 4-Br | 5-OMe | FPR1 |
| AG-09/22 | 2-OMe | 5-OMe | FPR1/FPR2 |
| AG-09/25 | 3-Br | H | N.A. |
| AG-09/26 | 3-NO2, 4-Cl | 4-Me | N.A. |
| AG-09/28 | 4-NO2 | H | N.A. |
| AG-09/30 | 3-CF3 | 5-Me | N.A. |
| B. Compounds with N-phenethyl-N′-phenylurea scaffold [from [12]]. | |||
|---|---|---|---|
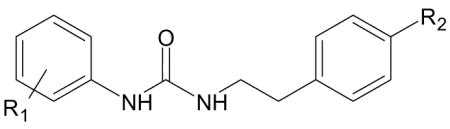 | |||
| Compound | R1 | R2 | Specificity |
| AG-26 | 4-Cl | OMe | FPR2 |
| AG-09/36 | H | H | N.A. |
| AG-09/37 | H | OMe | FPR2 |
| AG-09/38 | 4-F | OMe | FPR2 |
| AG-09/41 | 2,4-diCl | OMe | N.A. |
| AG-09/42 | 4-Br | OMe | FPR2 |
| AG-09/45 | 4-F | Me | N.A. |
| AG-09/52 | 2-NO2 | Cl | N.A. |
| AG-09/54 | 3-Me | Cl | N.A. |
| C. Compounds with piperazine scaffold [from [12]]. | |||
|---|---|---|---|
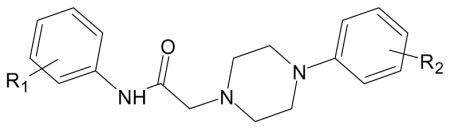 | |||
| Compound | R1 | R2 | Specificity |
| AG-09/03 | 4-Br | 4-F | FPR2 |
| AG-09/04 | 4-Br | 3-Cl | FPR2 |
| AG-09/55 | H | H | N.A. |
| AG-09/56 | H | 2-Cl | N.A. |
| AG-09/64 | 3-Cl,4-F | H | N.A. |
| AG-09/71 | 2-Br | H | N.A. |
| AG-09/72 | 3-Br | H | N.A. |
| AG-09/73 | 4-Br | H | FPR2 |
| AG-09/74 | 4-Br | 4-Cl | FPR2 |
| AG-09/75 | 4-Br | 3-Cl, 4-Me | FPR2 |
| AG-09/76 | 4-Br | 2-Me, 3-Cl | FPR2 |
| AG-09/77 | 4-Br | 2-Me, 5-Cl | FPR2 |
| AG-09/82 | 4-Br | 3-OMe | FPR2 |
| AG-09/91 | 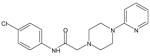 |
N.A. | |
| D. Compounds with acetohydrazide scaffold [from [12]]. | |||
|---|---|---|---|
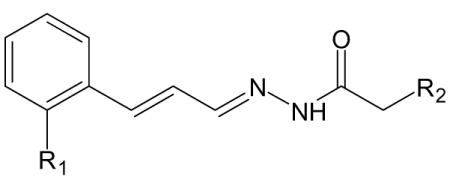 | |||
| Compound | R1 | R2 | Specificity |
| AG-09/92 | NO2 |  |
FPR2 |
| AG-09/93 | NO2 |  |
FPR2 |
| AG-09/95 | NO2 |  |
N.A. |
| AG-09/96 | NO2 |  |
FPR2 |
| AG-09/97 | NO2 |  |
N.A. |
| AG-09/99 | OMe |  |
N.A. |
| AG-09/101 | FPR2 | ||
| AG-09/102 |  |
N.A. | |
| AG-09/7 | 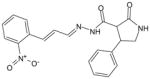 |
FPR2 | |
| E. Specific FPR2 agonists with 1-(2-indolylcarbonyl)-4-(1-benzimidazolyl)piperidine scaffolds [from [16]]. | ||
|---|---|---|
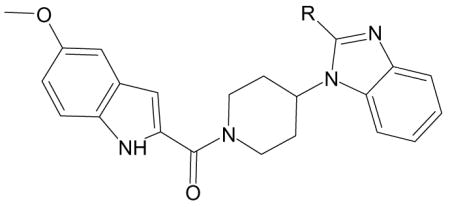 | ||
| Compound | R | Specificity |
| F-5 | Me | FPR2 |
| F-6 | Et | FPR2 |
| F-7 | iBu | FPR2 |
| F-8 | CF3 | FPR2 |
| F-9 | Ph | FPR2 |
| F. Specific FPR2 agonists with pyrazolone scaffold [from [9,31]]. | |||
|---|---|---|---|
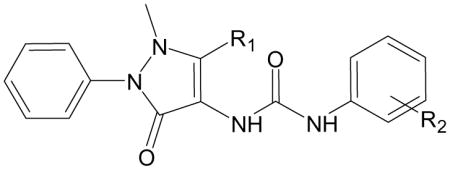 | |||
| Compound | R1 | R2 | Specificity |
| B-25 | Me | 4-Br | FPR2 |
| B-35 | Me | 4-SMe | FPR2 |
| B-42 | Et | 4-Cl | FPR2 |
| B-43 | iPro | 4-Cl | FPR1/FPR2 |
| G. Specific FPR2 agonists with 1-(2-indolylcarbonyl)-3-(1-benzimidazolyl)pyrrolidine and related scaffolds [from [16]]. | |||
|---|---|---|---|
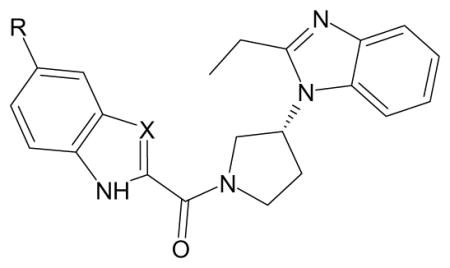 | |||
| Compound | R | X | Specificity |
| F-10 | OMe | CH | FPR2 |
| F-13 | F | CH | FPR2 |
| F-14 | Cl | CH | FPR2 |
| F-15 | Br | CH | FPR2 |
| F-16 | OCF3 | CH | FPR2 |
| F-17 | Et | CH | FPR2 |
| F-18 | OMe | N | FPR2 |
| H. Compounds with 4-benzylpyridazin-3-one scaffold [from [17]]. | |||
|---|---|---|---|
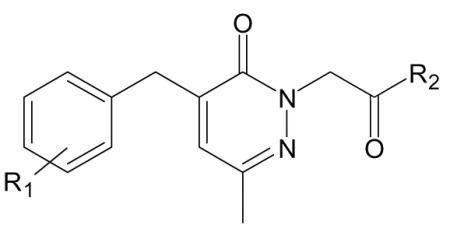 | |||
| Compound | R1 | R2 | Specificity |
| C-14a | 3-OMe | NH-C6H4-Br (p) | FPR1/FPR2 |
| C-14b | 3-OMe | NH-C6H4-Br (m) | N.A. |
| C-14e | 3-OMe | NH-C6H4-I (p) | FPR1/FPR2 |
| C-14f | 3-OMe | NH-C6H4-F (p) | FPR1 |
| C-14h | 3-OMe | NH-C6H4-CH3 (p) | FPR1/FPR2 |
| C-14m | 3-OMe | 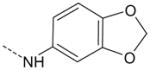 |
FPR1 |
| C-14n | 3-OMe | NH-C6H4-CF3 (p) | FPR1/FPR2 |
| C-14r | 3-OMe | N(CH3)-C6H4-Br (p) | N.A. |
| C-14x | 4-OMe | NH-C6H4-Br (p) | FPR2 |
| C-6c | 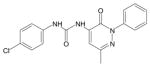 |
N.A. | |
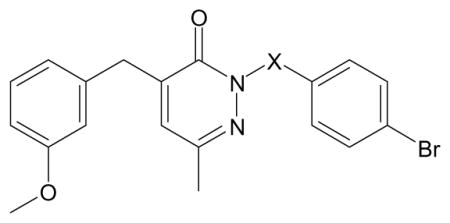 | ||
|---|---|---|
| Compound | X | Specificity |
| C-17b | CH(CH3)CONH | FPR1 |
| C-18a | CH2 | N.A. |
| C-23 | (CH2)2NH | N.A. |
| I. Structures of other FPR1/FPR2 agonists. | ||
|---|---|---|
| Compound | Structure | Specificity |
| AG-14 | FPR111 | |
| AG-22 | FPR1/FPR212 | |
| AG-09/5 | 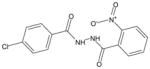 |
FPR212 |
| AG-09/6 | FPR212 | |
| AG-09/8 | 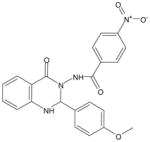 |
FPR212 |
| AG-09/9 | 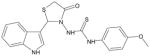 |
FPR1/FPR212 |
| AG-09/10 | 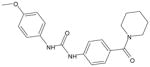 |
FPR1/FPR212 |
| Quin-C1 | 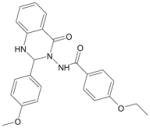 |
FPR27 |
| S-1 | FPR211 | |
| S-2 | FPR211 | |
| 1910-5441 | 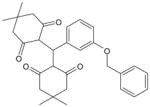 |
FPR18 (activity for FPR2 is unknown) |
| fMLF | 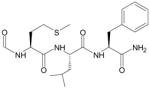 |
FPR1/FPR217 |
| WKYMVm | 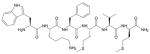 |
FPR1/FPR217 |
For the first selection step, we applied one-way analysis of variance (ANOVA) [29] to select descriptors with significant differences between total and within-class variances. As a result of ANOVA selection, 565 descriptors were filtered out, while the remaining 161 significant atom pairs were retained for further analysis. It is reasonable to compare the distribution of initial and ANOVA-selected descriptors in terms of bond separation (i.e., the number of bonds between atoms in a given atom pair). It should be noted that the relative distribution of initial and ANOVA-selected descriptors, in terms of bond separation, was similar (Figure 1). Although a greater proportion of the original atom pairs was retained after ANOVA selection for pairs with the largest bond separation (i.e., 17–18 bonds), these atom pairs are rare in the data set and have negligible statistical impact on the total SAR analysis. Since the relative distribution of atom pairs by bond separation was not changed after ANOVA, it appears that molecular shape peculiarities do not have a major influence on biological activity of these FPR agonists. In contrast, the dumb-bell shape common to inducers of macrophage tumor necrosis factor-α production led to a significantly higher fraction of “longer” atom pairs among ANOVA-selected descriptors [23].
Figure 1.

Comparison of initial and ANOVA-selected atom pairs in compounds 1-71. The numbers are shown for each of the indicated bond separations initially generated for 71 compounds from Table 1 (light bars). Atom pairs subsequently selected by ANOVA as having significant differences between the three classes of compounds (FPR1 agonists, FPR2 agonists, and non-active compounds) are shown in dark bars.
2.2. Cluster and linear discriminant analyses
The second step of variable selection consisted of finding clusters of highly correlated descriptors. Subsequently a single variable from one cluster can be regarded as independent, whereas the other dependent descriptors of such a cluster can be excluded from further calculations. Using the 161×161 matrix of correlation coefficients for atom pairs selected by ANOVA, we chose 28 clusters of variables (Table 2). Each variable is highly correlated (r≥0.9) with at least one variable from the same cluster. Descriptors with longer bond separations were taken as representative variables (shown in bold italic in Table 2). Hence, instead of 102 atom pairs included in Table 2, only 28 atom pairs were retained. These variables were combined with the 59 remaining atom pairs that were not highly correlated, resulting in a set of 87 atom pair descriptors selected for further calculations.
Table 2.
Clusters of highly correlated atom pairs (r≥0.9)
| Cluster | Atom pairs |
|---|---|
| 1 | C3_1_NA, N2_1_NA, C3_2_NA, C4_2_NA, CO_2_NA, C3_3_NA, NA_3_O1, CA_5_NA, C3_6_O2, CA_6_NA, C3_7_O2, CA_7_NA, CA_8_NA |
| 2 | C3_1_S2, C4_1_S2, CO_2_S2, N2_2_S2, CA_3_S2, N2_3_S2, O1_3_S2, CA_4_S2, CA_5_S2, CA_6_S2, CA_7_S2 |
| 3 | C4_1_C4, C4_2_N2, C4_4_CA, C4_4_N2, C4_5_CA, C4_5_N2, C4_6_CA, C4_7_CA |
| 4 | C4_1_CO, C4_2_O1 |
| 5 | C4_1_O2, CA_1_O2, CA_2_O2, CA_3_O2, CA_4_O2 |
| 6 | C4_2_C4, C4_3_C4 |
| 7 | CO_2_N2, N2_3_O1 |
| 8 | C4_3_CO, C4_4_O1 |
| 9 | C3_4_C4, C3_5_C4, C3_8_N2 |
| 10 | CO_4_N2, N2_5_O1 |
| 11 | CO_4_O2, CA_5_O2, O1_5_O2, CA_6_O2, O2_11_O2, CA_12_CO, O2_12_O2, CA_13_CO, CA_17_CA, CA_17_O2, C4_18_CA, CA_18_O2 |
| 12 | C4_5_CO, C4_6_O1 |
| 13 | CO_5_O2, O1_6_O2 |
| 14 | BR_6_CO, BR_7_O1 |
| 15 | C3_6_CO, C3_7_O1 |
| 16 | CO_6_N2, N2_8_N2 |
| 17 | CO_6_O2, O1_7_O2 |
| 18 | O2_6_S2, C4_7_S2 |
| 19 | BR_8_N3, BR_10_C4, BR_11_N2 |
| 20 | CO_8_O2, O1_9_O2 |
| 21 | F_8_N2, CO_9_F, F_9_NA, F_10_O1, F_15_O2, C4_16_F |
| 22 | NA_8_O2, C4_9_NA |
| 23 | O2_8_S2, C4_9_S2, C4_17_C4 |
| 24 | C4_9_O2, C4_10_C4 |
| 25 | CO_9_O2, O1_10_O2 |
| 26 | N2_9_O2, C4_10_N2 |
| 27 | O2_14_O2, C4_16_O2 |
| 28 | C4_15_O2, C4_16_C4 |
Atom pairs with longer bond separations are indicated in bold italic.
The high correlation coefficient between values of descriptors implies that these atom pairs are simultaneously present in most compounds in the data set. This usually occurs when atom pairs are produced by certain molecular features or scaffolds. The features may be very simple. For example, Cluster 14 descriptor BR_6_CO corresponds to the presence of a bromine atom and carbonyl carbon separated by 6 bonds. The same substructure also contains another atom pair from this cluster (BR_7_O1) corresponding to a carbonyl oxygen and bromine separated by 7 chemical bonds. More populated sets of correlated descriptors are produced by multi-atomic scaffolds. For instance, 11 descriptors of Cluster 2 originate from the 2-(benzimidazol-2-ylsulfanyl)-N-phenylacetamide scaffold common to compound AG-09/25 and its analogs. Thus, clustering atom pairs according to their mutual correlation not only decreases the number of variables but also provides a rational way to interpret SAR results in terms of chemical features and building blocks, which are much more complex than the atom pairs themselves. It should be noted that lowering the correlation coefficient threshold from 0.9 to 0.8 gave rather heterogeneous clusters of correlated descriptors usually not associated with distinct chemical substructures. Although the composition of several clusters remained the same, some were condensed to larger clusters at r≥0.8 by inclusion of additional atom pair descriptors (Figure 2). On the other hand, the adopted threshold of 0.9 for correlation between a given variable and at least one variable from the same cluster provides high mutual correlation of all variables in this cluster. For example, each pair of descriptors among the 13 variables of Cluster 1 (Table 2) is characterized by an r value greater than 0.85.
Figure 2.

Schematic representation of clusters obtained at different correlation coefficient thresholds. Values in black circles correspond to the enumeration of clusters at r≥0.9 (Table 2). Red circles show clusters obtained at r≥0.8. The number of blue dots is equal to the number of additional atom pairs that were not clustered at r≥0.9 but were included in the clusters at r≥0.8.
The 87 atom pairs selected after the two steps described above were used as an input variable set for linear discriminant analysis (LDA). The LDA procedure was applied with the option of “forward stepwise” inclusion of variables, as implemented in STATISTICA 6.0 software. The descriptors were added to the model if their inclusion led to a significant improvement in classification (p<0.05). We found that 17 of the 87 atom pairs were sufficient for good LDA classification of agonists, with 68 of the 71 compounds (95.8%) classified correctly as FPR1, FPR2, or NA (Figure 3A).
Figure 3.

Classification results of linear discriminant analysis (LDA) (Panel A) and binary classification tree analysis (Panel B) versus experimental classes of compounds investigated. The LDA was based on either 17 or 9 atom pairs from the best subset, and binary classification tree analysis was based on 6 atom pairs.
The LDA model with 17 atom pairs derived on the third step of variable selection was further simplified after an additional run of LDA with the “best subset search” option. The number of atom pair descriptors was decreased from 17 to 9 without loss of quality of the model (accuracy was the same using either 17 or 9 descriptors). This relatively simple LDA model obtained on the fourth step of variable selection can be expressed by the following three classification functions:
| (1) |
| (2) |
| (3) |
The number of corresponding atom pairs in a given compound should be used as values of descriptors for calculation of functions (1–3). One of the classes (FPR1, FPR2, or NA) is then attributed to the compound according to the maximum value among these functions.
Table 3 contains calculated classes and results of leave-one-out (LOO) prediction for the entire series of compounds. All three compounds with incorrectly calculated classes (AG-09/41, AG-09/95, and AG-09/102) were inactive, while the LDA model (1–3) and LOO prediction classified them as having FPR2 activity. LOO cross-validation correctly classified 63 of 71 compounds (88.7% accuracy). This can be considered as good quality of prediction, taking into account that the model with 9 descriptors was derived based on 71 molecules in the training set. For the subset of FPR1 agonists, the fraction of correct LOO predictions was expectedly lower (70%) because of the relatively small number of compounds with FPR1 activity included in the series under investigation. This was conditioned by the low number of non-peptide FPR1-specific agonists reported in the literature.
Table 3.
Experimentally determined, SAR-calculated, and LOO-predicted classes of FPR1/FPR2 agonist activity for FPR1/FPR2 agonists and non-active compounds (training set) and their atom pairs used in binary classification tree analysis
| Compound | Determined | LDA | Binary Classification Tree | ||||||||
|---|---|---|---|---|---|---|---|---|---|---|---|
| Calculated | LOO-predicted | CA_12_O2 | C4_6_C4 | BR_6_C4 | BR_7_O1 | C3_9_CA | N2_3_O1 | Terminal Node | Calculated | ||
| AG-14 | FPR1 | FPR1 | FPR1 | 2 | 0 | 0 | 0 | 2 | 1 | 10 | FPR1 |
| AG-26 | FPR2 | FPR2 | FPR2 | 2 | 1 | 0 | 0 | 0 | 0 | 7 | FPR2 |
| AG-09/1 | FPR1 | FPR1 | FPR1 | 2 | 0 | 0 | 0 | 0 | 0 | 10 | FPR1 |
| AG-09/2 | FPR1 | FPR1 | FPR1 | 4 | 0 | 0 | 0 | 0 | 0 | 10 | FPR1 |
| AG-09/3 | FPR2 | FPR2 | FPR2 | 0 | 0 | 0 | 1 | 0 | 0 | 5 | FPR2 |
| AG-09/4 | FPR2 | FPR2 | FPR2 | 0 | 0 | 0 | 1 | 0 | 0 | 5 | FPR2 |
| AG-09/5 | FPR2 | FPR2 | FPR2 | 0 | 0 | 0 | 0 | 0 | 2 | 13 | FPR2 |
| AG-09/6 | FPR2 | FPR2 | FPR2 | 0 | 0 | 0 | 0 | 6 | 0 | 9 | FPR2 |
| AG-09/7 | FPR2 | FPR2 | FPR2 | 0 | 0 | 0 | 0 | 5 | 1 | 9 | FPR2 |
| AG-09/8 | FPR2 | FPR2 | FPR2 | 1 | 1 | 0 | 0 | 0 | 2 | 13 | FPR2 |
| AG-09/11 | NA | NA | NA | 0 | 0 | 0 | 0 | 0 | 0 | 12 | NA |
| AG-09/13 | FPR1 | FPR1 | FPR1 | 4 | 0 | 0 | 0 | 0 | 0 | 10 | FPR1 |
| AG-09/18 | FPR1 | FPR1 | FPR1 | 2 | 0 | 0 | 0 | 0 | 0 | 10 | FPR1 |
| AG-09/19 | FPR1 | FPR1 | FPR1 | 4 | 0 | 0 | 0 | 0 | 0 | 10 | FPR1 |
| AG-09/21 | FPR1 | FPR1 | FPR2 | 2 | 0 | 0 | 1 | 0 | 0 | 10 | FPR1 |
| AG-09/25 | NA | NA | NA | 0 | 0 | 1 | 0 | 0 | 0 | 12 | NA |
| AG-09/26 | NA | NA | NA | 0 | 1 | 0 | 0 | 0 | 0 | 12 | NA |
| AG-09/28 | NA | NA | NA | 0 | 0 | 0 | 0 | 0 | 0 | 12 | NA |
| AG-09/30 | NA | NA | NA | 0 | 1 | 0 | 0 | 0 | 0 | 12 | NA |
| AG-09/36 | NA | NA | NA | 0 | 0 | 0 | 0 | 0 | 0 | 12 | NA |
| AG-09/37 | FPR2 | FPR2 | FPR2 | 2 | 1 | 0 | 0 | 0 | 0 | 7 | FPR2 |
| AG-09/38 | FPR2 | FPR2 | FPR2 | 2 | 1 | 0 | 0 | 0 | 0 | 7 | FPR2 |
| AG-09/41 | NA | FPR2 | FPR2 | 2 | 1 | 0 | 0 | 0 | 0 | 7 | FPR2 |
| AG-09/42 | FPR2 | FPR2 | FPR2 | 2 | 1 | 0 | 1 | 0 | 0 | 7 | FPR2 |
| AG-09/45 | NA | NA | NA | 0 | 1 | 0 | 0 | 0 | 0 | 12 | NA |
| AG-09/52 | NA | NA | NA | 0 | 0 | 0 | 0 | 0 | 0 | 12 | NA |
| AG-09/54 | NA | NA | NA | 0 | 0 | 0 | 0 | 0 | 0 | 12 | NA |
| AG-09/55 | NA | NA | NA | 0 | 0 | 0 | 0 | 0 | 0 | 12 | NA |
| AG-09/56 | NA | NA | NA | 0 | 0 | 0 | 0 | 0 | 0 | 12 | NA |
| AG-09/64 | NA | NA | NA | 0 | 0 | 0 | 0 | 0 | 0 | 12 | NA |
| AG-09/71 | NA | NA | NA | 0 | 0 | 0 | 0 | 0 | 0 | 12 | NA |
| AG-09/72 | NA | NA | NA | 0 | 0 | 1 | 0 | 0 | 0 | 12 | NA |
| AG-09/73 | FPR2 | FPR2 | FPR2 | 0 | 0 | 0 | 1 | 0 | 0 | 5 | FPR2 |
| AG-09/74 | FPR2 | FPR2 | FPR2 | 0 | 0 | 0 | 1 | 0 | 0 | 5 | FPR2 |
| AG-09/75 | FPR2 | FPR2 | FPR2 | 0 | 2 | 0 | 1 | 0 | 0 | 5 | FPR2 |
| AG-09/76 | FPR2 | FPR2 | FPR2 | 0 | 0 | 0 | 1 | 0 | 0 | 5 | FPR2 |
| AG-09/77 | FPR2 | FPR2 | FPR2 | 0 | 0 | 0 | 1 | 0 | 0 | 5 | FPR2 |
| AG-09/82 | FPR2 | FPR2 | FPR2 | 2 | 2 | 0 | 1 | 0 | 0 | 7 | FPR2 |
| AG-09/91 | NA | NA | NA | 0 | 0 | 0 | 0 | 0 | 0 | 12 | NA |
| AG-09/92 | FPR2 | FPR2 | FPR1 | 3 | 1 | 0 | 0 | 3 | 1 | 7 | FPR2 |
| AG-09/93 | FPR2 | FPR2 | FPR2 | 0 | 0 | 0 | 1 | 3 | 1 | 5 | FPR2 |
| AG-09/95 | NA | FPR2 | FPR2 | 0 | 0 | 0 | 0 | 3 | 1 | 12 | NA |
| AG-09/96 | FPR2 | FPR2 | FPR2 | 0 | 0 | 0 | 0 | 5 | 2 | 9 | FPR2 |
| AG-09/97 | NA | NA | NA | 0 | 0 | 0 | 0 | 5 | 1 | 9 | FPR2 |
| AG-09/99 | NA | NA | NA | 0 | 0 | 0 | 0 | 3 | 1 | 12 | NA |
| AG-09/101 | FPR2 | FPR2 | FPR2 | 0 | 1 | 0 | 0 | 5 | 2 | 9 | FPR2 |
| AG-09/102 | NA | FPR2 | FPR2 | 0 | 0 | 0 | 0 | 5 | 1 | 9 | FPR2 |
| C-6c | NA | NA | NA | 0 | 0 | 0 | 0 | 1 | 1 | 12 | NA |
| C-14b | NA | NA | NA | 2 | 0 | 1 | 0 | 4 | 1 | 11 | NA |
| C-14f | FPR1 | FPR1 | FPR2 | 2 | 0 | 0 | 0 | 4 | 1 | 10 | FPR1 |
| C-14m | FPR1 | FPR1 | FPR1 | 5 | 0 | 0 | 0 | 4 | 1 | 10 | FPR1 |
| C-14r | NA | NA | FPR1 | 2 | 0 | 1 | 1 | 4 | 1 | 11 | NA |
| C-14x | FPR2 | FPR2 | FPR2 | 1 | 1 | 0 | 1 | 4 | 1 | 5 | FPR2 |
| C-17b | FPR1 | FPR1 | FPR2 | 2 | 0 | 0 | 1 | 4 | 1 | 10 | FPR1 |
| C-18a | NA | NA | NA | 1 | 0 | 0 | 0 | 0 | 0 | 12 | NA |
| C-23 | NA | NA | NA | 2 | 0 | 1 | 0 | 4 | 0 | 11 | NA |
| F-5 | FPR2 | FPR2 | FPR2 | 1 | 0 | 0 | 0 | 6 | 1 | 9 | FPR2 |
| F-6 | FPR2 | FPR2 | FPR2 | 1 | 2 | 0 | 0 | 6 | 1 | 9 | FPR2 |
| F-7 | FPR2 | FPR2 | FPR2 | 1 | 6 | 0 | 0 | 6 | 1 | 9 | FPR2 |
| F-8 | FPR2 | FPR2 | FPR2 | 1 | 0 | 0 | 0 | 6 | 1 | 9 | FPR2 |
| F-9 | FPR2 | FPR2 | FPR2 | 1 | 0 | 0 | 0 | 9 | 1 | 9 | FPR2 |
| F-10 | FPR2 | FPR2 | FPR2 | 2 | 1 | 0 | 0 | 5 | 1 | 7 | FPR2 |
| F-13 | FPR2 | FPR2 | FPR2 | 0 | 1 | 0 | 0 | 5 | 1 | 9 | FPR2 |
| F-14 | FPR2 | FPR2 | FPR2 | 0 | 1 | 0 | 0 | 5 | 1 | 9 | FPR2 |
| F-15 | FPR2 | FPR2 | FPR2 | 0 | 1 | 0 | 1 | 5 | 1 | 5 | FPR2 |
| F-16 | FPR2 | FPR2 | FPR2 | 2 | 1 | 0 | 0 | 5 | 1 | 7 | FPR2 |
| F-17 | FPR2 | FPR2 | FPR2 | 0 | 1 | 0 | 0 | 5 | 1 | 9 | FPR2 |
| F-18 | FPR2 | FPR2 | FPR2 | 2 | 1 | 0 | 0 | 3 | 2 | 7 | FPR2 |
| S-1 | FPR2 | FPR2 | FPR2 | 0 | 0 | 0 | 0 | 3 | 1 | 12 | NA |
| S-2 | FPR2 | FPR2 | FPR2 | 0 | 0 | 0 | 0 | 5 | 1 | 9 | FPR2 |
| Quin-C1 | FPR2 | FPR2 | FPR2 | 3 | 1 | 0 | 0 | 0 | 2 | 7 | FPR2 |
ND, not determined; NA, non active. Incorrect classifications or predictions are indicated in bold italic.
2.3. Classification tree analysis
Although the LDA model is good in terms of fitting and prediction, its use in practice is based on calculation of functions (1–3) and is difficult to interpret. It would be much better to find simple SAR rules which are intuitively understandable and expressed in natural “chemical” language. In recent studies, we exploited a binary classification tree approach to build logical SAR algorithms based on atom pairs for low-molecular weight inhibitors of human neutrophil elastase [22] and non-peptide inducers of TNF-α production [23]. In the present paper, we report the first application of the classification tree methodology based on atom pairs to SAR analysis of compounds with varying scaffolds. Indeed, a multi-scaffold training set would produce a SAR model that is more useful for subsequent virtual screening of potential FPR agonists.
The 9 descriptors involved in the best LDA model (Functions 1–3) were used as the starting variable set for the classification tree algorithm [30] implemented in STATISTICA 6.0. Deriving an optimal tree with cross-validation criteria represented the final stage of our step-by-step variable selection and resulted in a six-branched tree (Figure 4). Thus, 720 of the initial 726 descriptors were filtered out during the selection steps, and the remaining six atom pairs formed a basis for the formulation of simple, logical SAR. Despite the small number of retained variables, the model is characterized by good fitting (i.e., it correctly classified most of the compounds from the training set). Figure 3B shows that 67 of the 71 compounds (94.4%) were accurately recognized by the tree with respect to their activity classes. Three non-active compounds were misclassified as FPR2, while one FPR2 agonist was misclassified as non-active. Detailed information regarding the retained descriptors and terminal nodes of the tree responsible for classification of each compound are shown in Table 3. The low cross-validation cost (0.141) obtained for the model demonstrates the powerful predictive ability of the classification tree (see also the results below for applying this model to an external data set).
Figure 4.

Optimal classification tree for splitting compounds into activity classes. The number of compounds that entered each node is indicated. Terminal nodes correspond to the three activity classes: FPR1-specific agonists, FPR2-specific agonists, or non-active (N.A.).
Chemical substructures associated with branches in the classification tree are illustrated in Figure 5. The first branch evaluates molecules for the presence of two or more CA_12_O2 atom pairs. These atom pairs occur when bicoordinated ether oxygen atoms and a benzene ring are separated by 10 or 11 chemical bonds (see examples in Figure 5A and 5B). Molecules containing two or more of these atom pairs move to the right branch of the tree (24 of the 71 compounds evaluated), whereas molecules with less than two CA_12_O2 atom pairs moved to the left branch (47 of the 71 compounds) (see Figure 4).
Figure 5.

Examples of atom pair descriptors and their occurrences in structures of selected compounds under investigation. The indicated atom pairs are highlighted in red. Notation of atom types: CA – aromatic carbon; C3 – olefin-type or imino carbon; C4 – tetrahedral sp3-hybridized carbon; CO – carbonyl carbon; NA – pyridine nitrogen; N1 – nitrogen in nitro group; N2 – amino-, amido-, or imino-nitrogen; O1 – carbonyl or nitro oxygen; O2 – two-coordinated alcohol or ether-type oxygen; CL – chlorine; BR – bromine.
The first branch on the left evaluates molecules for the presence of BR_7_O1 atom pairs. BR_7_O1 and BR_6_CO are mutually correlated because they are found in compounds with a bromine atom and a carbonyl oxygen separated by 7 bonds (i.e., the topological distance of 6 chemical bonds falls between bromine and the carbonyl carbon atom) (see examples in Figure 5C and 5D). At this branch, molecules with one or more of these atom pairs are designated as FPR2 agonists. Otherwise, they are sent to the next branch associated with the C3_9_CA descriptor. According to the split condition, a compound is designated as an FPR2 agonist in terminal node 9 if it contains five or more C3_9_CA atom pairs. This occurs when several C3-type carbons (MM+ force field notation for sp2-hybridized carbon of non-benzene character) are present with simultaneous presence of an aromatic ring on the opposite side of a molecule (see examples in Figure 5E and 5F). In some molecules, the number of C3_9_CA atom pairs does not exceed 4, despite the occurrence of atoms with C3 and CA types (e.g., see C-14x in Figure 5C).
The final branch on the left evaluates remaining molecules for the presence of the N2_3_O1 atom pair, as well as the correlated CO_2_N2 atom pair, which falls within the N2_3_O1 structure (see Figure 5G and 5H). This branch is important for correct classification of FPR2 agonists AG-09/5 and AG-09/8 from the training set, since these compounds contain two N2_3_O1 atom pairs and pass to terminal node 13, while the other compounds with less than two N2_3_O1 atom pairs are classified as non-active in terminal node 12 (see Figure 4). Although it might be suggested that this split is not important and could be removed from the tree without significant loss of classification quality, its removal caused a noticeable increase in cross-validation cost from 0.141 to 0.254 for the truncated tree. Thus, such a simplification of the model is not statistically warranted. Moreover, chemical features associated with the N2_3_O1 atom pair were also important for correct classification of several compounds from the test set (see below).
Molecules with two or more CA_12_O2 atom pairs moved to the right branch of the classification tree. The first node of the right branch evaluates molecules for the presence of the C4_6_C4 descriptor, which corresponds to tetrahedral sp3-carbons separated by 6 bonds. Atom pairs of this type can be found in compounds with various scaffolds and is originated by two saturated hydrocarbon moieties located moderate distances from each other (examples are shown in Figure 5I and 5J). The final node in this branch evaluates molecules for the presence of the BR_6_C4 atom pair. This substructure is present in five non-active compounds, three of which contain an m-bromophenyl-acetamide fragment (C-14b, AG-09/25, and AG-09/72; see Figure 5K and 5L) and two others containing an N-alkyl-p-bromoaniline substructure (C-14r and C-23). These features can be used in the formulation of “chemical” rules for SAR analysis. For example, movement of bromine from the meta to the para position of the aromatic ring in a bromo-substituted phenyl-acetamide moiety transformed the non-active C-14b into the FPR1 agonist C-17b.
Atom pairs from the clusters of correlated variables (Table 2, Figure 2) did not dominate at the nodes of the classification tree, and only N2_3_O1 and BR_7_O1 were involved in the split rules. Additionally, large clusters produced by entire scaffolds did not participate at all in the classification tree. Thus, the classification process does not appear to be biased by large chemical substructures and, therefore, would be useful for evaluation of molecules with various types of chemical scaffolds.
The best approach to validate SAR and QSAR models is to apply them to an independent series of compounds. For this purpose, we evaluated a test set consisting of 17 FPR2-specific or mixed FPR1/FPR2 agonists (Table 4). A matrix of atom pairs was generated using CHAIN program, and six columns of the matrix which correspond to the descriptors important for SAR analysis were taken into account. Values of the 6 descriptors important for SAR analysis descriptors used in the classification tree are shown in Table 4 along with the classification results obtained using the binary tree and algorithm from Scheme 1. FPR2-specifc agonists B-25, B-35, and B-42 were correctly predicted as having FPR2 activity, while most of the mixed-type compounds were classified as either FPR1 (AG-09/9, AG-09/17, AG-09/20, AG-09/22, C-14a, C-14e, C-14h, and C-14n) or FPR2 (AG-22, B-25, B-35, B-42, fMLF, and WKYMVm) agonists. Two members of test set (AG-09/10 and 1910-5441) were misclassified as non-active. Note, however, that FPR1 agonist 1910-5441 has relatively lower activity (EC50 ~20 μM) [8] than the other agonists used in our computational SAR analyses. Although oligopeptides were not included in the training set, the peptides fMLF and WKYMVm from the test set were classified correctly as active compounds. Note that these two peptides possess common fragments, e.g. benzyl and 2-methylthioethyl groups. The recognition of molecules by FPRs can also be strongly determined by configuration of chiral centers; however, our atom pair approach does not currently account for molecular chirality and would require introduction of these variables as additional descriptors.
Table 4.
Experimentally determined and predicted classes of FPR1/FPR2 agonists from the test set and their atom pairs used in binary classification tree analysis
| Compound | Determined | CA_12_O2 | C4_6_C4 | BR_6_C4 | BR_7_O1 | C3_9_CA | N2_3_O1 | Terminal Node | Predicted |
|---|---|---|---|---|---|---|---|---|---|
| AG-22 | FPR1/FPR2 | 0 | 1 | 0 | 0 | 8 | 1 | 9 | FPR2 |
| AG-09/9 | FPR1/FPR2 | 2 | 0 | 0 | 0 | 3 | 1 | 10 | FPR1 |
| AG-09/10 | FPR1/FPR2 | 0 | 0 | 0 | 0 | 0 | 0 | 12 | NA |
| AG-09/17 | FPR1/FPR2 | 6 | 0 | 0 | 0 | 0 | 0 | 10 | FPR1 |
| AG-09/20 | FPR1/FPR2 | 2 | 0 | 0 | 0 | 0 | 0 | 10 | FPR1 |
| AG-09/22 | FPR1/FPR2 | 2 | 0 | 0 | 0 | 0 | 0 | 10 | FPR1 |
| B-25 | FPR2 | 0 | 0 | 0 | 1 | 0 | 2 | 5 | FPR2 |
| B-35 | FPR2 | 0 | 0 | 0 | 0 | 0 | 2 | 13 | FPR2 |
| B-42 | FPR2 | 0 | 0 | 0 | 0 | 0 | 2 | 13 | FPR2 |
| B-43 | FPR1/FPR2 | 0 | 0 | 0 | 0 | 0 | 2 | 13 | FPR2 |
| C-14a | FPR1/FPR2 | 2 | 0 | 0 | 1 | 4 | 1 | 10 | FPR1 |
| C-14e | FPR1/FPR2 | 2 | 0 | 0 | 0 | 4 | 1 | 10 | FPR1 |
| C-14h | FPR1/FPR2 | 2 | 0 | 0 | 0 | 4 | 1 | 10 | FPR1 |
| C-14n | FPR1/FPR2 | 2 | 0 | 0 | 0 | 4 | 1 | 10 | FPR1 |
| 1910-5441 | FPR1/ND | 0 | 10 | 0 | 0 | 0 | 0 | 12 | NA |
| fMLF | FPR1/FPR2 | 0 | 8 | 0 | 0 | 0 | 3 | 13 | FPR2 |
| WKYMVm | FPR1/FPR2 | 0 | 15 | 0 | 0 | 0 | 5 | 13 | FPR2 |
ND, not determined; NA, non active.
Our simplified SAR model is based on agonists of non-mixed (i.e., “pure” FPR1 or FPR2 agonists), while the test set contained mostly mixed-type compounds. Such a situation was conditioned by the absence of a substantial number of small molecule receptor-specific agonists with relatively high activity reported in the literature. Thus, the aim of this test set was primarily in evaluation of the model for its ability to distinguish active and inactive compounds. Obviously, further discovery of novel specific FPR1 and FPR2 agonists will allow us to expand both training and test sets in order to derive a model with enhanced predictive ability based on atom pair descriptors. On the other hand, we can predict scaffold “specific affinity” of mixed agonists for either FPR1 or FPR2 using this model. For example, mixed-type agonists C-14a, C-14e, C-14h, and C-14n [17] and AG-09/17, AG-09/20, and AG-09/22 [12] were classified by the model as FPR1 agonists, indicating that 4-benzylpyridazin-3-one and 2-(benzimidazol-2-ylthio)-N-phenylacetamide scaffolds have higher affinity for FPR1. By comparison, the pyrazolone scaffold (agonists B-25, B-35, B-42, and B-43) had higher affinity for FPR2. Note, however, that this feature requires the presence of specific agonists with such scaffolds in the training set.
3. Conclusion
Previously, high-throughput screening was used to select unique non-peptide agonists of FPR1 and FPR2 [7–12,16,17]. In the present study, we utilized atom pair descriptors for computational SAR analysis of most active FPR1/FPR2 agonists to further define the features of these molecules critical for agonist activity and to develop a simple, but accurate SAR model for predicting biological activity in future compound screening.
A sequence of ANOVA, cluster analysis, LDA, and classification tree analysis based on the atom pair descriptors led to the derivation of simple SAR rules, despite the large number of starting variables. The SAR rules obtained from classification tree analysis, which was based on six atom pair descriptors only, revealed that the FPR1 agonists in the series investigated could be characterized by simultaneous satisfying the following conditions: a) presence of a benzene ring and two-coordinated oxygen atoms separated by 10 or 11 bonds (Condition A); b) absence of sp3-carbon atoms separated by 6 bonds; and c) absence of m-bromophenyl-acetamide and N-alkyl-p-bromoaniline substructures. A compound can be classified as an FPR2 agonist if it does not match Condition A and satisfies one of the following statements: a) contains a bromine atom and a carbonyl oxygen separated by 7 bonds; b) at least three non-benzene sp2-carbons separated by 6 to 9 bonds from benzene ring(s), and at least two of these carbons separated by 7 or 8 bonds from benzene ring(s); or c) at least two N-acylhydrazine or α-aminoketone substructures are present. Another type of FPR2 agonist satisfies Condition A and contains sp3-carbon atoms separated by 6 bonds. To evaluate predictive ability of the method, we evaluated a test set of 17 FPR agonists. Most, including the two peptides fMLF and WKYMVm, were classified by the derived rules as active agonists. Thus, we provide here the first successful application of the classification tree methodology based on atom pairs for SAR analysis of FPR agonists with various scaffolds.
Good quality and high predictive ability of the SAR model, as well as simplicity and rapidity of calculations associated with the binary tree algorithm, suggest promise in using the classification tree model for large database mining and virtual screening of FPR agonists.
4. Experimental
4.1. Data sets
Training Set
The training set of 71 compounds contained 10 FPR1-specific agonists, 36 FPR2-specific agonists, and 25 non-active compounds, including 2-(benzimidazol-2-ylthio)-N-phenylacetamides, N-phenethyl-N′-phenylureas, piperazines, acetohydrazides, 1-(2-indolylcarbonyl)-4-(1-benzimidazolyl)piperidines, 4-benzylpyridazin-3-ones, arylcarboxylic acid hydrazides, 1-(2-indolylcarbonyl)-3-(1-benzimidazolyl)pyrrolidines and related scaffolds [7–11]. All selected agonists had EC50 values in the low micromolar range for their ability to induce intracellular calcium mobilization in cells (RBL-2H3 or HL-60) transfected with human FPR1 or FPR2. All active compounds were evaluated in wild-type cells to verify that the agonists were inactive in non-transfected cells. Names of compounds and their experimentally determined classes are shown in Table 3 (1st and 2nd columns). Structures of all training set compounds are shown in Table 1.
Test Set
The test set consisted of 17 compounds, including 11 compounds with mixed FPR1/FPR2 agonist activity [AG-22, AG-09/9, AG-09/10, AG-09/17, AG-09/20, AG-09/22, C-14a, C-14e, C-14h, C-14n [12], and B-43 [31]] and 3 FPR2-specific agonists (B-25, B-35, and B-42) [9]. Also included in the test set was 1910-5441, which has been shown to be an FPR1 agonist, although activity for FPR2 was not evaluated [8]. Finally, the test set included two peptide FPR agonists: fMLF and WKYMVm.
4.2. Structure encoding by atom pairs
For the derivation of SAR models, we used an atom pair representation of molecular structures. Each atom pair was denoted as T1_D_T2, where T1 and T2 are the types of atoms in the pair and D is bond separation, i.e. number of bonds in the shortest path between these atoms in the structural formula. As described previously [22,23], T1 and T2 were defined with symbolic codes used in HyperChem, Version 7 (Hypercube, Inc., Gainesville, FL) for atom type encoding within the MM+ force field. For example, CA, CO, and C4 codes were used for sp2-hybridized aromatic, carbonyl, and tetrahedral sp3-hybridized carbon atoms, respectively. This approach allows easy generation of atom pairs from the output file containing the molecular structure (HIN file) built by HyperChem. As atom pairs T1_D_T2 and T2_D_T1 are equivalent, we used a unified definition with lexicographic order of type substrings (i.e., with T1 ≤ T2).
All 726 unique atom pairs possible for non-hydrogen atoms in the 71 compounds of the training set were generated. This 71×726 data matrix was automatically built by our CHAIN program, based on HIN files created in HyperChem. A matrix element at the intersection of the ith row and jth column was equal to the jth atom pair occurrence in the ith molecule. A similar data matrix was calculated for the 17 compounds in the test set.
4.3. Data processing and derivation of SAR rules
The data matrix for the training set was used as an input for one-way ANOVA [29] implemented in STATISTICA 6.0. From 726 atom pairs, 161 descriptors were selected, which showed significant differences (p≤0.05) between total and within-class variances. These ANOVA-selected atom pairs were then clustered according to their mutual correlation. Each member of a cluster was tightly correlated (r≥0.9) with at least one descriptor from the same cluster. All but one variable in each of the 28 clusters were considered dependent and were discarded, while the remaining variable with the highest bond separation was taken as independent in a given cluster. These 28 atom pairs, together with the 59 non-clustered variables (total of 87 descriptors), formed the basis set for further analysis.
Derivation of SAR classification was then performed by the LDA method with the ‘Forward Stepwise’ option, using the corresponding module of STATISTICA 6.0. The statistical criterion for inclusion or exclusion of descriptors at each step was p≤0.05. The stepwise LDA allowed selection of 17 significant descriptors from 726 atom pairs generated initially. The LDA procedure was then repeated with the ‘Best Subset Search’ option on the basis of 17 variables selected in the first LDA run. The best subset consisted of just 9 atom pairs giving the least misclassification error in the LDA model. Starting from 9 variables of the best subset, we developed a binary classification tree model with univariate splits. The classification tree was built with STATISTICA 6.0 using estimated prior probabilities and equal misclassification costs for classes [30,32]. An exhaustive classification and regression tree-style univariate split selection method was used, as described by Breiman et al. [30].
Acknowledgments
This work was supported in part by National Institutes of Health grant P20 RR-020185, National Institutes of Health contract HHSN266200400009C, an equipment grant from the M.J. Murdock Charitable Trust, and the Montana State University Agricultural Experimental Station.
Footnotes
Publisher's Disclaimer: This is a PDF file of an unedited manuscript that has been accepted for publication. As a service to our customers we are providing this early version of the manuscript. The manuscript will undergo copyediting, typesetting, and review of the resulting proof before it is published in its final citable form. Please note that during the production process errors may be discovered which could affect the content, and all legal disclaimers that apply to the journal pertain.
Reference List
- 1.Le Y, Murphy PM, Wang JM. Trends Immunol. 2002;23:541–548. doi: 10.1016/s1471-4906(02)02316-5. [DOI] [PubMed] [Google Scholar]
- 2.Boulay F, Tardiff M, Brouchon L, Vignais P. Biochemistry. 1990;29:11123–11133. doi: 10.1021/bi00502a016. [DOI] [PubMed] [Google Scholar]
- 3.Ye RD, Cavanagh SL, Quehenberger O, Prossnitz ER, Cochrane CG. Biochem Biophys Res Commun. 1992;184:582–589. doi: 10.1016/0006-291x(92)90629-y. [DOI] [PubMed] [Google Scholar]
- 4.Murphy PM, Ozcelik T, Kenney RT, Tiffany HL, McDermott D, Francke U. J Biol Chem. 1992;267:7637–7643. [PubMed] [Google Scholar]
- 5.Bao L, Gerard NP, Eddy RL, Jr, Shows TB, Gerard C. Genomics. 1992;13:437–440. doi: 10.1016/0888-7543(92)90265-t. [DOI] [PubMed] [Google Scholar]
- 6.Ye RD, Boulay F, Wang JM, Dahlgren C, Gerard C, Parmentier M, Serhan CN, Murphy PM. Pharmacol Rev. 2009;61:119–161. doi: 10.1124/pr.109.001578. [DOI] [PMC free article] [PubMed] [Google Scholar]
- 7.Nanamori M, Cheng X, Mei J, Sang H, Xuan Y, Zhou C, Wang MW, Ye RD. Mol Pharm. 2004;66:1213–1222. doi: 10.1124/mol.104.004309. [DOI] [PubMed] [Google Scholar]
- 8.Edwards BS, Bologa C, Young SM, Balakin KV, Prossnitz ER, Savchuck NP, Sklar LA, Oprea TI. Mol Pharm. 2005;68:1301–1310. doi: 10.1124/mol.105.014068. [DOI] [PubMed] [Google Scholar]
- 9.Bürli RW, Xu H, Zou X, Muller K, Golden J, Frohn M, Adlam M, Plant MH, Wong M, McElvain M, Regal K, Viswanadhan VN, Tagari P, Hungate R. Bioorg Med Chem Lett. 2006;16:3713–3718. doi: 10.1016/j.bmcl.2006.04.068. [DOI] [PubMed] [Google Scholar]
- 10.Schepetkin IA, Kirpotina LN, Khlebnikov AI, Quinn MT. Mol Pharm. 2007;71:1061–1074. doi: 10.1124/mol.106.033100. [DOI] [PubMed] [Google Scholar]
- 11.Schepetkin IA, Kirpotina LN, Tian J, Khlebnikov AI, Ye RD, Quinn MT. Mol Pharm. 2008;74:392–402. doi: 10.1124/mol.108.046946. [DOI] [PMC free article] [PubMed] [Google Scholar]
- 12.Kirpotina LN, Khlebnikov AI, Schepetkin IA, Ye RD, Rabiet MJ, Jutila MA, Quinn MT. Mol Pharmacol. 2010;77:159–170. doi: 10.1124/mol.109.060673. [DOI] [PMC free article] [PubMed] [Google Scholar]
- 13.Tong W, Welsh WJ, Shi L, Fang H, Perkins R. Environ Toxicol Chem. 2003;22:1680–1695. doi: 10.1897/01-198. [DOI] [PubMed] [Google Scholar]
- 14.Andricopulo AD, Montanari CA. Mini Rev Med Chem. 2005;5:585–593. doi: 10.2174/1389557054023224. [DOI] [PubMed] [Google Scholar]
- 15.Helguera AM, Combes RD, Gonzalez MP, Cordeiro MN. Curr Top Med Chem. 2008;8:1628–1655. doi: 10.2174/156802608786786598. [DOI] [PubMed] [Google Scholar]
- 16.Frohn M, Xu H, Zou X, Chang C, McElvaine M, Plant MH, Wong M, Tagari P, Hungate R, Bürli RW. Bioorg Med Chem. 2007;17:6633–6637. doi: 10.1016/j.bmcl.2007.09.043. [DOI] [PubMed] [Google Scholar]
- 17.Cilibrizzi A, Quinn MT, Kirpotina LN, Schepetkin IA, Holderness J, Ye RD, Rabiet MJ, Biancalani C, Cesari N, Graziano A, Vergelli C, Pieretti S, Dal P, Giovannoni VMP. J Med Chem. 2009;52:5054–5057. doi: 10.1021/jm900592h. [DOI] [PMC free article] [PubMed] [Google Scholar]
- 18.Buttingsrud B, Ryeng E, King RD, Alsberg BK. J Comput Aided Mol Des. 2006;20:361–373. doi: 10.1007/s10822-006-9058-y. [DOI] [PubMed] [Google Scholar]
- 19.Gute BD, Basak SC. SAR QSAR Environ Res. 2006;17:37–51. doi: 10.1080/10659360600560933. [DOI] [PubMed] [Google Scholar]
- 20.Carhart RE, Smith DH, Venkataraghavan R. J Chem Inf Comput Sci. 1985;25:64–73. [Google Scholar]
- 21.Plewczynski D, von GM, Spieser SA, Rychlewski L, Wyrwicz LS, Ginalski K, Koch U. Comb Chem High Throughput Screen. 2007;10:189–196. doi: 10.2174/138620707780126705. [DOI] [PubMed] [Google Scholar]
- 22.Khlebnikov AI, Schepetkin IA, Quinn MT. Bioorg Med Chem. 2008;16:2791–2802. doi: 10.1016/j.bmc.2008.01.014. [DOI] [PMC free article] [PubMed] [Google Scholar]
- 23.Khlebnikov AI, Schepetkin IA, Kirpotina LN, Quinn MT. Bioorg Med Chem. 2008;16:9302–9312. doi: 10.1016/j.bmc.2008.08.078. [DOI] [PMC free article] [PubMed] [Google Scholar]
- 24.Perez-Nueno VI, Rabal O, Borrell JI, Teixido J. J Chem Inf Model. 2009;49:1245–1260. doi: 10.1021/ci900043r. [DOI] [PubMed] [Google Scholar]
- 25.Yu N, Bakken GA. J Chem Inf Model. 2009;49:745–755. doi: 10.1021/ci800392z. [DOI] [PubMed] [Google Scholar]
- 26.Yan SF, King FJ, He Y, Caldwell JS, Zhou Y. J Chem Inf Model. 2006;46:2381–2395. doi: 10.1021/ci060102u. [DOI] [PubMed] [Google Scholar]
- 27.Li J, Liu H, Yao X, Liu M, Hu Z, Fan B. Anal Chim Acta. 2007;581:333–342. doi: 10.1016/j.aca.2006.08.031. [DOI] [PubMed] [Google Scholar]
- 28.Roncaglioni A, Piclin N, Pintore M, Benfenati E. SAR QSAR Environ Res. 2008;19:697–733. doi: 10.1080/10629360802550606. [DOI] [PubMed] [Google Scholar]
- 29.Lindman HR. Analysis of variance in complex experimental designs. W.H. Freeman & Co; San Francisco: 1974. [Google Scholar]
- 30.Breiman L, Friedman JH, Olshen RA, Stone CJ. Classification and regression trees. Wadsworth & Brooks/Cole Advanced Books & Software; Monterey, CA: 1984. [Google Scholar]
- 31.Sogawa Y, Shimizugawa A, Ohyama T, Maeda H, Hirahara K. J Pharmacol Sci. 2009;111:317–321. doi: 10.1254/jphs.09196sc. [DOI] [PubMed] [Google Scholar]
- 32.Loh WY, Shih YS. Statistica Sinica. 1997;7:815–840. [Google Scholar]