

Abstract
Mammalian target of rapamycin (mTOR) is a serine/threonine kinase that regulates a variety of cellular functions such as growth, proliferation and autophagy. In a variety of cancer cells, overactivation of mTOR has been reported. In addition, mTOR inhibitors, such as rapamycin and its derivatives, are being evaluated in clinical trials as anticancer drugs. However, no active mutants of mTOR have been identified in human cancer. Here, we report that two different point mutations, S2215Y and R2505P, identified in human cancer genome database confer constitutive activation of mTOR signaling even under nutrient starvation conditions. S2215Y was identified in large intestine adenocarcinoma whereas R2505P was identified in renal cell carcinoma. mTOR complex 1 prepared from cells expressing the mutant mTOR after nutrient starvation still retains the activity to phosphorylate 4E-BP1 in vitro. The cells expressing the mTOR mutant show increased percentage of S-phase cells and exhibit resistance to cell size decrease by amino-acid starvation. The activated mutants are still sensitive to rapamycin. However, they show increased resistance to 1-butanol. Our study points to the idea that mTOR activating mutations can be identified in a wide range of human cancer.
Keywords: mTORC1, rapamycin, cancer genome database, kinase activity
The mammalian target of rapamycin (mTOR) signaling pathway has critical functions in protein synthesis, controlling cell size and cell-cycle progression in response to extracellular and intracellular stimuli, including insulin, nutrients and energy status (Wullschleger et al., 2006; Wang and Proud, 2009). Its effect on protein synthesis is mediated by the phosphorylation of S6K and 4E-BP1 and this is catalyzed by the mTOR complex 1 (mTORC1) that contains raptor, mLST8 in addition to mTOR. The second complex, mTORC2, contains rictor, mLST8 and sin1 and functions to phosphorylate Akt as well as to regulate actin cytoskeleton (Sabatini, 2006). Dysregulation of mTOR activity is correlated with several Hamartoma syndromes, including tuberous sclerosis complex, Cowden disease and Peutz–Jeghers syndromes. These genetic disorders are known to be caused by mutations in tumor-suppressor genes such as TSC1-TSC2, PTEN and LKB1 that negatively regulate mTOR (Inoki et al., 2005). Furthermore, activation of the mTOR signaling pathway has been reported in a variety of human cancer, including malignant melanoma and head and neck cancer (Guertin and Sabatini, 2007; Molinolo et al., 2007; Karbowniczek et al., 2008). The mTORC1 signaling is activated also in a majority of renal clear cell carcinomas (Robb et al., 2007). Rapamycin and its derivatives are being evaluated as an anticancer drug in clinical trials. In particular, temsirolimus (also known as CCI-779) is approved by the Food and Drug Administration for the treatment of patients with advanced renal cell carcinoma (Chiang and Abraham, 2007). Despite the importance of mTOR activation in human cancer, no activating mutations of mTOR have been identified in human cancer.
Previously, we have carried out random mutagenesis of fission yeast Tor2 (Urano et al., 2007) to identify single amino-acid changes that confer hyperactivation. This study identified 23 point mutations, any of which can confer hyperactive phenotypes to Tor2. Most mutations were clustered in and around the FAT and the kinase domain. Two representative mutations were selected and each was introduced into mTOR. Expression of the mTOR mutants led to constitutive activation of mTOR even after nutrient starvation (Urano et al., 2007). In addition to our study, Maeda and co-workers (Ohne et al., 2008) have shown that mutations in the FRB and kinase domain of mTOR, different from the ones identified in our study, lead to hyperactivation of mTOR. Thus, these studies provided a proof of principle that a single amino-acid substitution can convert mTOR to a constitutive active form.
To identify mTOR mutations in human cancer, we searched the sequence of the mTOR (MTOR) gene from a variety of human cancer samples in the COSMIC Library (Catalogue of Somatic Mutations in Cancer) provided by the Sanger Institute (http://www.sanger.ac.uk/genetics/CGP/cosmic/) in which a vast amount of information on somatic mutations in human cancers is stored. Ten mutations have been identified in the mTOR gene from 750 cancer samples derived from the following tissues: breast, central nervous system, hematopoietic and lymphoid tissue, kidney, large intestine, lung, ovary, pancreas, pleura, skin, stomach, testis, upper aerodigestive tract and urinary tract. Of the 10 mutations, 2 are silent mutations that do not change the amino-acid sequence. One of them generates a stop codon that produces a truncated mTOR protein that does not contain the kinase domain. A mutation M135T was identified twice. Six different amino-acid changes identified are shown in Figure 1. The types of cancer where the mutation was identified as well as COSMIC information are shown in Figure 1. Interestingly, we found a number of mutations in the C-terminal region that contains the kinase domain.
Figure 1.

Mammalian target of rapamycin (mTOR) mutations found in cancer genome. mTOR mutations were identified by searching the COSMIC Library (Catalogue of Somatic Mutations in Cancer) as described in text. The mTOR mutations identified in cancer genome are indicated above the linear representation of mTOR. The tissues where the mTOR mutations in cancer are identified are represented in parentheses. Cancer types and the COSMIC ID numbers of mTOR mutations are indicated at the bottom.
We were particularly interested in the mutations that are located within or close to the kinase domain. These mutations, S2215Y, P2476L and R2505P, as well as the A8S mutation at the N-terminal region were introduced into mTOR and their effects were examined. To carry out this experiment, we introduced the mutations into AU1-tagged mTOR and the activity was measured in HEK293T cells as described previously (Urano et al., 2007). As negative controls, we characterized the cells transfected with a vector as well as the cells transfected with a plasmid encoding AU1-tagged wild-type mTOR. As a positive control, E2419K, a mutation identified in our previous mutagenesis study (Urano et al., 2007) was used. After nutrient starvation, phosphorylation of mTOR substrates, S6K1 and 4E-BP1, was measured as an indication of mTOR activity. FLAG-tagged S6K1 was co-transfected. As can be seen in Figure 2a, phosphorylation of S6K1 was detected in the cells expressing the mTOR mutants, E2419K, S2215Y or R2505P. Conversely, phosphorylation of S6K1 was not detected in the cells transfected with the wild-type mTOR as well as with the A8S or P2476L mutant, although all AU1-mTOR were expressed at a similar level. Phosphorylation of 4E-BP1 was also increased by the expression of the E2419K, S2215Y or R2505P mutant but not in the cells transfected with the mutants A8S, P2476L, an empty vector or the wild-type mTOR (Figure 2b).
Figure 2.

mTORS2215Y and mTORR2505P cancer mutations confer constitutive activation of mTOR complex 1 (mTORC1) but not mTORC2. (a) Mutations in mTOR were introduced by two-step polymerase chain reaction (PCR) into pcDNA3-AU1-mTOR as described previously (Urano et al., 2007). HEK293T cells cultured in Dulbecco’s modified Eagle’s medium (DMEM) containing 10% fetal bovine serum (FBS) and 1 × penicillin/streptomycin at 37°C and 5% CO2 were co-transfected with either the empty vector (control) or pcDNA3 containing the indicated AU1-tagged mTOR together with pCMV5-FLAG-S6K1 by using Polyfect (Qiagen, Valencia, CA, USA) according to the manufacturer’s instructions. At 24 h after the transfection, the cells were cultured in DMEM supplemented with 0.1% bovine serum albumin (BSA) overnight and then incubated in Dulbecco’s modified phosphate-buffered saline (D-PBS) containing 1mM Mg2+ and Ca2+ (Invitrogen, Carlsbad, CA, USA) for 1 h to achieve nutrient starvation. The cells were lysed in 1 × SDS sample buffer by sonication at 4°C. The proteins were resolved by SDS–polyacrylamide gel electrophoresis (PAGE) and immunoblotted with anti-AU1 (Covance, Berkeley, CA, USA), anti-phospho-p70 S6 kinase (T389) (Cell Signaling Technology, Danvers, MA, USA) or anti-FLAG M2 (Sigma, St Louis, MO, USA) antibodies. (b) HEK293T cells were transfected with either the empty vector (control) or pcDNA3 containing the indicated AU1-tagged mTOR. Lysates of the nutrient-starved cells were divided into two aliquots. The first aliquot was heated at 95°C for 5 min, and the soluble heat-stable fractions were resolved by SDS–PAGE and immunoblotted with anti-phospho-4E-BP1 (T37/46) (Cell Signaling Technology) and then with anti-4E-BP1 (Cell Signaling Technology). The second aliquot was resolved by SDS–PAGE and then immunoblotted with anti-AU1. (c) HEK293T cells were co-transfected with either the empty vector (control) or with pcDNA3 containing the indicated AU1-tagged mTOR and pCMV-myc-Akt. After serum starvation, the cells were lysed as described in a. Proteins were immunoblotted with anti-AU1, anti-phospho-Akt (S473) (Cell Signaling Technology) or anti-Akt (Cell Signaling Technology).
As described earlier, mTOR forms two complexes, mTORC1 and mTORC2, and each complex is activated by distinct signaling pathways and transmits the signals to different substrates. mTORC1 phosphorylates S6K1 and 4E-BP1, and mTORC2 phosphorylates Akt. To examine whether the mTOR mutants affect mTORC2, we examined Akt phosphorylation by co-transfecting myc-Akt and examining Akt phosphorylation using anti-phospho-Akt antibody. As can be seen in Figure 2c, no significant increase of the phosphorylation of Akt was detected with the mTOR mutants. These results suggest that the cancer mTOR mutations confer activation of mTORC1 but not mTORC2. These results are similar to those we obtained with the mTOR mutants identified by random mutagenesis; the amino-acid changes cause selective activation of mTORC1 (Urano et al., 2007).
To further examine constitutive activation of mTOR by the cancer mutation, we focused on the S2215Y mutant and examined its kinase activity in vitro. AU1-tagged wild-type mTOR or the S2215Y mutant was transfected into HEK293T cells. We first tested whether the S2215Y mutant forms intact complexes with mTORC subunits by immunoprecipitating mTOR using anti-AU1 antibody. As seen in Figure 3a, similar amount of the wild-type and the S2215Y mutant mTOR was immunoprecipitated. Comparable amount of mTORC1-specific component, raptor, mTORC2-specific component, rictor, as well as mLST8 that is present in both mTORC1 and mTORC2 was detected both in the wild-type and S2215Y immunoprecipitates, suggesting that mTOR S2215Y forms intact mTORC1 and mTORC2. We next examined the kinase activity of mTORC1 and mTORC2 in vitro. After transfection, the cells were starved for serum and nutrients, and mTORC1 and mTORC2 were separately immunopurified by the use of anti-raptor and anti-rictor antibodies, respectively. Each immunoprecipitate was then mixed with 4E-BP1, which is an mTORC1 substrate, or Akt, which is an mTORC2 substrate, and kinase reaction was carried out. As shown in Figure 3b, phospho-4E-BP1 was detected strongly in the immunoprecipitates of the S2215Y mutant as well as of E2419K. Conversely, the wild-type mTOR exhibited minimal activity, as only a slight phosphorylation of 4E-BP1 was observed. The immunoprecipitates without AU1-mTOR (Control) also phosphorylated 4E-BP1 only slightly. We have also examined the R2505P mutation. Immunoprecipitates from cells expressing the mutant strongly phosphorylated 4E-BP1 (Supplementary Figure 1). These results show that the S2215Y and R2505P mutations confer constitutive mTORC1 activity. We next examined whether the S2215Y mutation also confers constitutive mTORC2 activity. As seen in Figure 3c, phospho-Akt was hardly detected in the rictor immunoprecipitates from the cells expressing the wild-type mTOR or the vector control. AU1-mTOR E2419K and S2215Y phosphorylated Akt but the amount of phospho-Akt was only slightly above that of the wild-type mTOR, suggesting that the mTOR S2215Y cancer mutant specifically activates mTORC1. These results are consistent with our in vivo findings (Figure 2). Recently, it has been established that GTP-bound Rheb G-protein is specifically required for the hyperactivation of the wild-type mTORC1, but not mTORC2, in vitro as well as in vivo (Sancak et al., 2007; Sato et al., 2009). Thus, the hyperactivation of mTORC1 by the mTOR cancer mutants S2215Y and R2505P mimics Rheb activation of mTORC1.
Figure 3.

mTORS2215Y increases the catalytic activity of mTOR complex 1 (mTORC1) but not mTORC2 in vitro. (a) HEK293T cells were transfected with either the empty vector (control) or pcDNA3-AU1-mTOR (wild type or S2215Y). Cell extracts were prepared from the serum and nutrient-starved cells and then immunoprecipitated with anti-AU1 antibody as described previously (Urano et al. 2007). Immunoprecipitates were detected by western blotting using anti-AU1, anti-raptor (Bethyl, Montgomery, TX, USA), anti-rictor (Bethyl), or anti-mLST8 (Bethyl) antibodies. (b, c) HEK293T cells transfected with either the empty vector (control) or pcDNA3-AU1-mTOR (wild type, E2419K or S2215Y) were subjected to serum starvation and nutrient starvation. mTORC1 was immunoprecipitated with anti-Raptor and used for the in vitro kinase assay using recombinant 4E-BP1, whereas mTORC2 was immunoprecipitated with anti-rictor antibody and used for the assay with Akt as described previously (Sato et al., 2009). After the reaction, the proteins were immunoblotted with the indicated antibodies.
To test whether the constitutive activation of mTOR by the cancer mutations affects cell-cycle control and cell size, we analyzed cell cycle and cell size using the cells expressing the mTOR S2215Y mutant. After transfecting the wild-type or the active mTOR mutant, the cells were starved for serum. The cellular DNA was labeled with propidium iodide and scanned by FACScan flow cytometer (Figure 4a). The percentage of cells in S phase was 28.2 ± 4.3% and that of cells in G0/G1 phase was 64.9 ± 3.5% in the cells expressing the wild-type mTOR. However, in the cells expressing the mTOR S2215Y mutant, the percentage of cells in S phase was substantially increased to 42.0 ± 0.7% with a concomitant decrease in the percentage of G0/G1 cells to 51.5 ± 3.1%. These results suggest that cell-cycle progression is affected by the expression of the mTOR active mutant. Forward scatter analysis was also carried out to examine alteration of cell size. In this experiment, HEK293T cells were transfected with the wild-type or the mutant S2215Y mTOR and then incubated with or without amino acids. As can be seen in Figure 4b, the size of cells expressing the mutant mTOR was significantly larger than that of the cells expressing the wild-type mTOR. In the presence of amino acids, no difference in cell size between the cells expressing the wild-type and mutant S2215Y mTOR was observed (data not shown). These results suggest that the expression of the mutant mTOR confers resistance to size decrease on amino-acid starvation.
Figure 4.
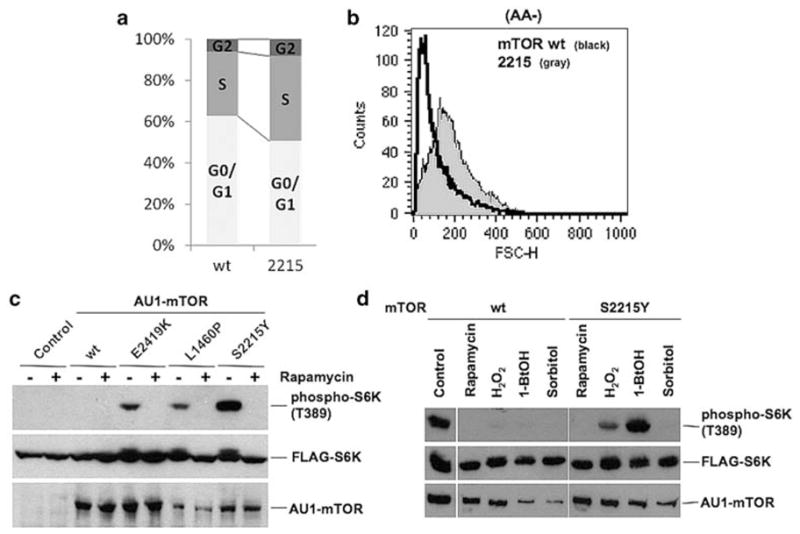
mTORS2215Y effects on cell cycle and cell size under nutrient starvation and sensitivity to rapamycin, osmotic stress and 1-butanol. (a) HEK293T cells transfected with pcDNA3-AU1-mTOR (wild type or S2215Y) were subjected to serum starvation. After trypsinization, the cells were washed twice with Dulbecco’s modified phosphate-buffered saline (D-PBS) and suspended in propidium iodide (PI) solution (0.1% sodium citrate, 0.3% Triton-X 100, 0.1 mg/ml PI, 20 mg/ml RNase A). The cells were immediately analyzed on a Becton Dickson FACScan (Becton Dickson, San Jose, CA, USA) for PI (cell cycle). (b) HEK293T cells transfected with pcDNA3-AU1-mTOR (wild type or S2215Y) were subjected to serum starvation and nutrient starvation. After trypsinization, the cells were washed twice with D-PBS and suspended in PI solution. The cells were immediately analyzed on a Becton Dickson FACScan for forward scatter (cell size). (c) HEK293T cells were co-transfected with either the empty vector (control) or pcDNA3 containing the indicated AU1-tagged mTOR together with pCMV5-FLAG-S6K. After serum starvation, the cells were cultured in D-PBS containing Mg2+ and Ca2+ in the presence or absence of 50 nM rapamycin (Calbiochem, San Diego, CA, USA) for 1 h. The proteins were resolved by SDS–PAGE and immunoblotted using indicated antibodies. (d) HEK293T cells co-transfected with pcDNA3-AU1-mTOR (wild type or S2215Y) and pCMV5-FLAG-S6K1 were serum-starved and then treated with 50 nM rapamycin, 1mM H2O2, 0.8% 1-butanol, 0.4M sorbitol or without reagent (control) in DMEM supplemented with 0.1% bovine serum albumin (BSA) for 1 h. The proteins were resolved by SDS–PAGE and immunoblotted using indicated antibodies.
We next examined whether rapamycin, an mTOR inhibitor, inhibits the enhanced phosphorylation of S6K1 by mTOR S2215Y. After transfection of AU1-mTOR and FLAG-S6K1, we treated the cells with rapamycin for 1 h. In the cells with empty vector or mTOR wild type, phosphorylation of S6K1 was not seen (Figure 4c), whereas mTOR active mutants, E2419K and L1460P, increased phosphorylation of S6K1. This increased phosphorylation was suppressed by the rapamycin treatment. mTOR S2215Y also enhanced the phosphorylation of S6K1 but, in the presence of rapamycin, S6K1 phosphorylation was completely abolished. These results suggest that rapamycin is effective in inhibiting the phenotypes due to activating mutations in mTOR.
To gain insight into possible differences between the wild-type and the mutant mTOR, we examined sensitivity to treatments that are known to affect the mTOR signaling. It has been reported that the mTORC1 signaling is inhibited by several intracellular and extracellular stresses, including oxidative and osmotic stresses such as high concentration of hydrogen peroxide and sorbitol, respectively (Patel et al., 2002; Reiling and Sabatini, 2006). In addition, 1-butanol, an inhibitor of phospholipase D, also prevents the mTOR signaling by decreasing phosphatidic acid (Fang et al., 2001). We tested effects of these stresses and the inhibitor on the activity of the mTOR S2215Y mutant. As shown in Figure 4d, the mTOR signaling in cells expressing the mutant mTOR was insensitive to 1-butanol. Partial resistance to hydrogen peroxide was observed. In contrast, we did not find differences in the sensitivity to osmotic stress by sorbitol treatment between cells expressing the wild-type and the mutant mTOR. Our results with 1-butanol are of interest. Phospholipase D is involved in the synthesis of phosphatidic acid, which is required for the interaction of mTOR with raptor (English et al., 1996; Toschi et al., 2009). The mutant mTOR may have altered requirement for phosphatidic acid. We also examined whether the cells expressing the mutant mTOR exhibit altered response to hypoxia treatment (Supplementary Figure 2). HEK293 cells were transfected with pcDNA3 empty vector, pcDNA3-AU1-mTOR wild-type or pcDNA3-AU1-mTOR S2215Y cancer mutant, and placed in a 1% O2 condition. The cells were immediately lysed and the proteins were analyzed by SDS–polyacrylamide gel electrophoresis followed by western blotting. The activity of mTOR was assessed by the phosphorylation level of ribosomal protein S6. AU1-mTOR was equally expressed in the cells transfected with mTOR wild-type or with the cancer mutant. Hypoxia-inducible factor 1α (HIF-1α) expression was increased when the cells were placed in 1% O2 incubator for 3 or 6 h, confirming that the cells were exposed to low oxygen. In the cells with empty vector or with the mTOR wild type, phospho-S6 was reduced in a hypoxic condition. However, in the cells expressing the mTOR cancer mutant, S6 remained moderately phosphorylated even after 6 h exposure in hypoxic condition, suggesting that mTOR cancer mutant confers partial resistance to hypoxia.
In conclusion, we have shown that two different single amino-acid mutations in mTOR, S2215Y and R2505P, identified in cancer genome database, confer nutrient-independent activation on mTORC1. We have further shown that the cells expressing the mTOR mutant S2215Y exhibit altered cell-cycle profile with increased percentage of S phase. In addition, cells expressing the mutant mTOR do not decrease cell size on nutrient starvation. An important issue concerns whether the mTOR cancer mutants exhibit transforming activity. Our experiments with focus formation assays so far have not revealed any transforming activity of the mTOR mutant S2215Y (Supplementary Figure 3a). This suggests that the sole expression of the mTOR cancer mutant does not transform Rat1 cells. Maeda and co-workers (Ohne et al., 2008) have examined hyperactive mTOR mutants identified by genetic screens and reported that their mutants do not transform NIH3T3 cells. Conversely, transforming activity of an activating mTOR mutant due to a deletion in the repressor domain of mTOR was reported using p53 mutant mouse embryonic fibroblasts (Edinger and Thompson, 2004). Further work is needed to conclude whether the mTOR mutants exhibit transforming activity.
It is important to point out that the mTOR mutation was present together with another mutation in the cancer samples we examined. In the case of the S2215Y mutation, mutations of G13D in K-ras and R8131I in Titin (TTN) were found. K-ras is the most frequently activated oncogene, with 17–25% of all human tumors harboring an active mutation in the gene (Kranenburg, 2005). This raises the possibility that the mTOR active mutant S2215Y enhances transforming activity of activated K-ras. Focus formation assays using Rat1 cells showed that the number of foci in cells coexpressing mutant K-ras and the mTOR S2215Y mutant is higher than that in cells expressing the mutant K-ras (Supplementary Figure 3b), raising the possibility that the mutant mTOR S2215Y enhances K-ras transformation. However, further work is needed to investigate this point. In the case of the kidney cancer sample harboring the R2505P mutation, another mutation of F218I in the CDC25A gene was present. CDC25 phosphatases activate Cdk/cyclin complexes by dephosphorylation and promote cell-cycle progression (Ray and Kiyokawa, 2007; Aressy and Ducommun, 2008). Overexpression of CDC25A and its isoform CDC25B has been observed in many human tumors, including breast, prostate, head and neck and non-small-cell lung cancer. In addition, expression of CDC25A in retinoblastoma-deficient fibroblasts leads to foci formation, growth in soft agar and tumor formation in mice (Kristjansdottir and Rudolph, 2004). Further study is needed to investigate whether the mTOR mutation and the CDC25A mutation work in concert to impact tumorigenesis.
Our study represents the first demonstration that mTOR is activated by point mutations in human cancer. Further mining of the human cancer genome database may reveal additional mutations. Characterization of tumor samples may provide insight into the type of cancer where mTOR activation has critical functions. In turn, this could help us target certain types of cancer for anti-mTOR treatments such as the rapamycin treatment.
Supplementary Material
Acknowledgments
This work was supported by National Institutes of Health Grant CA41996.
Footnotes
Conflict of interest
The authors declare no conflict of interest.
Supplementary Information accompanies the paper on the Oncogene website (http://www.nature.com/onc)
References
- Aressy B, Ducommun B. Cell cycle control by the CDC25 phosphatases. Anticancer Agents Med Chem. 2008;8:818–824. doi: 10.2174/187152008786847756. [DOI] [PubMed] [Google Scholar]
- Chiang GG, Abraham RT. Targeting the mTOR signaling network in cancer. Trends Mol Med. 2007;13:433–442. doi: 10.1016/j.molmed.2007.08.001. [DOI] [PubMed] [Google Scholar]
- Edinger AL, Thompson CB. An activated mTOR mutant supports growth factor-independent, nutrient-dependent cell survival. Oncogene. 2004;23:5654–5663. doi: 10.1038/sj.onc.1207738. [DOI] [PubMed] [Google Scholar]
- English D, Cui Y, Siddiqui RA. Messenger functions of phosphatidic acid. Chem Phys Lipids. 1996;80:117–132. doi: 10.1016/0009-3084(96)02549-2. [DOI] [PubMed] [Google Scholar]
- Fang Y, Vilella-Bach M, Bachmann R, Flanigan A, Chen J. Phosphatidic acid-mediated mitogenic activation of mTOR signaling. Science. 2001;294:1942–1945. doi: 10.1126/science.1066015. [DOI] [PubMed] [Google Scholar]
- Guertin DA, Sabatini DM. Defining the role of mTOR in cancer. Cancer Cell. 2007;12:9–22. doi: 10.1016/j.ccr.2007.05.008. [DOI] [PubMed] [Google Scholar]
- Inoki K, Corradetti MN, Guan KL. Dysregulation of the TSC-mTOR pathway in human disease. Nat Genet. 2005;37:19–24. doi: 10.1038/ng1494. [DOI] [PubMed] [Google Scholar]
- Karbowniczek M, Spittle CS, Morrison T, Wu H, Henske EP. mTOR is activated in the majority of malignant melanomas. J Invest Dermatol. 2008;128:980–987. doi: 10.1038/sj.jid.5701074. [DOI] [PubMed] [Google Scholar]
- Kranenburg O. The KRAS oncogene: past, present, and future. Biochim Biophys Acta. 2005;1756:81–82. doi: 10.1016/j.bbcan.2005.10.001. [DOI] [PubMed] [Google Scholar]
- Kristjansdottir K, Rudolph J. Cdc25 phosphatases and cancer. Chem Biol. 2004;11:1043–1051. doi: 10.1016/j.chembiol.2004.07.007. [DOI] [PubMed] [Google Scholar]
- Molinolo AA, Hewitt SM, Amornphimoltham P, Keelawat S, Rangdaeng S, Meneses García A, et al. Dissecting the Akt/mammalian target of rapamycin signaling network: emerging results from the head and neck cancer tissue array initiative. Clin Cancer Res. 2007;13:4964–4973. doi: 10.1158/1078-0432.CCR-07-1041. [DOI] [PubMed] [Google Scholar]
- Ohne Y, Takahara T, Hatakeyama R, Matsuzaki T, Noda M, Mizushima N, et al. Isolation of hyperactive mutants of mammalian target of rapamycin. J Biol Chem. 2008;283:31861–31870. doi: 10.1074/jbc.M801546200. [DOI] [PubMed] [Google Scholar]
- Patel J, McLeod LE, Vries RG, Flynn A, Wang X, Proud CG. Cellular stresses profoundly inhibit protein synthesis and modulate the states of phosphorylation of multiple translation factors. Eur J Biochem. 2002;269:3076–3085. doi: 10.1046/j.1432-1033.2002.02992.x. [DOI] [PubMed] [Google Scholar]
- Ray D, Kiyokawa H. CDC25A levels determine the balance of proliferation and checkpoint response. Cell Cycle. 2007;6:3039–3042. doi: 10.4161/cc.6.24.5104. [DOI] [PubMed] [Google Scholar]
- Reiling JH, Sabatini DM. Stress and mTORture signaling. Oncogene. 2006;25:6373–6383. doi: 10.1038/sj.onc.1209889. [DOI] [PubMed] [Google Scholar]
- Robb VA, Karbowniczek M, Klein-Szanto AJ, Henske EP. Activation of the mTOR signaling pathway in renal clear cell carcinoma. J Urol. 2007;177:346–352. doi: 10.1016/j.juro.2006.08.076. [DOI] [PubMed] [Google Scholar]
- Sabatini DM. mTOR and cancer: insights into a complex relationship. Nat Rev Cancer. 2006;6:729–734. doi: 10.1038/nrc1974. [DOI] [PubMed] [Google Scholar]
- Sancak Y, Thoreen CC, Peterson TR, Lindquist RA, Kang SA, Spooner E, et al. PRAS40 is an insulin-regulated inhibitor of the mTORC1 protein kinase. Mol Cell. 2007;25:903–915. doi: 10.1016/j.molcel.2007.03.003. [DOI] [PubMed] [Google Scholar]
- Sato T, Nakashima A, Guo L, Tamanoi F. Specific activation of mTORC1 by Rheb G-protein in vitro involves enhanced recruitment of its substrate protein. J Biol Chem. 2009;284:12783–12791. doi: 10.1074/jbc.M809207200. [DOI] [PMC free article] [PubMed] [Google Scholar]
- Toschi A, Lee E, Xu L, Garcia A, Gadir N, Foster DA. Regulation of mTORC1 and mTORC2 complex assembly by phosphatidic acid: competition with rapamycin. Mol Cell Biol. 2009;29:1411–1420. doi: 10.1128/MCB.00782-08. [DOI] [PMC free article] [PubMed] [Google Scholar]
- Urano J, Sato T, Matsuo T, Otsubo Y, Yamamoto M, Tamanoi F. Point mutations in TOR confer Rheb-independent growth in fission yeast and nutrient-independent mammalian TOR signaling in mammalian cells. Proc Natl Acad Sci USA. 2007;104:3514–3519. doi: 10.1073/pnas.0608510104. [DOI] [PMC free article] [PubMed] [Google Scholar]
- Wang X, Proud CG. Nutrient control of TORC1, a cell-cycle regulator. Trends Cell Biol. 2009;19:260–267. doi: 10.1016/j.tcb.2009.03.005. [DOI] [PubMed] [Google Scholar]
- Wullschleger S, Loewith R, Hall MN. TOR signaling in growth and metabolism. Cell. 2006;124:471–484. doi: 10.1016/j.cell.2006.01.016. [DOI] [PubMed] [Google Scholar]
Associated Data
This section collects any data citations, data availability statements, or supplementary materials included in this article.