

Abstract
Monoclonal antibodies (mAbs) have proven to be effective biological reagents in the form of therapeutic drugs and diagnostics for many pathologies, as well as valuable research tools. Existing methods for isolating mAb-producing hybridomas are tedious and time consuming. Herein we describe a novel system in which mAb-secreting hybridoma cells were induced to co-express significant amounts of the membrane form of the secreted immunoglobulin (Ig) on their surfaces and are efficiently recovered by fluorescent activated cell sorting (FACS). Fusion of a novel myeloma parent, SP2ab, expressing transgenic Igαand Igβ of the B-cell receptor complex (BCR) with spleen cells resulted in hybridomas demonstrating an order of magnitude increase in BCR surface expression. Surface Ig levels correlated with transgenic Igα expression, and these cells also secreted normal levels of mAb. Hundreds of hybridoma lines producing mAbs specific for a variety of antigens were rapidly isolated as single cell-derived clones after FACS. Significant improvements using the Direct Selection of Hybridomas (DiSH) by FACS include reduced time and labor, improved capability of isolating positive hybridomas, and the ease of manipulating cloned cell lines relative to previously existing approaches that require Limiting Dilution Subcloning (LDS).
Keywords: Igα, CD79a, Igβ, CD79b, therapeutics, diagnostics, B cell antigen receptor, hybridoma, monoclonal antibody, myeloma
1. Introduction
Monoclonal antibodies (mAbs) are essential biotechnology reagents widely used in every phase of the biomedical field from discovery research and diagnosis to therapeutics. The power of mAb based therapeutics lies primarily in their specificity and strong affinity for a target antigen as well as their ability to mediate immune effector functions such as Antibody Dependent Cell Mediated Cytotoxicity and the Complement Cascade. The expansion of downstream technologies, most notably the humanization of mouse mAbs, and resultant low immunogenicity, have greatly expanded the therapeutic applications for mAbs (Milstein, 1999; Glennie and van de Winkel, 2003; Jakobovits et al., 2007). Consequently, there are 21 therapeutic mAb-based reagents currently approved for clinical use, five with annual sales in excess of $3B, and many others in various stages of clinical trials for a variety of diseases (Maggon, 2007)(www.fda.gov/cder/biologics/default.html, www.pipelinereview.com/index.php?option=com_performs&formid=7). In addition, mAbs account for a major market share in clinical and outpatient products and even over-the-counter diagnostics. However, current hybridoma-based mAb development technologies are cumbersome and confounding to the demands of high-throughput facilities. Further, alternative methodologies that avoid hybridomas (e.g. XenoMax and Phage Display), while offering certain advantages, carry burdens of expense and proprietary issues and have their own limitations (Marks et al., 1991; Babcook et al., 1996). Hence, we set out to develop new scientific and technical tools for rapid hybridoma detection and isolation.
Kohler and Milstein’s (1975) seminal publication describes the generation and selection of hybridoma cells, heterokaryons resulting from the fusion of mouse B-lymphocytes and immortal myeloma cells, for the production of mAbs. The relevant hybridoma cells producing the mAb of choice are separated into individual clones using Limiting Dilution Subcloning (LDS). Recovering the hybridomas using cell cloning by LDS is perhaps the most problematic, time consuming, and labor-intensive step in generating mAbs (Antczak, 1982; O’Reilly et al., 1998). The fused hybridoma cells are deposited into a few thousand microtiter plate wells containing media supplemented with HAT (hypoxanthine, aminopterin, thymidine). HAT selects for hybridoma cells by killing unfused myeloma cells. The desired hybridomas are identified by screening for the reactivity of mAb secreted into the media using well-known methods such as an Enzyme-Linked Immunosorbent Assay (ELISA). Each HAT resistant cell population testing positive for secreted target mAb must be processed by reiterative cycles of LDS until the progeny of a positive cell is mathematically identified as clonal (Staszewski, 1984). Proposed solutions to this limitation including soft agar culture techniques (Draber et al., 1980), robotics to conduct the repeated cycles of LDS (Wewetzer and Seilheimer, 1995) and micro-encapsulation technologies that trap and assay the secreted Ab in the media around cells (Prokop et al., 2004; Hanania et al., 2005) have attempted to address the various weaknesses of LDS, but are expensive or offer little improvement in the efficiency.
The LDS process could be eliminated if all the desired hybridoma cells expressed the membrane Ig form of the secreted mAb. Cells could then be purified using Fluorescence Activated Cell Sorting (FACS). A few early attempts to use FACS for hybridoma cell cloning (Parks et al., 1979; Meilhoc et al., 1989), while promising, lacked efficiency because most hybridomas poorly express surface Ig (Matsuuchi et al., 1992; Seegmiller et al., 2007). Thus, the immediate objective of our research was to generate hybridomas that would consistently express membrane Ig on the cell surface and thereby facilitate efficient clonal selection by FACS.
We saw two potential obstacles to developing DiSH technology. The first of these was expression of the B-cell receptor subunit proteins Igα (CD79a, NP_031681) and Igβ (CD79b, NP_032365) necessary for assembly and trafficking of a functional BCR complex to the cell surface. Expression of membrane immunoglobulin on the surface of myeloma cells was obtained by transfecting lymphoid cells with cDNAs encoding the membrane isovariant of the antibody heavy chain (HCm) and the Igα and Igβ receptor proteins (Hombach et al., 1990). A diagram of the proposed natural arrangement of these proteins on the cell surface as they are positioned in the B-cell antigen receptor (BCR) complex is shown in Figure 1A. This experimental observation of engineered BCR complex presentation on the cell surface was extended to non-lymphoid cells using a pituitary cell line that is active in secretory functions, but normally would not synthesize the BCR nor express it on its cell surface (Matsuuchi et al., 1992). Once again, transgenic expression of the associated Igα and Igβ proteins, and light chain (LC) and HCm was sufficient to restore cell surface expression of the complete BCR. Thus, the first obstacle to developing hybridomas that efficiently express membrane immunoglobulin on their surface might be the limiting expression of Igα and Igβ proteins, and perhaps other accessory factors necessary for assembly and trafficking of a functional BCR complex.
Fig. 1. Expression of secreted immunoglobulin and its membrane form in the BCR complex.

A. Comparison of structures for the secreted Ab with the membrane anchored form of Ig in the BCR complex. The BCR complex is composed of two heavy chain subunits (HCm, green) with a C-terminal membrane-spanning domain (yellow, small arrows); two light chains (LC, dark gray), and one heterodimer containing Igα and Igβ (Schamel and Reth, 2000). The major secreted form of Ab contains heavy chain subunits HCs lacking the membrane domain (right) and ending in a short novel C-terminal domain (blue). A similar model may be drawn for all Ig isotypes and subtypes. B. Comparison of processing of heavy chain transcripts. Upward arrows: In immature and mature B-cells the heavy chain transcript is subjected to splicing that excludes RNA encoding 3′ e UTR2 (untranslated region 2) and includes the membrane spanning region exons (m1, m2) and the 3′ UTR1 to make mRNAm encoding HCm. Downward arrows: In Ab-secreting plasma cells the rate of heavy chain transcription is increased and majority of mature heavy chain transcripts are subjected to alternate upstream polyadenylation using 3′ UTR2 to produce mRNAs encoding HCs. C. Western blots showing the membrane isovariant of heavy chain HCm (yellow dot) and smaller secreted isovariant HCs (blue dot) were present not only in a mouse B-lymphoma cell line (IgG2a expressing memory B-cell line A20.2J), but also in mouse plasma cell lines expressing various isotypes: IgG2a (A20); IgG2a (AxJ); IgG1 (anti-SC32); and IgG2b (4T001) (Milcarek et al., 1996). Twenty five μg of total protein (Bradford, 1976) from each cell extract was resolved by SDS-PAGE, blotted to membrane, and probed with rabbit antisera to the mouse heavy chain. The blots were processed as described previously(Kandasamy et al., 1999). The approximate sizes of the various heavy chain isovariants are indicated on the right.
The second potential obstacle to developing hybridomas that efficiently express membrane Ig might be a deficiency in the expression of the membrane isovariant of the Ig heavy chain (HCm). It is unclear if hybridoma cells express the longer HCm isovariant that is normally part of the BCR complex, along with the usual high levels of HCs, the secreted form. HCm contains the C-terminal peptide partly responsible for efficient insertion of the Ig molecule into the membrane. As B-cells develop into plasma cells an alteration in the post-transcriptional processing of the HC nuclear transcript (Fig. 1B) is reported to result in a switch from HCm to HCs expression. This switch plus an increase in the rate of transcription results in robust antibody (Ab) secretion (Milcarek and Hall, 1985; Genovese et al., 1991; Lassman et al., 1992). HCs protein lacking the membrane-spanning domains is thought to be unable to bind the associated receptor proteins, Igα and Igβ and therefore is secreted. Thus, we explored HCm, Igα and Igβ protein expression as possible barriers to obtaining high level BCR expression in hybridomas.
We found that Igα expression was the major limitation to the efficient expression of membrane-associated Ig for typical mAb secreting hybridoma cells. Furthermore, hybridomas derived from a myeloma parent engineered to over-express Igα displayed significant amounts of the BCR complex on the cell surface. Using this engineered myeloma hundreds of hybridomas making Abs to four diverse antigens were rapidly and efficiently identified and recovered by FACS. DiSH technology greatly simplifies and accelerates mAb development and should help in developing targeted therapeutics and meet the ever-increasing demand for these valuable reagents.
2. Methods
2.1. Cell lines and growth conditions
The myeloma cell line SP2/0 (SP2/0-ag14, American Type Culture Collection #CRL-1581) or its transgenic derivative SP2ab were used to generate the hybridomas discussed herein. We also examined two well-characterized hybridoma cell lines, HGS1 (line 12G7) and HECS1 (line 16D8) (Li et al., 2001). SP2/0, SP2ab, and hybridoma cell lines were grown on Iscove’s Modified Dulbecco’s medium (IMDM, MediaTech, Herndon, VA) supplemented with 20% fetal bovine serum (FBS) (Atlanta Biologicals, Inc., Lawrenceville, GA) and grown at 37°C with 6% CO2, and >90% relative humidity (RH). Hybridomas were produced as described in Harlow and Lane (1988) and grown in culture medium supplemented with HAT (Sigma-Aldrich, St. Louis, MO). Sorted cells were grown in culture medium supplemented with hypoxanthine and thymidine (Sigma-Aldrich). The isotypes of the various secreted Abs were determined using a Mouse Monoclonal Ab Isotyping Kit (Mouse monoAB, Invitrogen, Carlsbad, CA).
2.2. Transfection and selection
Transfections of hybridomas and myeloma cells were performed using LipofectAMINE reagent (Gibco BRL, Rockville, MD) in 1.0 ml of Opti-MEM I (Gibco-BRL) reduced serum medium following the manufacturer’s recommendations. Neomycin (Neo) (G418, Gibco BRL) and Zeocin (Invitrogen) selections were performed at 750 μg/ml and 450–750 mg/ml, respectively. Transfected cells were grown under continuous selection, except SP2ab, which was removed from selection one week prior to use in fusion experiments.
2.3. Engineering the expression of Igα and Igβ
The cDNAs encoding two receptor sequences, Igα and Igβ were PCR amplified from mouse splenic cDNA (BD Biosciences, Clonetech, Palo Alto, CA). For Igα the PCR primers were Igα-1S (5′TAGTGAACTA GTAAGCTTGC CACCATGCCA GGGGGTCTAG AAGCCCTCA) and Igα-221A (5′GTCTAGATCG ATGAA TTCTC ATGGCT TTC CAGCTGGGCA TC). For Igβ the PCR primers were Igβ-1S (5′TAGTGAACTA GTAAGCTTGC CACCATGGCC ACACTGGTGC TGTCTTCCAT G) and IgB-229A (5′GTCTAGATCG ATCTCGAGTC ATTCCTGGCC TGGATGCTCT CCTACCGA). The PCR product containing the Igα sequence was digested with HindIII and EcoRI and cloned into the corresponding replacement region of the eukaryotic expression vector pcDNA3.1/Neo (Invitrogen). The PCR product containing Igβ sequence was digested with HindIII and XhoI and cloned into the corresponding replacement regions of the eukaryotic expression vector pcDNA3.1/Zeo (Invitrogen). The sequences of the cloned Igα and Igβ receptor genes were confirmed and the resulting plasmids were termed pNeoIgα and pZeoIgβ, respectively. Recombinant plasmid DNA was purified over an endotoxin-free purification kit (Qiagen, Inc., Valencia, CA) in preparation for transfection.
2.4. Antibodies and immunization
Rabbit polyclonal Ab to the Igα and Igβ chains of the BCR have been previously described (Condon et al., 2000) and were used in our initial studies. For most of the work presented herein, a new rabbit polyclonal specific for Igα was prepared similarly by immunizing animals with each of two 30 amino acid synthetic peptides: Igα 67–96 SNITWPPVPLGPGQGTTGQLFFPEVNKNTG and Igα 191–220 SMYEDISRGLQGTYQDVGNLHIGDAQLEKP. Both antigens were synthesized as four-fold redundant branched peptides with a lysine core following the design of Tam (Tam, 1988). Keyhole limpet hemocyanin (KLH) and a HSV2 recombinant peptide fusion for glycoprotein G (HSV2gG) were obtained from Pierce (Rockford, IL) and ProSpec-Tany (HSV-2 gG, Rehovot, Israel), respectively. Influenza virus A/Johannesburg H3N2 and A/Beijing H1N1 were obtained from Dr. Dennis Bagarrozzi (Centers for Disease Control and Prevention, Atlanta, GA). A portion of the Arabidopsis ARP5 cDNA (Locus #At3G12380, TAIR Accession #2092452) encoding the first 350 amino acids of the 590 residue protein was cloned as a 6-HIS tagged fusion and the recombinant protein purified on a nickel affinity column (McKinney et al., 2002; Meagher et al., 2005). Rabbits and mice were immunized and boosted three times with 50 to 100 μg samples of each antigen prior to sampling blood or spleen, respectively.
2.5. Immunofluorescent Microscopy
Samples of live cells (106 from 5 to 10 ml of culture medium) to be examined by immunofluorescence were processed at 4°C. Cells were harvested by centrifugation, re-suspended in 250 μl of IMDM medium containing 10% FBS, allowed to sit for 20 min, blocked with anti-mouse CD16/32 (BD Biosciences, San Jose, CA) in 10% goat serum (Lampire, Montoursville, PA) in PBS, treated with FITC conjugated sheep anti-mouse Ig (1:20 dilution, Sigma #F-6257) for 30 min, washed once in IMDM and mounted on slides under glass coverslips. All slides were photographed using a 40X Zeiss lens and Hamamatsu digital camera (model C-4742–95). All photos were taken under the same illumination and exposure conditions and images were enhanced equivalently in brightness and contrast. Under these conditions cells treated with an unlabeled Ab or preimmune serum (not shown) have almost no detectable autofluorescence.
2.6. Cell sorting
Cell sorting was accomplished using a FACSAria (BD Biosciences). Hybridomas were prepared as described above. After 3 to 5 days of growth in HAT-supplemented medium, hybridoma cells are rapidly presorted away from other cells and dead-cell debris based on light scattering. The enriched hybridoma cell population was prepared for FACS by labeling first with biotin-conjugated antigen, prepared using Sulfo-NHS-LC-Biotin or EZ-Link-biotin-PEO-LC-amine (Pierce). Cells were washed, and then stained with phycoerythrin- (PE-) conjugated streptavidin (BD Biosciences) and allophycocyanin-conjugated Goat Anti-Mouse Ig H+L (Invitrogen). Cells were again washed, and resuspended with IMDM containing 20% FBS (Atlanta Biological Laboratories). For some experiments, non-viable cells were differentiated from live cells using propidium iodide or 7-amino actinomycin D (both Invitrogen). Cells identified as positive for both Ig-expression and antigen reactivity during sorting were deposited singly into wells of 96-well culture plates (Corning) containing 120 μl IMDM containing 20% FBS (Atlanta Biologicals, Inc.), and cultured at 37°C, 6% CO2, >90% humidity. After 7 to 10 days, cultures were screened for antigen reactivity by ELISA.
3. Results
3.1. Detecting the membrane isovariant of immunoglobulin heavy chain
Quantitative comparisons of mRNAs and mRNAm levels show that hybridomas still express reasonable mRNAm levels relative to immature and mature B-cells for at least one isotype, IgG2a (Matis et al., 1996; Milcarek et al., 1996; Edwalds-Gilbert et al., 1997). Therefore, we considered the possibility that there was sufficient HCm protein already produced by hybridomas for the potential expression of a BCR complex on the cell surface. The addition of the m1 and m2 domains to the heavy chain protein (Fig. 1B) results in HCm being longer than HCs for all isotypes (Yamawaki-Kataoka et al., 1982). Western blotting resolved the ~58 to 62 kDa HCm protein isovariants from the ~48 to 55 kDa HCs isovariants for several Ig isotypes that were expressed in different plasma cell lines (Fig. 1C). As expected, there were much higher levels of the secreted IgG2a HCs isovariant in the two different plasma cell lines analyzed relative to HCs levels in a B-cell line. While the ratio of HCm to HCs was significantly lower in plasma cell lines than in a B-cell line, the absolute levels of HCm in the plasma cell lines appeared significant. The predicted HCm isovariants of IgG1 and IgG2b isotypes also were expressed at reasonable levels relative to their HCs isovariants (Fig. 1C). This demonstrated that HCm protein levels for at least three isotypes were in all probability not limiting BCR surface expression in plasma cells or hybridomas. In these antibody secreting cells HCs expression is enhanced to the point that the relatively low levels of HCm may have been ignored in previous studies.
3.2. Demonstrating that Igα expression was undetectable in hybridoma cells
Next, the possibility that Igα and/or Igβ expression limited the formation of the BCR complex in hybridomas was examined. Igα and Igβ sequences were PCR amplified from a mouse splenic cDNA and cloned under control of a constitutively expressed promoter in separate plasmid vectors with different drug markers. The hybridoma lines HGS1 and HECS1 producing the IgG1 and IgG2a isotypes, respectively (Li et al., 2001), were used reconstruction experiments. Both hybridoma lines were derived by a mouse splenic B-cell fusions with one of the most commonly used myeloma partners for making hybridomas, SP2/0. We isolated several HGS1- and HECS1-transfected cell lines containing both the Igα and Igβ transgenes. Several of the doubly drug resistant HGS1 co-transfected cell lines were examined for Igα and Igβ expression on Western blots and compared to the HGS1 parent and spleen cell extracts (Fig. 2). High levels of Igα expression were seen in the 35 kDa range for the spleen cell control (SC), but not for HGS1 line (Fig. 2A). Four of the six HGS1 transfected cell lines (HGS1αβ6, αβ7, αβ9, αβ10) expressed moderate to high levels of Igα compared to undetectable levels in the control parental HGS1 cells. Two HGS1αβ cell lines (αβ8 and αβ11) showed no significant Igα protein expression on Westerns. Thus, it appeared that Igα expression was variable as expected from position effects of independent Igα transgenes.
Fig. 2. Expression of Igα and Igβin hybridomas and correlation with surface immunoglobulin.

A, D, and E. The HGS1 and HECS1 hybridoma cell lines expressing an IgG1 and IgG2a isotypes were transfected with pNeoIgα and pZeoIgβ plasmids. Protein extracts from the resulting cell lines were assayed on Western blots for expression of Igα (A and E) and Igβ (D). Extracts are named as follows: SC, spleen cell extract; HGS10 and HECS10 are the parental hybridoma cell lines, and HGS1ab6-11 and HECS1ab, the Igα/Igβ transfected cell lines. B. The percent of individual cells in each population aligned with 1A above, which had three times greater fluorescence intensity than the mean fluorescence intensity (MFI) of control HGS1 cells is presented for each of several cell lines. MFI was measured for individual cells in a microscopic field from images like those taken in Supplemental Fig. 2, using OpenLab software (Improvision, Inc., Boston, MA). N = 50 cells for each of the eight cell populations examined. Live cells were labeled with FITC GAM Ig (Methods). C. Control hybridoma HGS1 is compared using flow cytometry to the HGS1 line transformed with Igα and Igβ after labeling with APC GAM Ig. Histograms indicate live-cell populations. E. Igα expression is compared between non-transfected HECS1 and Igα/Igβ transfected HECS1ab1.
A and C. Each lane contained 25 mg of total cell protein denatured in sample buffer, resolved on a 12% acrylamide gel, transferred to an Immobilon membrane (Millipore, Bedford, MA), reacted with rabbit polyclonal anti mouse Igα Ab or Igβ Ab (see Methods), then with donkey anti-rabbit Ab coupled to HRP (Amersham Pharmacia Biotech, Piscataway, NJ), and developed following published protocols (Kandasamy et al., 1999). The position and size of molecular weight standard are indicated on the left. Protein levels in various samples were determined by Bradford assays (Bradford, 1976) and equal loading confirmed by running a preliminary gel and staining proteins with Coomassie blue (not shown). Cells with low or high levels of cell surface expression (S.E.) of Ig are scored as − or +, respectively.
In contrast, moderate to high levels of Igβ protein were detected in all HGS1-derived cell lines examined (Fig. 2D) and in the parental HGS1 line itself. Expression of Igβ was also strong in spleen cell extracts, although protein migration was slower, perhaps due to more extensive modification of this glycoprotein. Similar results of variable Igα and substantial Igβ expression were seen for the different HECS1-transfected lines (not shown). Subsequent assays showed that the standard SP2/0 myeloma parent used to make the HGS1 and HECS1 hybridomas expressed no detectable Igα (not shown), but moderate levels of Igβ (right-hand lane, Fig. 1C). Thus, Igβ expression in these hybridomas was likely derived from the SP2/0 myeloma parent, and in some cases may have been enhanced by the pZeoIgα transgene (e.g., line HGS1αβ6).
3.3. Increased surface expression of membrane immunoglobulin in transfected hybridoma lines correlated with transgenic Igα expression
The HGS1αβ hybridoma cell lines were labeled with FITC conjugated Goat Anti-Mouse Ig (GAM Ig) and examined surface expression of membrane Ig by immunofluorescence microscopy (Fig. 3). A low frequency (~10 to 20%) of non-transfected control HGS1 cells present very weak, but detectable IgG1 surface Ig (Fig. 3A). The levels of cell surface Ig on a transfected cell line expressing high levels of Igα (HGS1αβ6) are shown in Fig. 3B. The data suggest that between 94% and 98% of the more than 50 cells in each of the four Igα-expressing cell populations quantified (αβ6, αβ7, αβ9, and αβ11) had detectable to high levels of surface Ig. Magnified images of the brightest HGS1 control cell see arrow) and the brightest HGS1αβ6 expressing cell (Fig. 3A & 3B, see arrows) are shown in (Fig. 3C & 3D), respectively. It is clear from these fluorescent images that there was a great deal of IgG1 Ab on the surfaces of HGS1αβ6 cells. Two of the G418- and Zeocin-resistant transfected cell lines, those that showed no Igα expression (αβ8, αβ11, Fig. 2A), also showed no increase in surface expression of Ig relative to HGS1 (not shown). Thus, Igα transgene expression correlates with substantial increases in both the frequency that cells express detectable levels of cell surface Ig and the absolute levels of expression relative to that of the control cells. We repeated these experiments three times with similar results on these and several other HGS1 transfected cell lines.
Fig. 3. Immunofluorescence microscopy of membrane immunoglobulin expression.

Reconstruction experiments in transfected hybridomas examined cell surface expression of membrane Ig as a function of Ig α/β expression. A–D. Increased surface expression of membrane IgG1 in response to Ig α/β expression. A. Non-transfected HGS1 hybridoma cells (HGS1). B. Transfected HGS1 hybridoma cell line HGSab6 expressing high levels of Ig α/β(see Fig. 2A, B). C & D. Image of the cell (arrows and boxed areas) showing strongest surface expression of membrane Ig in A and B, respectively. E & F. Surface expression of an IgG2a secreting hybridoma was observed with or without Ig α/β expression in an established hybridoma line. E. Non-transfected HECS1 hybridoma cells. F. Transfected HECS1 hybridoma cell line HECSab1 expressing high levels of Ig α/β (see Fig. 2E). Based on images of the same field of cells taken with phase contrast microscopy (not shown) the few bright cells in F are not viable. Cells (A–F) were incubated with FITC-conjugated GAM Ig (H+L) (see Methods).
The frequency of cells with high levels of fluorescence intensity was quantified. We examined the mean fluorescence intensity of 50 cells from each population. For the four cell lines expressing Igα (αβ6, αβ7, αβ9 and αβ10) a high frequency (60 to 80%) of cells demonstrated mean fluorescence intensity three times greater than the mean for non-Igα expressing parental HGS1 cells (Fig. 2B). Only 0 to 6% of the control HGS1 cells or transfected non-Igα expressing cells (αβ8, αβ11) reached this level of fluorescence intensity in several independent experiments. These microscopic measurements of the frequency of high levels of surface expression could not be used to quantify the total level of increased cell surface Ig, because approximately 60% of the Igα-expressing cells demonstrated fluorescence that exceeded the dynamic range of our instrumentation.
As a further measure of surface antibody expression we stained cells with fluorescent (allophycocyanin, APC)-conjugated Goat anti-mouse IgG (H+L) to compare the mean fluorescence intensity (MFI) of the parental hybridoma HGS1 (WT) population to that of a transformed HGS1 line expressing Igα and Igβ (Fig. 2C). There is a dramatic increase in the labeling of surface Ig for the Igα/Igβ transgenic line. In the HGS1 WT histogram, only 0.1% of the live cell population show positive fluorescence (P3 gate) with a MFI of 199 units, consistent with microscopic data revealing limited surface expression. On the other hand, for the transfected cell line, 89.7% of the live cells displayed positive fluorescence with a MFI of 16,993 units.. Thus, there was an increase in the cell surface labeling of Ig resulting from Igα/Igβ expression for this hybridoma greater than two orders of magnitude over the parental hybridoma.
3.4. A novel engineered myeloma parent SP2ab generated BCR-positive hybridomas after fusion
SP2/0 myeloma cells were transfected with Igα- and Igβ-expressing plasmids in order to obtain a new myeloma line that conferred constitutive Ig receptor expression to hybridomas. Among 30 co-transfected cell lines examined by Western blot, one line, SP2ab, consistently expressed Igα at high levels (Fig. 4A). This level of Igα expression was stable in the new myeloma cell line during more than 60 generations of cell growth with drug selection. SP2/0 and SP2ab were fused with mouse splenic B-cell populations using a standard protocol for making hybridomas (Kohler and Milstein, 1975; Harlow and Lane, 1988). The resulting cells were diluted into microtiter plates in HAT-containing media to select for hybridomas. The medium from each well showing cell growth was scored for secreted mouse mAb using ELISA. Similar numbers, approximately 60%, of HAT-resistant hybridoma cells derived from either the SP2/0 or SP2ab myeloma parent secreted mAb in repeated experiments. Split spleen experiments suggested that antibody producing hybridomas were created at about the same frequency with SP2/0 or SP2ab. Thus, SP2ab is equivalent to its un-transfected parent in producing hybridomas. Igα expression for a few example hybridoma lines secreting various Ig isotypes is shown in Figure 4A and 4B. In two separate experiments, 15 out of 16 and 17 out of 20 of the SP2ab-derived hybridoma cell lines showed substantial Igα expression. None of the 30 SP2/0-derived hybridomas examined showed Igα expression. Thus, the property of Igα expression was transmitted to nearly all hybridomas derived by cell fusion from SP2ab. Igβ expression was observed in all hybridomas derived from either parent (not shown) as expected from the data presented from the reconstruction experiments in Figure 2. Based on quantitative ELISAs, the secretion of mAb by the SP2ab derived lines was not diminished relative to the SP2/0 derived lines (Fig. 4C).
Fig. 4. BCR expression and antibody secretion in SP2ab derived hybridomas.

A. Igα expression by hybridomas derived from the SP2/0 and SP2ab myeloma fusion partners. The samples are as follows: the two parental myeloma cell lines SP2/0 wild-type and SP2ab; hybridoma cell lines paired by their Ig isotypes derived from fusions with SP2/0 (IgM0, IgG10, IgG30) and SP2ab (IgMab, IgG1ab, IgG3ab). B. Expression of Igα in hybridomas producing the IgG2a isotype. Two hybridomas each derived from SP2/0 (IgG2a0) and SP2ab (IgG2aab) are compared. A & B. Moderate to high levels of cell surface expression (S.E.) of Ig by the various cell lines (Fig. 5) was scored as positive, negative (background levels). Details of protein loading and detection on these Western blots were described previously (Kandasamy et al., 1999) (also see Fig. 2). C. Secretion of Ab into growth media by hybridomas derived from the SP2/0 (n =15) and SP2ab (n =25) myeloma parents was quantified by ELISA. The standard deviations are shown.
Surface expression of the BCR complex was compared for SP2/0 and SP2ab derived hybridomas producing several different Ig isotypes, including IgM, IgG1, IgG2a, IgG3, and IgA. SP2ab derived hybridomas lines of all isotypes examined showed moderate to high levels of cell surface Ig expression (Fig. 5, right column). The level of surface expression was as high for most of these hybridomas as it was for reconstructed lines derived from HGS1 (Figures 2 and 3). In several samples of each isotype, 100% of the living cells showed detectable surface expression. This again confirmed the correlation between Igα expression and the efficient surface expression of membrane Ig. Nomarski images of SP2ab and SP2/0 derived hybridomas confirmed that any cells with high internal fluorescence (arrows, Fig. 5I) were highly granular, had poor membrane integrity, and appeared dead (not shown).
Fig. 5. Immunofluorescence microscopy of hybridomas expressing cell surface immunoglobulin.

Hybridomas derived from splenic cell fusions with either SP2/0 or SP2ab as the myeloma parent are compared: SP2ab fusions (right side-- B, IgMab; D, IgG3ab; F, IgG1ab; H, IgG2aab; j, IgAab) expressed membrane Ig on the cell surface at moderate to high levels, regardless of Ig isotype, while SP2/0 fusions (left side--A, IgM0; C, IgG30; E, IgG10; G, IgG2a0; I, IgGA0) did not express notable levels of membrane Ig on the cell surface, with the exception of lines expressing the IgG2a isotype (e.g., g, IgG2a0). Inserts in A and B show two cells enlarged. Cells were labeled with FITC-conjugated GAM Ig. The cell lines shown are the same as those analyzed for Igα expression and Ab production in Fig. 4. Example dead cells are indicated by arrows in plate I. Scale bars for the full-size plates is shown in J.
All 15 SP2/0-derived hybridomas examined that were secreting IgM, IgG1, IgG3, and IgA isotypes demonstrated very low to undetectable surface expression of Ig, shown for four example cell lines in Figure 5 (left column). In contrast, independent SP2/0 derived IgG2a producing lines showed moderate levels of surface expression (example line, Fig. 5G), and none of these lines expressed Igα based on Western blots, shown for two examples (Fig. 4B). Furthermore, visual comparisons of three different IgG2a lines derived from either the SP2/0 or SP2ab myeloma parent suggested that Igα expression did not significantly increase surface expression for the membrane form of this isotype. One such comparison of IgG2a lines is shown in Figures 5G and 5H. To further test this distinction for IgG2a hybridomas the reconstruction experiment with the HECS1 hybridoma line that makes the IgG2a isotype was examined further. Transgenic HECS1 hybridoma lines expressing Igα (Fig. 2E) did not show increased surface expression of IgG2a Ig over the relatively high level already visible in HECS1 itself (Figures 3E and 3F). Evidently, substantial levels of cell surface expression of the IgG2a isotype of Ig were independent of Igα expression.
3.5. Selection of SP2ab-derived hybridomas by FACS
As an alternative to LDS, we developed a protocol for the Direct Selection of Hybridomas by FACS that depends upon the enhanced expression of the membrane form of the secreted Ab. Hybridoma isolation is partly a problem of numbers. In addition to the desirable hybridomas making an Ab to target antigen, hybridoma fusion populations contain hundreds to thousands of uninteresting hybridomas; an excess of splenic B-cells and plasma cells (~1 to 3 × 10⁸); myeloma parent cells (~1 to 3 × 10⁷); and other cells from the spleen. Our FACS-based protocol for DiSH takes advantage of the following properties of the various cell types. First, large hybridoma cells scatter light differently than small B-cells and granular dead cells. Second, nearly all SP2ab-derived hybridoma cells can be distinguished by labeling their surfaces with fluorescent conjugated Goat Anti-Mouse Ig (GAM Ig). Third, the small population of the desired hybridomas may be labeled on their cell surfaces with fluorescently tagged antigen displaying an emission spectrum different from the labeled GAM Ig.
Mice were immunized with antigens comprising varying degrees of antigenic complexity, including influenza virus strains A/Johannesburg (H3N2) and A/Beijing (H1N1) composed of several distinct subunit proteins; keyhole limpet hemocyanin (KLH) composed a heterogeneous mixture of modified subunits of approximately 400 kDa; recombinant Actin-Related Protein5 (ARP5, truncated to 38 kDa); and a recombinant polypeptide derived from herpes simplex virus G glycoprotein (HSV2gG, 6 kDa). Hybridoma populations were generated from the fusion of SP2ab with splenocytes from these mice. After a suitable incubation in HAT-containing medium, the surviving cells were enriched with high speed cell sorting based on light scattering. The resulting cells were labeled with allophycocyanin- (APC-) conjugated GAM Ig, the appropriate biotinylated antigen, and phycoerythrin- (PE-) conjugated streptavidin. Labeled-cells were sorted using FACS, with double-positive cells deposited singly into respective wells of 96-well culture plates containing culture medium supplemented with hypoxanthine and thymidine. Example sorting diagrams are shown for the four antigens in Figure 6.
Fig. 6. Identifying antigen-specific hybridomas by FACS.

Examples of FACS analysis performed on four antigens prior to single cell deposition of potential hybridomas into microtiter plates. Hybridomas were sorted first (vertical axis) based on reactivity with various antigens: A, Influenza A/Jb (Johannesburg); B, KLH; C, ARP5; D, HSV2gG glycoprotein; and second (horizontal axis) based on reactivity with GAM Ig. Cells were labeled with biotin-conjugated antigen coupled with PE-conjugated streptavidin and APC-conjugated GAM Ig (H+L). Squares highlight sorted populations: Q1 (orange, labeled for antigen only), Q2 (yellow, labeled for antigen and surface Ab), Q3 (blue, unlabeled), and Q4 (red, labeled for surface Ab only). Only 10,000 events are shown on each plot for simplicity of interpretation. The actual number events per sorting experiment generally exceeded 3×10⁷ (roughly 3 hours sorting at 3000 events/second).
In repeated experiments, 10 to 40% (mean = 13.7%) of these sorting events resulted in viable cells forming colonies in the wells, as shown for example experiments for each antigen in Table 1 and summarized for 25 DiSH experiments in Table 2. ELISAs were used to verify those cell lines producing Ab to the immunizing antigens. We obtained 2 to 100 hybridoma cell lines producing Abs to the different target antigens in each of the 25 individual experiments, with an average of 24 antigen-specific hybridomas per experiment. As expected, the largest average number of antigen-positive hybridoma lines was obtained for the most complex antigen, Influenza A virus (35 hybridomas), and the lowest average number was obtained for the small peptide antigen, HSV2gG (7 hybridomas). Several hundred cloned antigen-specific hybridoma cell lines were obtained in all. Perhaps most notable, 90% of the hybridoma cell lines remained ELISA positive for antigen-specific Ab secretion during two subsequent cycles of transfer and growth in fresh medium (Tables 1 and 2). This is in sharp contrast to our own experience with LDS and the previously published data from LDS experiments shown in Table 3, compiled from several references (White et al., 1978; Levy et al., 1979; Ugolini et al., 1980; Hughes and August, 1981; Cairncross et al., 1982; Frankel et al., 1982; Hancock et al., 1982). Starting with the hybridoma cells identified as antigen positive after the first round of plating and selection by HAT only 28% of these hybridomas remain stably positive for antibody production after subsequent rounds of LDS and after these lines were determined to be clonally pure (Mean value from Table 3)
Table 1.
Recovery of SP2ab-derived hybridoma clones producing antibodies against test antigens from distinct experiments
| Immunogen | % Viable Recovery | Antigen Positive Clones | |||
|---|---|---|---|---|---|
| #Positive clonesa | % Positive | #Stable positiveb | % Stablec | ||
| Influenza A/Johannesburg (H3N2) | 42.7 | 85 | 12.9 | 79 | 92.9 |
| Influenza A/Beijing (H1N1) | 13.2 | 63 | 35.6 | 63 | 100.0 |
| KLH | 15.4 | 31 | 41.9 | 31 | 100.0 |
| ARP5 | 10.8 | 47 | 30.1 | 37 | 78.7 |
| HSV2gG | 11.0 | 27 | 25.5 | 27 | 100.0 |
Single cells sorted by FACS producing antibody to target antigen as determined by ELISA
Cells continuing to produce antibody to target antigen after two subsequent cycles of dilution and growth.
Percent of positive clonesa that were stable positivesb.
Table 2.
The efficiency of hybridoma recovery with DiSH
| Immunogen | % Viable Recovery (mean) | Antigen Positive Clones | |||
|---|---|---|---|---|---|
| #Positive clones (mean)a | % Positive (mean) | #Stable positive (mean)a | % Stable (mean) | ||
| Whole Virus (n = 12) | 18.4 | 39 | 11.3 | 35 | 89.9 |
| Protein (n = 7) | 11.8 | 17 | 18.9 | 16 | 93.7 |
| Peptide (n = 6) | 12.2 | 7 | 4.8 | 7 | 100.0 |
| Average | 13.7 | 24 | 11.3 | 22 | 89.9 |
Mean of 25 values like those exemplified in the similarly named column in Table 1.
Table 3.
Hybridoma selection efficiency using Limiting Dilution Subcloning
| Hybridomas | First Round Positivea | Stable Positiveb | Reference |
|---|---|---|---|
| 100 | 17 (17%) | 1 (6%) | (White et al., 1978) |
| 619 | 60 (9.7%) | 2 (3%) | (Levy et al., 1979) |
| 220 | 11 (5%) | 5 (45%) | (Ugolini et al., 1980) |
| 182 | 44 (24%) | 13 (29.5%) | (Hughes and August, 1981) |
| 580 | 80 (14%) | 40 (50%) | (Frankel et al., 1982) |
| 400 | 15 (3.75%) | 3 (20%) | (Hancock et al., 1982) |
| 420 | 26 (6%) | 3 (11.5%) | (Cairncross et al., 1982) (mean from four fusions) |
| 360 | 36 (10%) | 10 (28%) | MEANS |
Cells producing antibody to target antigen as determined by ELISA during the first round of LDS
Cells continuing to produce antibody to target antigen after several rounds of LDS and being statistically considered as clonally pure.
Although the obvious advantage of DiSH was in avoiding the labor of LDS, it was still worth examining the efficiency of FACS sorting after HAT selection used to identified cloned hybridomas during DiSH as compared to LDS. Multiplying the average percent viable cell recovery (13.7%, Table 2) times the average percent stable positives (89.9%), we calculate the hybridoma selection efficiency using DiSH to be about 12.2%. This may be compared to a value of 2.8% LDS calculated from the data in Table 3. These data for LDS are based on published results describing the number of positives versus the total number of hybridomas on the first screen (i.e. first deposition in HAT) compared with the final number of positive clones obtained. Thus, 10% of deposited wells are recorded as positive on the first screen, but only 28% of these remain positive at the end of the study.
The stability of surface Ig expression was examined for two Sp2ab derived hybridomas making antibody to influenza virus strains A/Johannesburg and A/Beijing (Fig. 7). The hybridoma cell lines were maintained by continuous passage over the indicated time periods, seeding at 48 to 72 hour intervals with 1–5×10⁵ cells per ml. The mean fluorescence intensity (MFI) of cell populations labeled with fluorescent GAM Ig were assayed repeatedly over 12 months (A/Johannesburg) or 10 months (A/Beijing). Surface Ig expression appears to be remarkably stable over this time scale. While small differences in MFI were observed from month-to-month these changes in MFI values were as likely due to differences in the specific activity of labeling reagents as to changes in surface Ig expression for the two hybridoma cell lines. The parental Sp2ab myeloma cell line was used as a control in parallel labeling studies, however, the MFI values for surface Ig were below the scale shown in Fig. 7.
Figure 7. Stability of surface Ig expression over time for two Sp2ab derived hybriomas.
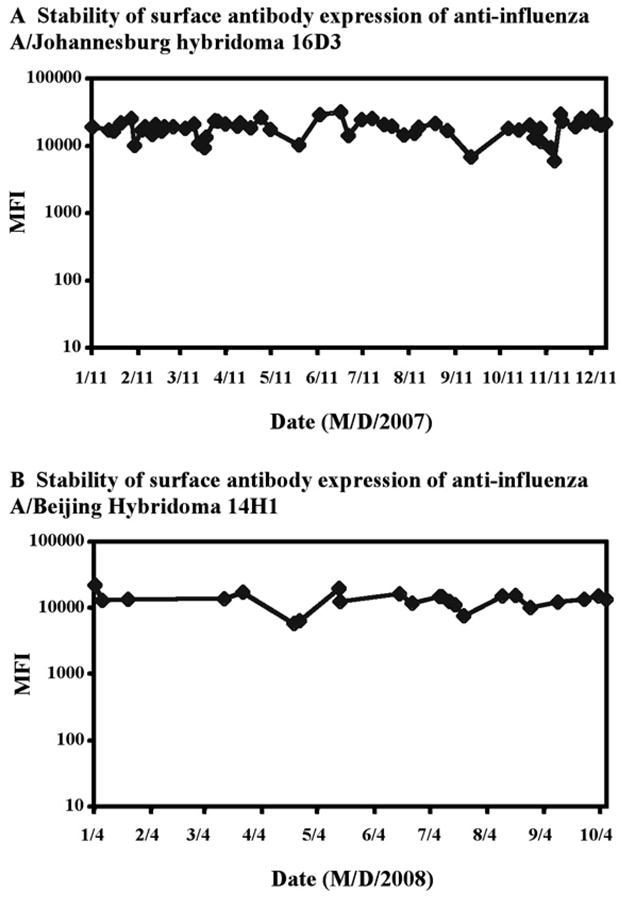
The stability of surface antibody expression was assayed for hybridoma cell lines making antibodies to two Influenza virus strains A/Johannesburg (A) and A/Beijing (B). The mean fluorescence intensity (MFI) of each cell population labeled with APC conjugated GAM Ig was assayed repeatedly over the indicated time periods.
3.6. The diversity of hybridomas obtained by DiSH
The antigen-specific hybridomas isolated in the various DiSH experiments produced a diverse population of mAbs based on the following two criteria. First, as with all functional hybridoma-based technologies, we were able to isolate cells expressing each of the common murine Ab isotypes (IgM, IgG1, IgG2a, IgG2b, IgG3, and IgA). We did not screen for IgE. Two to three different isotypes were recovered from typical fusion experiments. Second, we sequenced the HC (heavy chain) variable region (V-region) from all ARP5-specific hybridomas from two different fusions resulting in a modest number of hybridomas: one fusion yielding three isotypes, IgM, IgG2a, and IgG2b and one yielding only one isotype, IgG1. All of the HC V-region sequences were from mAbs that reacted with recombinant ARP5 on ELISAs (not shown). A novel rapid reverse transcriptase-mediated (RT) PCR sequencing protocol was developed to determine the V-region sequence of the expressed HC allele from each hybridoma that avoided cloning used in related RT-PCR sequencing approaches (Wang et al., 2000) (see protocol in the Data Supplement). Three distinct V-regions, one for each isotype, were identified from the first fusion and two distinct V-region sequences were identified from among the IgG1 hybridomas from the second fusion (Supplemental Fig. 1 and Table 1). Thus, a minimum of five independent hybridoma lines were isolated. Antibodies representing each of the five sequence types were examined by Western blotting. The IgG2a, IgG2b, and both IgG1s reacted well with recombinant ARP5 protein on the blot, while the IgM did not (Supplemental Fig. 1C).
4. Discussion
The scientific goal of this research was to identify a molecular mechanism for producing hybridomas that expressed high levels of the membrane form of the secreted Ab in the BCR complex. The technical goal was to define a method for efficiently isolating hybridomas by capitalizing on the cell sorting and cloning power of FACS. From reconstruction experiments with an existing IgG1-producing hybridoma and from new hybridoma fusions made with the engineered SP2ab myeloma line, it was clear that transgenic Igα expression was necessary and sufficient for high levels of Ig surface expression for all but one Ig isotype tested (IgG2a). Because Igβ was expressed endogenously in the SP2/0 and SP2ab myeloma parents, and in the hybridomas examined in all our experiments, the role of Igβ was not determined. However, it would make sense if both Igα and Igβ had to be expressed equivalently to achieve the highest levels of membrane Ig surface expression, because the two proteins function synergistically to aid in trafficking the BCR to the cell surface (Wienands et al., 1990; Reth et al., 1991; Wienands and Reth, 1991). Data showing SP2ab-derived hybridomas efficiently produce both the BCR complex and secreted Ab disproves one negative scenario that argued against the viable development of DiSH: the case in which the known phosphorylation of tyrosine residues within the immuno-receptor tyrosine-based activation motif (ITAM) of cytoplasmic domains of Igα and Igβ, which occurs as part of normal signaling from the BCR complex, would prevent the simultaneous secretion of Ab and surface expression of BCR (Cassard et al., 1996; Reichlin et al., 2001; Fuentes-Panana et al., 2005).
We observed endogenous cell surface Ig on 5% to 20% of the cell population for about 60% of the non-IgG2a hybridoma lines derived from our standard SP2/0 myeloma parent, and no detectable surface Ig in the remaining lines. However, it was unclear whether these generally very low levels of surface Ig had associated receptor proteins given that we could not detect Igα subunit expression in any SP2/0 derived hybridomas. Hence, weak trafficking of membrane Ig to the cell surface may not require the formation of a complete BCR complex. Expression of surface Ig has been reported for standard hybridomas expressing IgG2a (McKinney et al., 1991) and IgM (Jahn et al., 1987) and for plasmacytomas expressing IgG2b (Meilhoc et al., 1989) without artificially enhancing Igα expression. We observed moderate membrane-associated Ig levels for three IgG2a-expressing lines derived from SP2/0, but only low to barely detectable levels for hybridomas expressing other isotypes including six independent IgM lines. Earlier attempts using FACS to identify hybridomas based on endogenous levels of cell surface Ig (Parks et al., 1979; Meilhoc et al., 1989) appear to have relied on the small subset of cells in some hybridoma populations or on modest surface Ig expression for IgG2a producing hybridomas. Perhaps the atypically long C-terminal hydrophobic tail of the IgG2a HCm is sufficient to target this isotype to the plasma membrane. Alternatively, secretion dynamics may play a role in Ig surface expression of some hybridomas (Meilhoc, 1989). Regardless of these phenomena, increasing Igα expression as reported herein results in consistent, stable surface expression of all Ig isotypes in nearly all fused B cell populations, and fully enables FACS technology as a way to identify specific hybridoma cells.
A significant three-fold increase in the stability of Ab production was observed for hybridomas isolated by DiSH, as compared to the stability of Ab production for hybridomas isolated by LDS (Tables 1 to 3). This improvement in stability contributes significantly to the utility of DiSH, compared with tremendous amounts of time and labor that are lost in hunting down unstable clones during LDS. Among the explanations for DiSH improving Ab production stability are 1) the brief growth period prior to sorting might allow more stable karyotypes to establish themselves, 2) the relatively early cloning event prevents overgrowth by uninteresting hybridomas, 3) the criteria of HCm synthesis and strong surface expression of the BCR used during DiSH may not occur in less stable hybridomas, and 4) expression of the Ig-receptor proteins Igα and Igβ may stabilize antibody production in otherwise less stable hybridomas. This latter possibility is supported by the fact that ITAM domains of Igα and Igβ are known to be involved in signaling some aspects of B cell development (Cassard et al., 1996; Reichlin et al., 2001). We found that an altered Igα transgene, with the four active tyrosines in the ITAM mutated to phenylalanines, would not generate surface expression of the BCR in hybridomas (unpublished data). Hence, signaling from the transgenic Igα receptor may in fact contribute to the stable BCR expressing phenotype of DiSH hybridomas.
The out growth of the hybridoma population prior to sorting was included in the DiSH protocol to adjust for the loss of some cells during single cell sorting, but this also resulted in our obtaining a number of sibling clones as we determined for two example fusions. In our experience the ease of isolating large numbers of hybridomas by DiSH greatly outweighs the extra labor of having to deal with some sibling clones. With an average process time of 25 days from harvest to screening, we note a dramatic reduction in time spent on repeated cycles of limiting dilution and screening as well as a reduction in the use of disposables. Indeed, over the course of one calendar year, two individuals using DiSH were able to generate over one thousand clones with an estimated 40% sibling rate. In comparison, an industrial laboratory with a staff of five, using traditional fusion and LDS were able to generate 60 unique clones over one calendar year, with a turnover of about 12 weeks per experiment (personal communication).
The constitutive transgenic expression of Igα/Igβ in other myelomas used as the immortal parents in fusions to make hybridomas gave the same general result we obtained for SP2ab. For example, we have made Igα and Igβ expressing derivatives of the commonly used myelomas, NS/0 (ECACC #85110503) and FO (ATCC #CRL-1646), to generate NSab and FOab, respectively. Both Igα/Igβ expressing myeloma lines produced hybridomas that stably express the BCR complex and can be isolated by FACS (not shown).
Consistent with Meilhoc’s results (1989) we did not find a quantitative correlation between the levels of surface Ig expression and the levels of secretion for SP2ab derived hybridomas. We did find a strict correlation between surface Ig expression and antibody secretion. Clones re-isolated for surface expression always secreted antibody. This highlights another important utility of DiSH technology, regarding stored hybridoma lines recovered from frozen cultures. After long-term storage, a standard hybridoma culture may display diminished secretory capabilities for a large percentage of the cells and require a few labor intensive rounds of LDS to isolate a productive clonal line secreting Ab. In contrast, labeling the surface Ig of a few thousand SP2ab-derived hybridomas with fluorescent GAM Ig and subjecting them to FACS, resulted in the re-isolation of clonal hybridoma cell lines that all secreted the desired Ab. This will represent a significant benefit to any laboratory working with hybridomas.
5. Conclusion
More and higher-affinity mAbs are needed for clinical research and newer, improved, faster and more efficient technologies are needed to keep pace with the ever increasing demand for mAbs for use as therapeutic, diagnostic, and research agents. This paper describes the development of one such technology for the rapid selection of hybridomas. We have shown that Igα receptor expression is all that limits strong surface expression of the BCR complex in hybridomas. The transgenic Igα and Igβ over-expressing myeloma cell lines described herein can be used as a fusion partners to produce hybridomas that express significant levels of the membrane isovariant of the Ab secreted by the hybridoma. We have shown that the cell-surface expression of membrane immunoglobulin facilitates the use of fluorescent-labeled antigen as a tag to identify relevant hybridoma cell lines, and to subsequently sort them from the rest of the cell fusion population by FACS, and to recover them quickly from frozen cultures.
DiSH enables the rapid development of stable hybridoma cells that significantly improve the cycle time for isolating positive mAbs for therapeutic and diagnostic development purposes.
The technology was patented in 2006 (Meagher, 2006) and is owned by the University of Georgia Research Foundation and licensed exclusively to Abeome Corporation. Our current efforts are focused on using DiSH to accelerate the development of mAbs to membrane antigens on cancer cells.
Supplementary Material
Acknowledgments
We wish to thank Yolanda Lay, Gay Gragson, Lorraine Aron, Ruth Davis, Anthony Truong, Crystal Jackson, Huizhong Chen, Julie Nelson, and Aissa Villareal-Singh for their advice and assistance. Dennis Bagarrozzi generously supplied the samples of influenza virus. This work was supported by funds from the University of Georgia’s Research Foundation; the Georgia Research Alliance; Abeome Corporation (Athens, GA); and grants to RBM (National Institutes of Health, GM36397) and CM (CA86433) and to LM (Canadian Institutes of Health Research and the National Science and Engineering Research Council of Canada).
Footnotes
Competing interests statement
The authors declare there are no competing financial interests.
Publisher's Disclaimer: This is a PDF file of an unedited manuscript that has been accepted for publication. As a service to our customers we are providing this early version of the manuscript. The manuscript will undergo copyediting, typesetting, and review of the resulting proof before it is published in its final citable form. Please note that during the production process errors may be discovered which could affect the content, and all legal disclaimers that apply to the journal pertain.
References
- Antczak DF. Monoclonal antibodies: technology and potential use. J Am Vet Med Assoc. 1982;181:1005. [PubMed] [Google Scholar]
- Babcook JS, Leslie KB, Olsen OA, Salmon RA, Schrader JW. A novel strategy for generating monoclonal antibodies from single, isolated lymphocytes producing antibodies of defined specificities. Proc Natl Acad Sci U S A. 1996;93:7843. doi: 10.1073/pnas.93.15.7843. [DOI] [PMC free article] [PubMed] [Google Scholar]
- Bradford MM. A rapid and sensitive method for the quantitation of microgram quantities of protein utilizing the principle of protein-dye binding. Anal Biochem. 1976;72:248. doi: 10.1016/0003-2697(76)90527-3. [DOI] [PubMed] [Google Scholar]
- Cairncross JG, Mattes MJ, Beresford HR, Albino AP, Houghton AN, Lloyd KO, Old LJ. Cell surface antigens of human astrocytoma defined by mouse monoclonal antibodies: identification of astrocytoma subsets. Proc Natl Acad Sci U S A. 1982;79:5641. doi: 10.1073/pnas.79.18.5641. [DOI] [PMC free article] [PubMed] [Google Scholar]
- Cassard S, Choquet D, Fridman WH, Bonnerot C. Regulation of ITAM signaling by specific sequences in Ig-beta B cell antigen receptor subunit. J Biol Chem. 1996;271:23786. doi: 10.1074/jbc.271.39.23786. [DOI] [PubMed] [Google Scholar]
- Condon C, Hourihane SL, Dang-Lawson M, Escribano J, Matsuuchi L. Aberrant trafficking of the B cell receptor Ig-alpha beta subunit in a B lymphoma cell line. J Immunol. 2000;165:1427. doi: 10.4049/jimmunol.165.3.1427. [DOI] [PubMed] [Google Scholar]
- Draber P, Zikan J, Vogtiskova M. Establishment and characterization of permanent murine hybridomas secreting monoclonal anti-thy-1 antibodies. J Immunogenet. 1980;7:455. doi: 10.1111/j.1744-313x.1980.tb00741.x. [DOI] [PubMed] [Google Scholar]
- Edwalds-Gilbert G, Veraldi KL, Milcarek C. Alternative poly(A) site selection in complex transcription units: means to an end? Nucleic Acids Res. 1997;25:2547. doi: 10.1093/nar/25.13.2547. [DOI] [PMC free article] [PubMed] [Google Scholar]
- Frankel AE, Rouse RV, Herzenberg LA. Human prostate specific and shared differentiation antigens defined by monoclonal antibodies. Proc Natl Acad Sci U S A. 1982;79:903. doi: 10.1073/pnas.79.3.903. [DOI] [PMC free article] [PubMed] [Google Scholar]
- Fuentes-Panana EM, Bannish G, van der Voort D, King LB, Monroe JG. Ig alpha/Ig beta complexes generate signals for B cell development independent of selective plasma membrane compartmentalization. J Immunol. 2005;174:1245. doi: 10.4049/jimmunol.174.3.1245. [DOI] [PubMed] [Google Scholar]
- Genovese C, Harrold S, Milcarek C. Differential mRNA stabilities affect mRNA levels in mutant mouse myeloma cells. Somat Cell Mol Genet. 1991;17:69. doi: 10.1007/BF01233206. [DOI] [PubMed] [Google Scholar]
- Glennie MJ, van de Winkel JG. Renaissance of cancer therapeutic antibodies. Drug Discov Today. 2003;8:503. doi: 10.1016/s1359-6446(03)02714-4. [DOI] [PubMed] [Google Scholar]
- Hanania EG, Fieck A, Stevens J, Bodzin LJ, Palsson BO, Koller MR. Automated in situ measurement of cell-specific antibody secretion and laser-mediated purification for rapid cloning of highly-secreting producers. Biotechnol Bioeng. 2005;91:872. doi: 10.1002/bit.20559. [DOI] [PubMed] [Google Scholar]
- Hancock RE, Wieczorek AA, Mutharia LM, Poole K. Monoclonal antibodies against Pseudomonas aeruginosa outer membrane antigens: isolation and characterization. Infect Immun. 1982;37:166. doi: 10.1128/iai.37.1.166-171.1982. [DOI] [PMC free article] [PubMed] [Google Scholar]
- Harlow E, Lane DP. Antibodies: A Laboratory Manual. CSH Laboratory Press; Coldspring Harbor, NY: 1988. [Google Scholar]
- Hombach J, Lottspeich F, Reth M. Identification of the genes encoding the IgM-alpha and Ig-beta components of the IgM antigen receptor complex by amino-terminal sequencing. Eur J Immunol. 1990;20:2795. doi: 10.1002/eji.1830201239. [DOI] [PubMed] [Google Scholar]
- Hughes EN, August JT. Characterization of plasma membrane proteins identified by monoclonal antibodies. J Biol Chem. 1981;256:664. [PubMed] [Google Scholar]
- Jahn S, Grunow R, Kiessig ST, Bogacheva GT, Arsenjeva EL, Hlinak A, Rocklin OV, von Baehr R. Cell biology of human IgM-producing hybridomas derived from a fusion of human spleen lymphocytes with mouse myeloma cells. Hybridoma. 1987;6:679. doi: 10.1089/hyb.1987.6.679. [DOI] [PubMed] [Google Scholar]
- Jakobovits A, Amado RG, Yang X, Roskos L, Schwab G. From XenoMouse technology to panitumumab, the first fully human antibody product from transgenic mice. Nat Biotechnol. 2007;25:1134. doi: 10.1038/nbt1337. [DOI] [PubMed] [Google Scholar]
- Kandasamy MK, McKinney EC, Meagher RB. The late pollen-specific actins in angiosperms. Plant J. 1999;18:681. doi: 10.1046/j.1365-313x.1999.00487.x. [DOI] [PubMed] [Google Scholar]
- Kohler G, Milstein C. Continuous cultures of fused cells secreting antibody of predefined specificity. 1975. J Immunol. 1975;174:2453. [PubMed] [Google Scholar]
- Lassman CR, Matis S, Hall BL, Toppmeyer DL, Milcarek C. Plasma cell-regulated polyadenylation at the Ig gamma 2b secretion-specific poly(A) site. J Immunol. 1992;148:1251. [PubMed] [Google Scholar]
- Levy R, Dilley J, Fox RI, Warnke R. A human thymus-leukemia antigen defined by hybridoma monoclonal antibodies. Proc Natl Acad Sci U S A. 1979;76:6552. doi: 10.1073/pnas.76.12.6552. [DOI] [PMC free article] [PubMed] [Google Scholar]
- Li Y, Kandasamy MK, Meagher RB. Rapid isolation of monoclonal antibodies. Monitoring enzymes in the phytochelatin synthesis pathway. Plant Physiol. 2001;127:711. [PMC free article] [PubMed] [Google Scholar]
- Maggon K. Monoclonal antibody “gold rush”. Curr Med Chem. 2007;14:1978. doi: 10.2174/092986707781368504. [DOI] [PubMed] [Google Scholar]
- Marks JD, Hoogenboom HR, Bonnert TP, McCafferty J, Griffiths AD, Winter G. By-passing immunization. Human antibodies from V-gene libraries displayed on phage. J Mol Biol. 1991;222:581. doi: 10.1016/0022-2836(91)90498-u. [DOI] [PubMed] [Google Scholar]
- Matis SA, Martincic K, Milcarek C. B-lineage regulated polyadenylation occurs on weak poly(A) sites regardless of sequence composition at the cleavage and downstream regions. Nucleic Acids Res. 1996;24:4684. doi: 10.1093/nar/24.23.4684. [DOI] [PMC free article] [PubMed] [Google Scholar]
- Matsuuchi L, Gold MR, Travis A, Grosschedl R, DeFranco AL, Kelly RB. The membrane IgM-associated proteins MB-1 and Ig-beta are sufficient to promote surface expression of a partially functional B-cell antigen receptor in a nonlymphoid cell line. Proc Natl Acad Sci U S A. 1992;89:3404. doi: 10.1073/pnas.89.8.3404. [DOI] [PMC free article] [PubMed] [Google Scholar]
- McKinney EC, Kandasamy MK, Meagher RB. Arabidopsis contains ancient classes of differentially expressed actin-related protein genes. Plant Physiol. 2002;128:997. doi: 10.1104/pp.010906. [DOI] [PMC free article] [PubMed] [Google Scholar]
- McKinney KL, Dilwith R, Belfort G. Manipulation of heterogeneous hybridoma cultures for overproduction of monoclonal antibodies. Biotechnol Prog. 1991;7:445. doi: 10.1021/bp00011a010. [DOI] [PubMed] [Google Scholar]
- Meagher RB. Rapid Production of Monoclonal Antibodies. Office, U.S.P. 7,148,040. United States: US PATENT APPLICATION SERIAL. 2006
- Meagher RB, Deal RB, Kandasamy MK, McKinney EC. Nuclear actin-related proteins as epigenetic regulators of development. Plant Physiol. 2005;139:1576. doi: 10.1104/pp.105.072447. [DOI] [PMC free article] [PubMed] [Google Scholar]
- Meilhoc E, Wittrup KD, Bailey JE. Application of flow cytometric measurement of surface IgG in kinetic analysis of monoclonal antibody synthesis and secretion by murine hybridoma cells. J Immunol Methods. 1989;121:167. doi: 10.1016/0022-1759(89)90157-9. [DOI] [PubMed] [Google Scholar]
- Milcarek C, Hall B. Cell-specific expression of secreted versus membrane forms of immunoglobulin gamma 2b mRNA involves selective use of alternate polyadenylation sites. Mol Cell Biol. 1985;5:2514. doi: 10.1128/mcb.5.10.2514. [DOI] [PMC free article] [PubMed] [Google Scholar]
- Milcarek C, Suda-Hartman M, Croll SC. Changes in abundance of IgG 2a mRNA in the nucleus and cytoplasm of a murine B-lymphoma before and after fusion to a myeloma cell. Mol Immunol. 1996;33:691. doi: 10.1016/0161-5890(96)00009-0. [DOI] [PubMed] [Google Scholar]
- Milstein C. The hybridoma revolution: an offshoot of basic research. Bioessays. 1999;21:966. doi: 10.1002/(SICI)1521-1878(199911)21:11<966::AID-BIES9>3.0.CO;2-Z. [DOI] [PubMed] [Google Scholar]
- O’Reilly LA, Cullen L, Moriishi K, O’Connor L, Huang DC, Strasser A. Rapid hybridoma screening method for the identification of monoclonal antibodies to low-abundance cytoplasmic proteins. Biotechniques. 1998;25:824. doi: 10.2144/98255st03. [DOI] [PubMed] [Google Scholar]
- Parks DR, Bryan VM, Oi VT, Herzenberg LA. Antigen-specific identification and cloning of hybridomas with a fluorescence-activated cell sorter. Proc Natl Acad Sci U S A. 1979;76:1962. doi: 10.1073/pnas.76.4.1962. [DOI] [PMC free article] [PubMed] [Google Scholar]
- Prokop A, Prokop Z, Schaffer D, Kozlov E, Wikswo J, Cliffel D, Baudenbacher F. NanoLiterBioReactor: long-term mammalian cell culture at nanofabricated scale. Biomed Microdevices. 2004;6:325. doi: 10.1023/B:BMMD.0000048564.37800.d6. [DOI] [PubMed] [Google Scholar]
- Reichlin A, Hu Y, Meffre E, Nagaoka H, Gong S, Kraus M, Rajewsky K, Nussenzweig MC. B cell development is arrested at the immature B cell stage in mice carrying a mutation in the cytoplasmic domain of immunoglobulin beta. J Exp Med. 2001;193:13. doi: 10.1084/jem.193.1.13. [DOI] [PMC free article] [PubMed] [Google Scholar]
- Reth M, Hombach J, Wienands J, Campbell KS, Chien N, Justement LB, Cambier JC. The B-cell antigen receptor complex. Immunol Today. 1991;12:196. doi: 10.1016/0167-5699(91)90053-V. [DOI] [PubMed] [Google Scholar]
- Schamel WW, Reth M. Stability of the B cell antigen receptor complex. Mol Immunol. 2000;37:253. doi: 10.1016/s0161-5890(00)00025-0. [DOI] [PubMed] [Google Scholar]
- Seegmiller AC, Xu Y, McKenna RW, Karandikar NJ. Immunophenotypic differentiation between neoplastic plasma cells in mature B-cell lymphoma vs plasma cell myeloma. Am J Clin Pathol. 2007;127:176. doi: 10.1309/5EL22BH45PHUPM8P. [DOI] [PubMed] [Google Scholar]
- Staszewski R. Cloning by limiting dilution: an improved estimate that an interesting culture is monoclonal. Yale J Biol Med. 1984;57:865. [PMC free article] [PubMed] [Google Scholar]
- Tam JP. Synthetic peptide vaccine design: synthesis and properties of a high-density multiple antigenic peptide system. Proc Natl Acad Sci U S A. 1988;85:5409. doi: 10.1073/pnas.85.15.5409. [DOI] [PMC free article] [PubMed] [Google Scholar]
- Ugolini V, Nunez G, Smith RG, Stastny P, Capra JD. Initial characterization of monoclonal antibodies against human monocytes. Proc Natl Acad Sci U S A. 1980;77:6764. doi: 10.1073/pnas.77.11.6764. [DOI] [PMC free article] [PubMed] [Google Scholar]
- Wang Z, Raifu M, Howard M, Smith L, Hansen D, Goldsby R, Ratner D. Universal PCR amplification of mouse immunoglobulin gene variable regions: the design of degenerate primers and an assessment of the effect of DNA polymerase 3′ to 5′ exonuclease activity. J Immunol Methods. 2000;233:167. doi: 10.1016/s0022-1759(99)00184-2. [DOI] [PubMed] [Google Scholar]
- Wewetzer K, Seilheimer B. Establishment of a single-step hybridoma cloning protocol using an automated cell transfer system: comparison with limiting dilution. J Immunol Methods. 1995;179:71. doi: 10.1016/0022-1759(94)00274-z. [DOI] [PubMed] [Google Scholar]
- White RA, Mason DW, Williams AF, Galfre G, Milstein C. T-lymphocyte heterogeneity in the rat: separation of functional subpopulations using a monoclonal antibody. J Exp Med. 1978;148:664. doi: 10.1084/jem.148.3.664. [DOI] [PMC free article] [PubMed] [Google Scholar]
- Wienands J, Hombach J, Radbruch A, Riesterer C, Reth M. Molecular components of the B cell antigen receptor complex of class IgD differ partly from those of IgM. Embo J. 1990;9:449. doi: 10.1002/j.1460-2075.1990.tb08130.x. [DOI] [PMC free article] [PubMed] [Google Scholar]
- Wienands J, Reth M. The B cell antigen receptor of class IgD can be expressed on the cell surface in two different forms. Eur J Immunol. 1991;21:2373. doi: 10.1002/eji.1830211012. [DOI] [PubMed] [Google Scholar]
- Yamawaki-Kataoka Y, Nakai S, Miyata T, Honjo T. Nucleotide sequences of gene segments encoding membrane domains of immunoglobulin gamma chains. Proc Natl Acad Sci U S A. 1982;79:2623. doi: 10.1073/pnas.79.8.2623. [DOI] [PMC free article] [PubMed] [Google Scholar]
Associated Data
This section collects any data citations, data availability statements, or supplementary materials included in this article.