

Abstract
The effect of glottal aerodynamics in producing the nonlinear characteristics of voice is investigated by comparing the outputs of the asymmetric composite model and the two-mass model. The two-mass model assumes the glottal airflow to be laminar, nonviscous, and incompressible. In this model, when the asymmetric factor is decreased from 0.65 to 0.35, only 1:1 and 1:2 modes are detectable. However, with the same parameters, four vibratory modes (1:1, 1:2, 2:4, 2:6) are found in the asymmetric composite model using the Navier-Stokes equations to describe the complex aerodynamics in the glottis. Moreover, the amplitude of the waveform is modulated by a small-amplitude noiselike series. The nonlinear detection method reveals that this noiselike modulation is not random, but rather it is deterministic chaos. This result agrees with the phenomenon often seen in voice, in which the voice signal is strongly periodic but modulated by a small-amplitude chaotic component. The only difference between the two-mass model and the composite model is in their descriptions of glottal airflow. Therefore, the complex aerodynamic characteristics of glottal airflow could be important in generating the nonlinear dynamic behavior of voice production, including bifurcation and a small-amplitude chaotic component obscured by strong periodicity.
I. INTRODUCTION
The bifurcation and chaos phenomena related with nonlinear systems are widely observed in physical and biological systems, such as electronic circuits [1], superconductors [2], neurology [3], and cardiology [4]. Nonlinear dynamic theory provides deeper insight into these complex natural phenomena. The voice of a vertebrate is generated by a highly nonlinear oscillator, comprised of the vocal folds and glottal air-flow. Rich nonlinear phenomena, including subharmonics, diplophonic, double period doubling bifurcation, chaos, and spatiotemporal chaos, have been observed in birdsong [5–7], human voice [8], the cries of newborn infants [9], excised larynx experiments [10], and the calls of mammals [11,12]. Knowledge of the nonlinear components of voice is expected to be useful for understanding voice production [13], improving the realistic synthesis of voice [14], and providing potential clinical applications in assessment and treatment of voice diseases [15]. Therefore, the nonlinear dynamics in voice production have recently received considerable attention.
Several models have been used to investigate the generation of nonlinear dynamics in voice [13,14,16–21]. Irregular vibration patterns were initially detected in a two-mass model with a sufficiently large left-right tension imbalance [13]. Bifurcations and chaos were then predicted by a symmetric vocal fold model with tissue parameters obviously deviating from the normal values [16]. Irregular vocal fold oscillations were also found in the continuous model with soft tissue [20] and pathological phonation [21]. These studies suggest that abnormalities in vocal tissue are important causes of irregular vocal fold vibration. The introduction of random perturbations into a vocal fold model has been found to decrease the threshold value necessary for a system to produce irregular vocal fold vibration [17]. Recently, by considering the source-filter acoustic interaction, delayed feedback due to reflected sound in the vocal tract was shown to contribute to extremely rich dynamics, such as period doubling bifurcation and nonperiodic oscillation [18]. These studies explain the cause of rough voice production and irregular vibrations of vocal folds that are typical of many vocal diseases.
Glottal airflow plays an important role in voice production because vocal fold vibrations are generated by the fluid-tissue interaction. It is known that real fluid is very complex, and various dynamical behaviors can be found in real fluid, including asymmetry, vortices, turbulence [22,23], bifurcation [24], and spatiotemporal chaos [25,26]. These phenomena are also components of glottal airflow [27–35]. These complexities of glottal airflow could be responsible for variation in the phonation threshold pressure [36] and for the asymmetric vibration of the vocal fold [37]. However, this causal linkage was not considered in most of the previous studies of irregular vocal fold vibration because the airflow was often simplified in accordance with Bernoulli’s law and the laminar, nonviscous, and incompressible assumption. Few works have studied the influence of the complex spatiotemporal behaviors of glottal airflow on the vocal fold vibration, particularly irregular vibrations.
In this study, we simulated and analyzed the contribution of the complexity of glottal airflow on irregular vocal fold vibration. The Navier-Stokes (NS) equations were used to predict the spatiotemporal behavior of glottal aerodynamics, and the tissue mechanics of the vocal folds were simplified to an asymmetric two-mass model. The interaction of the vocal fold and the glottal airflow generates self-oscillation. Using this model, we studied the various oscillatory patterns of vocal folds. To investigate the effect of airflow on vocal fold vibration, the dynamic behaviors of the vocal folds when driven by an airflow description based on the NS equations and when driven by an airflow description based on Bernoulli’s law were compared. The nonlinear detection method proposed by Barahona and Poon [4,38,39], which has the ability to detect the nonlinearity in a short, strong periodic series, was used to analyze the nonlinear characteristics of vocal fold vibration.
II. MODEL AND ANALYSIS METHOD
A. Asymmetric composite vocal-fold model
An asymmetric composite model, developed from the composite model [37], was employed to predict the vocal fold vibrations induced by complex airflow. The asymmetric two-mass model [13,40] was used to describe the tissue mechanics of vocal folds with unilateral laryngeal paralysis,
| (1) |
The displacement vector xα is written as . The velocity vectors v, relating with xα and the tissue parameter vector μtα, can be described as
| (2) |
where xiα is the displacement of mass miα, riα is the damping constant, kiα is the spring constant, L is the length of the glottis, ciα=3kiα is the additional spring constant during collision, and kcα is the coupling constant between the upper and lower masses. The index i denotes the inferior (i=1) and superior masses (i=2), while the index α represents right (α=r) and left (α=l) masses. The term a1α=a01+ (x1r +x1l)L is the lower glottal area and a2α=a02+ (x2r + x2l)L is the upper glottal area, where a0i refers to the prephonatory glottal areas. The term Θ(−aiα)ciαaiα/2L represents collision with
| (3) |
Unilateral laryngeal paralysis is modeled as follows:
| (4) |
where Q is the asymmetric factor. The other parameters of the left vocal fold are identical with those of the right vocal fold. Table I presents the lumped-mass parameters used in the simulation.
TABLE I.
Parameter values.
| Parameter | Value | |
|---|---|---|
| m1α | Lower mass | 0.125 g |
| m2α | Upper mass | 0.025 g |
| k1α | Lower spring constant | 80 kdyn/cm |
| k2α | Upper spring constant | 8 kdyn/cm |
| kcα | Coupling spring constant | 25 kdyn/cm |
| r1α | Damping constant | 20 g/s |
| r2α | Damping constant | 20 g/s |
The intraglottal airflow force vector Fα applied to the vocal fold surface provides the driving force for the vocal fold vibration and can be defined as
| (5) |
where d1α is the thickness of mass m1α and pα(y) refers to the pressure on the vocal glottis wall. The NS equations are used to describe the spatiotemporal pattern of glottal airflow, that is,
| (6) |
| (7) |
where ρ=1.2 kg/m3 is the flow density, μ=1.8 ×10⁻⁵ N s/m2 is the viscosity, V is the velocity vector, and p is the pressure of flow. The glottal length is 0.3 cm. The prephonatory superior and inferior glottal widths are both 0.178 57 mm. A 2-cm inlet duct and an 8-cm outlet duct represent the trachea and the vocal tract, respectively. Their widths are both 2 cm. Figure 1 illustrates the structure of the airflow channel around the glottis. The no-slip condition was applied to both the tracheal wall and the vocal tract wall. The specified pressure condition was set at the inlet of the sub-glottal tube to drive the model, and the zero pressure boundary condition was set at the outlet of the supraglottal tube. The moving wall condition was applied to the fluid-solid interaction boundary. Using the given boundary condition, the flow pressure p can be solved using the NS equations.
FIG. 1.

The system diagram of the composite vocal fold model.
In our simulation, the NS equations and the two-mass vibration model were fully coupled and simultaneously solved in every iteration step. The values of the glottal displacements and the velocities solved from the two-mass model were applied to the glottal wall to define the boundary condition. Simultaneously, the airflow pressure solved from NS equations was applied as the driving force for the two-mass model. By alternating between solving the NS equations and solving the asymmetric two-mass equation, a self-oscillating solution was obtained from the iterative process. The NS equations were solved by using the FLOTRAN CFD analysis of the finite-element software ANSYS. A custom program was developed in ANSYS Parametric Design Language to solve the two-mass equation with the fourth-order Runge-Kutta routine and manage the airflow-tissue interaction. In the time domain, both the NS equations and the two-mass equation were integrated with a time step of 50 μs. Before the above model was used in this study, we halved the grid spacing, reduced the time step and the convergence criteria by a factor of 10, and reran the simulation. The solution is essentially the same as before. The tests verified that this model is independent of the grid size, time step, and convergence criteria [37,41,42]. The aerodynamic outputs of this model were also compared with previous static model simulations and experimental measurements [27–30] in a symmetric situation (Q=1). It was found that glottal aerodynamics, such as the pressure distribution, Coanda effect, and others, can be correctly predicted by this model. More details can be found in our previous paper [37].
B. Nonlinear dynamics detection method
It has been suggested that the strength of nonlinearity in the data can be measured by comparing nonlinear and linear predictability [43], and this concept has been applied to quantify the amount of nonlinearity in the vocalizations of macaque screams, piglet screams, and dog barks [44]. Based on a similar concept, the nonlinear dynamics detection method proposed by Barahona and Poon [38] was used to analyze the nonlinearity of the model output in this study. This nonlinearity detection method is superior when applied to short time series, even when the series is heavily contaminated with noise or in the presence of strong periodicity. As a result, it has been successfully employed to detect chaos in the beat-to-beat interval series of electrocardiograms [4] and in human speech [45]. This method is based on the comparison of the one-step-ahead prediction error of the linear and the nonlinear model. Its procedure is as follows:
For time series xn (n=1, …,N), a discrete Volterra-Wiener-Korenberg series of degree d and memory κ is used as a model to calculate the predicted time series, ,
| (8) |
The coefficient am is estimated through a Gram-Schmidt procedure, and the standard deviations of the one-step-ahead prediction error are calculated,
| (9) |
For each data series, the best linear model (d=1) and the best nonlinear model (d>1) are obtained, respectively, by searching for κlin and κnl, which minimizes
| (10) |
where r ∈ [1,M] is the number of polynomial terms of the truncated Volterra expansions from a certain pair {κ,d}. The minimum C values corresponding with the linear and nonlinear model are Clin and Cnl, respectively. If the best nonlinear model is significantly more predictive than the best linear model (Clin>Cnl), it indicates that the original series is nonlinear. Otherwise, it may be inferred that the original series is not chaotic or the chaotic component is too weak to be detected.
III. RESULTS
During phonation, the high subglottal pressure pushes the left and right vocal folds apart, and air escapes from the lungs through the glottis. High-velocity airflow decreases the glottal airflow pressure, which causes the vocal folds to close. The glottal airflow provides the energy for the vocal fold vibration, so it has an important effect on vocal fold vibration and voice production. Figure 2 presents the spatiotemporal pattern of the downstream glottal airflow with Q=0.64 and Ps =1.0 kPa. The velocity value is detected at the line y=1.0 as shown in Fig. 1. It can be seen that the airflow shows complex behavior in both the time domain and the space domain. In the time domain, the airflow shows a series of pulses because of the glottis’s periodic opening and closing. However, this periodicity of the airflow pulse in the time domain is not strict due to the disturbing effects of vortices and turbulence. In the space domain, the airflow is significantly asymmetric due to the tension asymmetry of the vocal folds and the Coanda effect [27,30,32,37,46]. Previous studies have revealed that external noise could affect the onset of chaos [47,48]. Therefore, the complex spatiotemporal behavior of the aerodynamics could also influence vocal fold vibration and voice production.
FIG. 2.

The spatiotemporal pattern of airflow in the vocal tract.
Figure 3 plots the maxima of x1α as a function of the asymmetric factor Q, which is predicted by the composite model with Ps =1.0 kPa. Rich dynamic behaviors can be found in the composite vocal fold model. The dotted lines 1, 2, 3, and 4 correspond to four typical asymmetric situations, Q=0.64, 0.50, 0.45, and 0.36, respectively. Their corresponding wave forms are illustrated in Figs. 4(a)–4(d).
FIG. 3.

(Color online) The maxima of x1α as a function of the asymmetric factor Q obtained from the composite vocal fold model, where the subglottal pressure is 1.0 kPa. (a) The left vocal fold; (b) the right vocal fold. Both vocal folds exhibit rich dynamic behavior. The dotted lines 1, 2, 3, and 4 correspond to 1:1 mode (Q=0.64), 1:2 mode (Q=0.5), 2:4 mode (Q=0.45), and 2:6 mode (Q=0.36), respectively.
FIG. 4.

(Color online) The waveforms of vocal fold vibration obtained from the composite model. (a) Q=0.64 (1:1 mode); (b) Q=0.50 (1:2 mode); (c) Q=0.45 (2:4 mode); (d) Q=0.36 (2:6 mode), where m:n mode is defined as the different vibration patterns with the ratio of the number of the maxima of x1l and x1r during one total cycle [13].
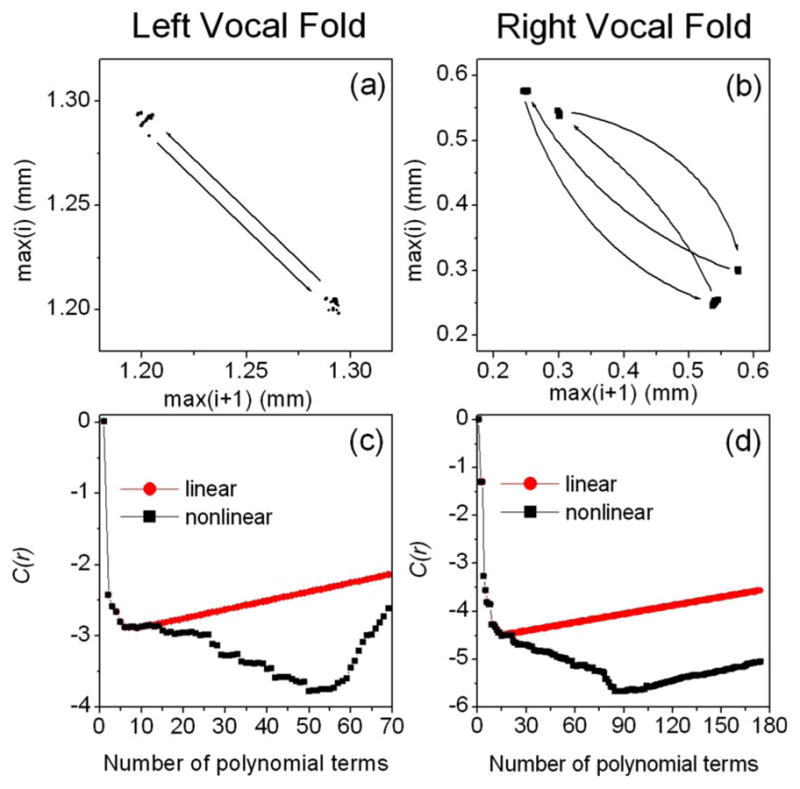
In the following discussion, the different vibration patterns are labeled with the ratio of the number of the maxima of x1l and x1r during one total cycle [13]. An m:n mode (m and n are integrated numbers) denotes that there are m maxima of x1l and n maxima of x1r during one total cycle. At Q=0.64, the waveforms of x1r and x1l obtained from the composite model are approximately periodic. Moreover, the number of the maxima of x1r is the same as the number of the maxima of x1l, as shown in Fig. 4(a). So we can consider the vibration mode to be 1:1 in this situation [13]. However, the periodicity of the composite model is not strict and the amplitude of oscillation fluctuates slightly. The aperiodic characteristic of the waveform can be better observed in the next-maxima plots, as shown in Figs. 5(a) and 5(b), where the y axis is the amplitude value of the ith peak and the x axis is the amplitude value of the next [(i+1)th] peak. It shows that the trajectory obtained from the composite model is scattered within a small domain, rather than being made up of one or several discrete points. This kind of attractor usually indicates a random or chaotic series. By applying Barahona and Poon’s nonlinear dynamics detection method to analyze the dynamic characteristics of the maxima series, we are able to classify it as random or chaotic. It was found that the maxima series is predictable. Furthermore, the nonlinear polynomial is significantly more predictable than the linear polynomial. Figs. 5(c) and 5(d) presents these results, which suggest that the maxima series is not a random noise, but deterministic chaos [38].
FIG. 5.

(Color online) Detection nonlinear dynamics of the maximum series of x1α from the composite model with Q=0.64. (a), (b) The next-maximum maps of x1l and x1r. (c), (d) The C(r) value displayed as a function of the number of polynomial terms. In comparison with the linear polynomial, the more predictive nonlinear polynomial indicates the presence of deterministic chaos in the maximum series.
At Q=0.50, the peak number of the waveform of x1r is almost twice the peak number of x1l, which indicates a 1:2 vibration mode in this situation. Figures 6(a) and 6(b) illustrate the trajectory points of the left and right vocal folds in the next-maxima space. Similar to the situation at Q=0.64, the trajectory is not comprised of discrete points, but is scattered within a certain domain. The trajectory points of the left vocal fold are distributed around (1.10,1.10). However, in contrast to the situation at Q=0.64, the trajectory points of the right vocal fold are grouped in two separate islands. The trajectory evolves in these disconnected domains and alternatively between different points in each of them, as indicated by the arrows. When the island in the next-maxima map of the left vocal fold is visited one time, the two islands in the next-maxima map of the right vocal fold are each visited one time. The ratio of the number of the maxima in the left and right vocal folds is 1:2 in one total cycle. Figures 6(c) and 6(d) present the analysis results of the nonlinear dynamics detection method on the maxima series. The better predictability of the nonlinear polynomial suggests that the maxima series of the left and right vocal folds are both essentially deterministic chaos. In addition, it is noticeable that C(r) of the nonlinear polynomial quickly increases after it has reached a minimum value. This could be a consequence of numerical error due to a large number of high-order nonlinear terms.
FIG. 6.

(Color online) Detection nonlinear dynamics of the maximum series of x1α from the composite model with Q=0.50. (a), (b) The next-maximum maps of x1l and x1r. (c), (d) The C(r) value displayed as a function of the number of polynomial terms. The deterministic chaos is presented in the maximum series.
More complex dynamic behaviors can also be observed in the composite vocal fold model with the decreasing of asymmetric factor Q. At Q=0.45, there are two peaks in the wave-form of x1l and four peaks in the waveform of x1r during one total cycle. In the next-maxima plots, the trajectory points of the left vocal fold are assembled in two separate islands, but the trajectory points of the right vocal fold are separated into four disconnected domains, as shown in Figs. 7(a) and 7(b). These separate islands are periodically visited. During one total cycle, two islands in the next-maxima map of the left vocal fold and four islands of the right vocal fold are visited, indicating a 2:4 mode at Q=0.45. Under this strong periodicity, the deterministic chaos can also be detected. Figures 7(c) and 7(d) illustrate the results of the nonlinear dynamics detection method. It was found that the nonlinear polynomial is much more predictable than the linear polynomial, so the maxima series is essentially deterministic chaos. Similarly, at Q=0.36, the vocal fold vibration is in 2:6 mode and the maxima series was noted to be deterministic chaos as well.
FIG. 7.
(Color online) Detection nonlinear dynamics of the maximum series of x1α from the composite model with Q=0.45. (a), (b) The next-maximum maps of x1l and x1r. (c), (d) The C(r) value displayed as a function of the number of polynomial terms. The deterministic chaos is presented in the maximum series.
In addition, Steinecke and Herzel found that two different modes could coexist in an asymmetric two-mass model [13]. Moreover, the borderline between the basin attractions of both modes is smooth; therefore, rather weak perturbations may induce abrupt jumps to other regimes. In this study, besides the four typical 1:1, 1:2, 2:4, and 2:6 modes, we also found a transient mode in which the system switches from one mode to another mode. For example, at Q=0.56, the system sometimes showed a 1:1 mode, and sometimes showed a 1:2 mode. The transient mode might be the result of jumps between two coexisting modes due to aerodynamic perturbations.
The above simulation based on the asymmetric composite model showed rich dynamic behaviors. In order to investigate the role of glottal airflow in generating these dynamic behaviors, we also simulated the vocal fold vibration using the asymmetric two-mass model, where the glottal aerodynamics is simplified to Bernoulli’s relationship. Figure 8 plots the maxima of x1α as a function of the asymmetric factor Q, which is calculated from the asymmetric two-mass model with Ps =1.0 kPa. Just two kinds of dynamic behaviors can be found in the asymmetric two-mass model when the asymmetric factor Q is decreased from 0.65 to 0.35. When 0.476<Q≤0.65, the left and right vocal folds show 1:1 mode, as shown in Fig. 9(a). When Q is decreased below 0.476, the ratio of the left maxima number to the right maxima number shifts to 1:2, as shown in Fig. 9(b).
FIG. 8.

(Color online) The maxima of x1α as a function of the asymmetric factor Q obtained from the asymmetric two-mass model, where the subglottal pressure is 1.0 kPa (Ps =0.01). (a) The left vocal fold; (b) the right vocal fold. When 0.476<Q≤0.65, the left and right vocal folds show a 1:1 mode. When 0.35≤Q < 0.476, the left and right vocal folds show a 1:2 mode.
FIG. 9.

(Color online) The waveforms of vocal fold vibrations obtained from the asymmetric two-mass model. (a) Q=0.6 (1:1 mode); (b) Q=0.45 (1:2 mode).
In addition, we can see that the waveform predicted by the two-mass model is strictly periodic, which also diverges from the results predicted by the composite model. The strict periodicity can easily be displayed by the next-maxima plots. Figure 10(a) presents the next-maxima plots of the right vocal fold at Q=0.45. It can be observed that the trajectories are concentrated in two individual points, but are not separated into two distinct domains. The trajectory alternates between the two points. The vocal folds follow a strict double periodic oscillation. The nonlinear dynamics detection method shows that the nonlinear polynomial and linear polynomial are similarly predictive [see Fig. 10(b)], which con-firms that the double period series from the two-mass model is regular and periodic, rather than chaotic.
FIG. 10.

(Color online) Nonlinear analysis on the maximum series of x1r from the asymmetric two-mass model with Q =0.45. (a) The next-maximum maps; (b) the nonlinear detection.
The only difference between the two-mass model and the composite model is in their descriptions of glottal airflow. In the two-mass model, the glottal airflow is assumed to be laminar, nonviscous, and incompressible. The various dynamical behaviors of glottal airflow are ignored. However, in a composite model, the NS equations include a more vivid and accurate description of the airflow than does Bernoulli’s law. The NS equations can predict complex spatiotemporal behaviors of airflow. We believe that the different dynamic behaviors predicted by the two different models are caused by this discrepancy between glottal airflow descriptions. The rich dynamic behaviors of the composite model could be related to the aerodynamic characteristics of glottal airflow. Therefore, the above comparison indicates that the complexity of glottal airflow could be one possible reason for the chaotic component in the voice production system.
IV. DISCUSSION AND CONCLUSION
Previous voice analyses have shown that the voices produced by mammals and birds have significant nonlinear characteristics. In the past, these nonlinearities in voice were usually explained by vocal fold asymmetry [13], the source-filter acoustic interaction [19], delayed feedback due to reflected sound in the vocal tract [18], turbulence noise disturbance [17], abnormal biomechanical parameters of vocal fold tissue [16], and extremely high subglottal pressure [10,16]. These theories successfully explain the rough voice that is often related to the pathological conditions of the vocal folds.
However, more general nonlinear phenomena have not been thoroughly explained by these previous studies. It is known that although a normal voice is strongly periodic, small undulations in amplitude still exist. Traditionally, this disturbance of the voice amplitude is treated as a random noise and described by the shimmer parameters. Recently, nonlinear dynamic analysis of the speech signal shows that these nonlinear characteristics can be found even in normal voice with strong periodicity [8,44,45]. These findings indicate that the small-amplitude disturbances in a periodically healthy voice may not be random noise, and may instead be a deterministic signal. This concept is still arguable [49] because the strong periodic characteristics of voice signal often obscure these random undulations, thereby decreasing the reliability of the analysis results of nonlinear dynamic methods. Moreover, the mechanism of production of the random undulation in a periodic voice signal is not completely clear.
Titze has successfully explained the low-frequency voice perturbation as the results of the random nature of motor neuron firing [50,51]. It is known that the sustained muscle contractions are made up of a large number of individual twitches of groups of muscle fibers. A single twitch usually lasts only a fraction of a second. The interval between two twitches varies with the neural signals to fire the twitch. The neurological fluctuations are perceived as unsteadiness in pitch and loudness [50,51]. Besides the random neuron firing, this study indicates that the glottal airflow could be another source of voice perturbation. We found that the output of a composite model is strongly periodic. However, its amplitude value is disturbed by a noiselike disturbance; moreover, the amplitude of this noiselike disturbance is much smaller than the amplitude of the vocal fold vibration. For example, at Q=0.64, the noiselike disturbance amplitude makes up about 1% and 8% of the peak-to-peak amplitude of the left and right vocal folds, respectively. The nonlinear detection method confirms that the noiselike disturbance is not random, but rather it represents deterministic chaos. This simulation suggests that the vocal fold vibration can be considered a periodic signal modulated by a small-amplitude chaotic series. This result is reflected in a similar phenomenon often seen in voice. Although this phenomenon cannot be predicted by the asymmetric two-mass model, it can be observed in the composite model. Therefore, we can say that the small-amplitude chaotic component present in strong periodic voice production systems might be related to the complexities of glottal aerodynamics.
In addition, we also found that in a two-mass model that ignores the complexity of glottal airflow, only two vibratory modes (1:1 mode and 1:2 mode) can be observed within the asymmetric factor range 0.35≤Q≤0.65. However, using a composite model that considers complex glottal airflow, the simulation showed more modes within the same asymmetric factor range, including 1:1 mode, 1:2 mode, 2:4 mode, and 2:6 mode. It is known that the vocal fold tissue and glottal airflow interact with each other during voice production. This suggests that the effect of the airflow force on the vocal fold dynamics is not the corruption of observations by errors that are independent of the dynamics, but a feedback process wherein the system is perturbed by a small random amount at each time step, just like the effect of dynamic noise on a dynamical system [47,48,55]. Previous studies found that the dynamic disturbance could significantly shift the structure of the bifurcation diagram [17,47,48,52–55]. Consequently, this rich dynamic phenomenon in the composite model could also be related to the complex aerodynamics of glottal air-flow.
In a previous study, it was reported that the disrupting effect of noise becomes more significant when the system is close to the bifurcation point corresponding to the onset of sustained oscillations [55]. In this study, our findings based on 1.0 kPa subglottal pressure are obtained well inside the domain of sustained oscillations. When the subglottal pressure is close to the onset value of sustained oscillation, the lower subglottal pressure brings the vocal fold system near to its bifurcation point, which could create a significant chaos-noise effect [55]. On the other hand, the lower subglottal pressure indicates smaller aerodynamic noise and more regular glottal airflow. As a result, it can be expected that sub-glottal pressure is an important parameter that influences the chaotic component of a voice production system, which might be of interest for further study.
In summary, this study found that glottal aerodynamics could greatly contribute to the generation of the nonlinear dynamic behaviors of voice production, such as bifurcation and a small-amplitude chaotic component obscured by strong periodicity. These results might be useful in understanding the dynamic mechanisms of voice production and in improving the quality of speech synthesis.
Acknowledgments
This study was supported by NIH Grants No. 1-RO1DC006019 and No. 1-RO1DC05522 from the National Institute of Deafness and other Communication Disorders.
References
- 1.Cumming A, Linsay PS. Phys Rev Lett. 1988;60:2719. doi: 10.1103/PhysRevLett.60.2719. [DOI] [PubMed] [Google Scholar]
- 2.Crutchfield JP, Huberman BA, Packard NH. Appl Phys Lett. 1980;37:750. [Google Scholar]
- 3.Hornero R, Espino P, Alonso A, Lopez M. IEEE Eng Med Biol Mag. 1999;18:73. doi: 10.1109/51.805149. [DOI] [PubMed] [Google Scholar]
- 4.Poon CS, Merrill CK. Nature. 1997;389:492. doi: 10.1038/39043. [DOI] [PubMed] [Google Scholar]
- 5.Laje R, Mindlin GB. Phys Rev Lett. 2003;91:258104. doi: 10.1103/PhysRevLett.91.258104. [DOI] [PubMed] [Google Scholar]
- 6.Trevisan MA, Mendez JM, Mindlin GB. Phys Rev E. 2006;73:061911. doi: 10.1103/PhysRevE.73.061911. [DOI] [PubMed] [Google Scholar]
- 7.Trevisan MA, Cooper B, Goller F, Mindlin GB. Phys Rev E. 2007;75:031908. doi: 10.1103/PhysRevE.75.031908. [DOI] [PubMed] [Google Scholar]
- 8.Kumar A, Mullick SK. J Acoust Soc Am. 1996;100:615. [Google Scholar]
- 9.Mende W, Herzel H, Wermke K. Phys Lett A. 1990;145:418. [Google Scholar]
- 10.Zhang Y, Jiang JJ. Phys Rev E. 2005;72:035201. doi: 10.1103/PhysRevE.72.035201. [DOI] [PubMed] [Google Scholar]
- 11.Tokuda I, Riede T, Neubauer J, Owren MJ, Herzel H. J Acoust Soc Am. 2002;111:2908. doi: 10.1121/1.1474440. [DOI] [PubMed] [Google Scholar]
- 12.Facchini A, Kantz H, Tiezzi E. Phys Rev E. 2005;72:021915. doi: 10.1103/PhysRevE.72.021915. [DOI] [PubMed] [Google Scholar]
- 13.Steinecke I, Herzel H. J Acoust Soc Am. 1995;97:1874. doi: 10.1121/1.412061. [DOI] [PubMed] [Google Scholar]
- 14.Trevisan MA, Eguia MC, Mindlin GB. Phys Rev E. 2001;63:026216. doi: 10.1103/PhysRevE.63.026216. [DOI] [PubMed] [Google Scholar]
- 15.Tao C, Zhang Y, Du G, Jiang JJ. Phys Rev E. 2004;69:036204. doi: 10.1103/PhysRevE.69.036204. [DOI] [PubMed] [Google Scholar]
- 16.Jiang JJ, Zhang Y, Stern J. J Acoust Soc Am. 2001;110:2120. doi: 10.1121/1.1395596. [DOI] [PubMed] [Google Scholar]
- 17.Jiang JJ, Zhang Y. J Acoust Soc Am. 2002;112:2127. doi: 10.1121/1.1509430. [DOI] [PubMed] [Google Scholar]
- 18.Laje R, Gardner T, Mindlin GB. Phys Rev E. 2001;64:056201. doi: 10.1103/PhysRevE.64.056201. [DOI] [PubMed] [Google Scholar]
- 19.Laje R, Mindlin GB. Phys Rev E. 2005;72:036218. doi: 10.1103/PhysRevE.72.036218. [DOI] [PubMed] [Google Scholar]
- 20.Berry DA, Herzel H, Titze IR, Krischer K. J Acoust Soc Am. 1994;95:3595. doi: 10.1121/1.409875. [DOI] [PubMed] [Google Scholar]
- 21.Neubauer J, Mergell P, Eysholdt U, Herzel H. J Acoust Soc Am. 2001;110:3179. doi: 10.1121/1.1406498. [DOI] [PubMed] [Google Scholar]
- 22.Aitta A, Ahlers G, Cannell DS. Phys Rev Lett. 1985;54:673. doi: 10.1103/PhysRevLett.54.673. [DOI] [PubMed] [Google Scholar]
- 23.Torralba M, Castrejón-Pita AA, Hernández G, Huelsz G, del Río JA, Ortín J. Phys Rev E. 2007;75:056307. doi: 10.1103/PhysRevE.75.056307. [DOI] [PubMed] [Google Scholar]
- 24.Jousse F, Farr R, Link DR, Fuerstman MJ, Garstecki P. Phys Rev E. 2006;74:036311. doi: 10.1103/PhysRevE.74.036311. [DOI] [PubMed] [Google Scholar]
- 25.Xi HW, Li XJ, Gunton JD. Phys Rev Lett. 1997;78:1046. [Google Scholar]
- 26.Das M, Chakrabarti B, Dasgupta C, Ramaswamy S, Sood AK. Phys Rev E. 2005;71:021707. doi: 10.1103/PhysRevE.71.021707. [DOI] [PubMed] [Google Scholar]
- 27.Pelorson X, Hirschberg A, van Hassel RR, Wijnands APJ. J Acoust Soc Am. 1994;96:3416. [Google Scholar]
- 28.Scherer RC, Shinwari D, DeWitt KJ, Zhang C, Kucinschi BR, Afjeh AA. J Acoust Soc Am. 2001;109:1616. doi: 10.1121/1.1333420. [DOI] [PubMed] [Google Scholar]
- 29.Alipour F, Scherer RC. J Acoust Soc Am. 2002;112:2996. doi: 10.1121/1.1519540. [DOI] [PubMed] [Google Scholar]
- 30.Hofmans GC, Groot G, Ranucci M, Graziani G, Hirschberg A. J Acoust Soc Am. 2003;113:1658. doi: 10.1121/1.1547459. [DOI] [PubMed] [Google Scholar]
- 31.Kucinschi BR, Scherer RC, DeWitt KJ, Ng TTM. J Acoust Soc Am. 2006;119:3011. doi: 10.1121/1.2186429. [DOI] [PubMed] [Google Scholar]
- 32.Shinwari D, Scherer RC, DeWitt KJ, Afjeh AA. J Acoust Soc Am. 2003;113:487. doi: 10.1121/1.1526468. [DOI] [PubMed] [Google Scholar]
- 33.Zhao W, Zhang C, Frankel SH, Mongeau L. J Acoust Soc Am. 2002;112:2134. doi: 10.1121/1.1506693. [DOI] [PubMed] [Google Scholar]
- 34.Zhang C, Zhao W, Frankel SH, Mongeau L. J Acoust Soc Am. 2002;112:2147. doi: 10.1121/1.1506694. [DOI] [PubMed] [Google Scholar]
- 35.Krane M, Berry M, Wei T. J Acoust Soc Am. 2007;122:3659. doi: 10.1121/1.2409485. [DOI] [PMC free article] [PubMed] [Google Scholar]
- 36.de Vries MP, Schutte HK, Veldman AEP, Verkerke GJ. J Acoust Soc Am. 2002;111:1847. doi: 10.1121/1.1323716. [DOI] [PubMed] [Google Scholar]
- 37.Tao C, Zhang Y, Hottinger DG, Jiang JJ. J Acoust Soc Am. 2007;122:2270. doi: 10.1121/1.2773960. [DOI] [PubMed] [Google Scholar]
- 38.Barahona M, Poon CS. Nature. 1996;381:215. [Google Scholar]
- 39.Poon CS, Barahona M. Science. 2001;98:7107. doi: 10.1073/pnas.131173198. [DOI] [PMC free article] [PubMed] [Google Scholar]
- 40.Ishizaka K, Flanagan JL. Bell Syst Tech J. 1972;51:1233. [Google Scholar]
- 41.Luo XY, Pedley TJ. J Fluids Struct. 1995;9:149. [Google Scholar]
- 42.Luo XY, Pedley TJ. J Fluid Mech. 1996;314:191. [Google Scholar]
- 43.Farmer JD, Sidorowich JJ. Phys Rev Lett. 1987;59:845. doi: 10.1103/PhysRevLett.59.845. [DOI] [PubMed] [Google Scholar]
- 44.Tokuda I, Riede T, Neubauer J, Owren MJ, Herzel H. J Acoust Soc Am. 2002;111:2908. doi: 10.1121/1.1474440. [DOI] [PubMed] [Google Scholar]
- 45.Tao C, Mu J, Xu X, Du G. Acoust Sci & Tech. 2004;25:51. [Google Scholar]
- 46.Erath BD, Plesniak MW. J Acoust Soc Am. 2006;120:1000. doi: 10.1121/1.2213522. [DOI] [PubMed] [Google Scholar]
- 47.Crutchfield JP, Huberman BA. Phys Lett. 1980;77A:407. [Google Scholar]
- 48.Crutchfield JP, Nauenberg M, Rudnick J. Phys Rev Lett. 1981;46:933. [Google Scholar]
- 49.Banbrook M, McLaughlin S, Mann I. IEEE Trans Speech Audio Process. 1999;7:1. [Google Scholar]
- 50.Titze Ingo R. J Speech Hear Res. 1991;34:460. doi: 10.1044/jshr.3403.460. [DOI] [PubMed] [Google Scholar]
- 51.Titze Ingo R. Principles of Voice Production. NCVS; Iowa City, IA: 1994. [Google Scholar]
- 52.Hwang SK, Gao JB, Liu JM. Phys Rev E. 2000;61:5162. doi: 10.1103/physreve.61.5162. [DOI] [PubMed] [Google Scholar]
- 53.Diestelhorst M, Hegger R, Jaeger L, Kantz H, Kapsch RP. Phys Rev Lett. 1999;82:2274. [Google Scholar]
- 54.Wackerbauer R, Kobayashi S. Phys Rev E. 2007;75:066209. doi: 10.1103/PhysRevE.75.066209. [DOI] [PubMed] [Google Scholar]
- 55.Gonze D, Halloy J, Goldbeter A. Proc Natl Acad Sci USA. 2002;99:673. doi: 10.1073/pnas.022628299. [DOI] [PMC free article] [PubMed] [Google Scholar]