
Figure 5.
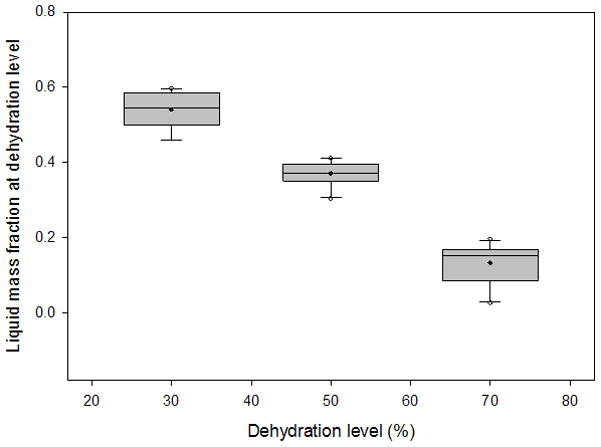
Box plots depicting the distribution of liquid mass fractions from 3 sets of 10 vocal fold lamina propria (VF LP) tissue samples at 30%, 50%, and 70% dehydration. Filled circles represent the mean, horizontal lines inside the boxes mark the median, error bars show the 5th and 95th percentiles, and unfilled circles show outliers.