Abstract
We construct a mathematical model of the parotid acinar cell with the aim of investigating how the distribution of K+ and Cl− channels affects saliva production. Secretion of fluid is initiated by Ca2+ signals acting the Ca2+ dependent K+ and Cl− channels. The opening of these channels facilitates the movement of Cl− ions into the lumen which water follows by osmosis. We use recent results into both the release of Ca2+ from internal stores via the inositol (1,4,5)-trisphosphate receptor (IP3R) and IP3 dynamics to create a physiologically realistic Ca2+ model which is able to recreate important experimentally observed behaviours seen in parotid acinar cells. We formulate an equivalent electrical circuit diagram for the movement of ions responsible for water flow which enables us to calculate and include distinct apical and basal membrane potentials to the model. We show that maximum saliva production occurs when a small amount of K+ conductance is located at the apical membrane, with the majority in the basal membrane. The maximum fluid output is found to coincide with a minimum in the apical membrane potential. The traditional model whereby all Cl− channels are located in the apical membrane is shown to be the most efficient Cl− channel distribution.
Keywords: mathematical model, parotid acinar cell, K+ channel, IP3 receptor, calcium oscillations
1. Introduction
Saliva production is an important process for both digestion and oral health. Problems with salivation can cause issues with dental cavities, oral pain and infections. In mastication, an adequate supply of saliva is needed to provide lubrication to the mouth and facilitate swallowing. Humans and most mammals possess three major pairs of salivary glands (parotid, sublingual and submandibular). The parotid gland is the largest of these, and is also the only major salivary gland that produces purely serous fluid, with the other glands producing mucous. The structure of the parotid gland consists of bunches of acini connected by ducts. Each acinus comprises several epithelial parotid acinar cells secreting fluid into a shared lumenal cavity. The salivary fluid passes from the lumen of the acini into a branching network of ducts, where it is collected and travels to the mouth. Dysregulation of fluid secretion from the parotid acinar cells can lead to conditions such as xerostomia (dry mouth), where sufferers experience pain with eating and speech because of a lack of saliva.
Fluid is known to travel through the parotid cells by the process of osmosis. Given a membrane impermeable to ions but permeable to water, water will flow from the area of low ionic concentration to that of high concentration. The parotid gland must maintain an ionic gradient, increasing from the interstitium, to the cytoplasm and then into the lumen, to facilitate water movement through the cell to the duct. Whilst maintaining this gradient the acinar cells must avoid accumulation of too much water in the cell, as the cell membrane is incapable of sustaining any significant pressure difference.
Existing models for fluid flow through the parotid acinar cell place K+ channels exclusively in the basolateral membrane (Gin et al. (2007), Nauntofte (1992), Turner et al. (1993), Turner and Sugiya (2002)). However, there is building evidence for the existence of K+ channels in the apical membrane (Sørensen et al. (2001) find apical K+ channels in frog skin glands, Catalan and Melvin [Unpublished] in parotid acinar). Cook and Young (1989) looked at adding apical K+ channels to a model with constant ionic concentrations and steady state currents. We aim to investigate how the distribution of K+ channels changes the saliva production of the parotid acinar cell in a dynamic model where salivation is initiated by Ca2+ signalling.
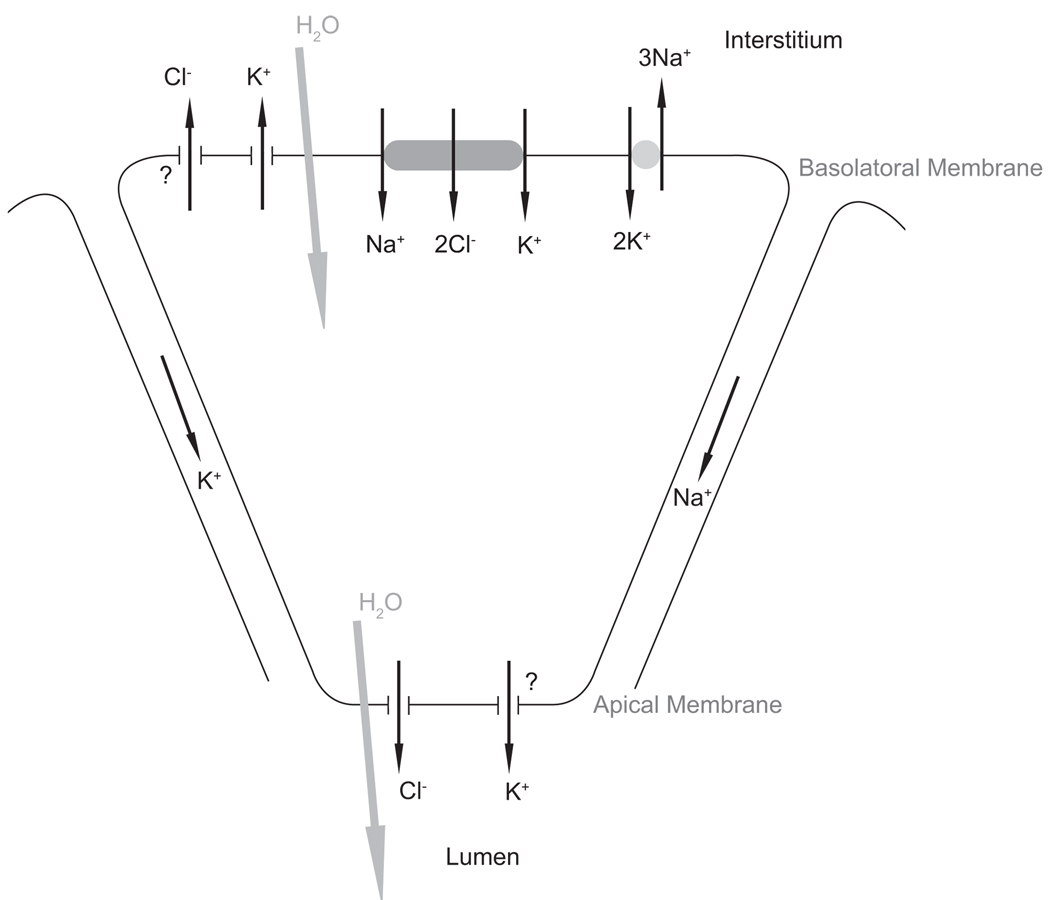
We use the currently accepted model for saliva production (see Nauntofte (1992) for a review) where the movement of Cl− into the cytoplasm and then into the lumen creates a concentration gradient which water follows by osmosis. In this model the basolateral membrane contains a Na+-K+-2Cl− cotransporter (NKCC), a Na+-K+-ATPase (NaK) and a K+ ion channel. Cl− moves into the cell via the NKCC and then moves through Ca2+ sensitive apical Cl− channels into the lumen. The Na+ and K+ ions are removed from the cell by K+ channels and the NaK pump. See Figure 1 for a diagram of the model used.
Figure 1.
Mechanisms underlying fluid flow. The basal membrane separates the cytoplasm from the interstitium, with the apical membrane at the other pole separating the cytoplasm from the lumen. Cl− moves into the lumen through the apical membrane and water follows by osmosis. Paracellular movement of cations through the tight junctions balances the movement of negative Cl− ions into lumen. The model allows for the possibility of apical as well as basal K+ channels. We also allow for possible Cl− efflux through the basal membrane.
Calcium (Ca2+) plays a critical role in epithelial tissue as a second messenger activating fluid flow. Previous models have investigated Ca2+ signalling in a variety of epithelial tissues including airway epithelium (Sneyd et al. (1995), Warren et al. (2010), Warren et al. (2009)). As Ca2+ concentration increases in parotid cells the ionic channels at the basal and apical membrane open and fluid production is seen to increase. The salivation process is initiated in the otic ganglion parasympathetic nerve which runs from the brain to the parotid gland. When stimulated, for example when we smell food, these nerves release acetylcholine, which binds to receptors on the cell surface, leading to the production of inositol (1,4,5)-trisphosphate (IP3) in the cytoplasm. The raised IP3 concentration releases Ca2+ from internal stores in the endoplasmic reticulum (ER). As Ca2+ concentration increases in parotid cells the ionic channels at the basal and apical membrane open and fluid production is seen to increase. We create a model for intracellular Ca2+ using recent results relating to the release of Ca2+ from internal stores via the inositol (1,4,5)-trisphosphate receptor (IP3R) and the dynamics of IP3. Feedback of Ca2+ on the degradation of IP3 is the mechanism which our model uses to recreate Ca2+ oscillations.
Insight into the role of the K+ channel distribution in determining the rate of water transport in the parotid cell is gained by observing the apical and basolateral membrane potentials during simulations with and without the addition of apical K+ channels.
2. The model
2.1. Model assumptions and notation
We introduce a subscript notation for ionic concentrations, with [x]i, [x]l, [x]e, [x]er denoting, respectively, cytosolic, luminal, interstitial and ER concentrations of an ion x. We assume the ionic concentrations in the interstitium stay constant, while the concentrations in the cytoplasm and lumen change as a result of the ion movements seen in Figure 1. Stepwise increases in total ionic concentrations from the interstitium to the cytoplasm and then to the lumen result in fluid flow by osmosis into the lumen. Any difference between water flow into or out of the cell causes changes in cell volume and thus cytosolic volume, w, is also a variable of our model. Volumes of the ER, wer, and the lumen wL are constant and given as fractions of the unstimulated steady-state cytosolic volume, w0.
2.2. Calcium dynamics
In an earlier model of the parotid acinar cell by Gin et al. (2007) Ca2+ oscillations were found to depend on cell volume oscillations. It seems unlikely that parotid cells require oscillating volume to display Ca2+ oscillations. Indeed, many cell types which do not transport fluid, and hence have a fixed volume, exhibit Ca2+ oscillations. Therefore we aim to produce a model where Ca2+ oscillations can be shown not to depend on oscillating cell volume.
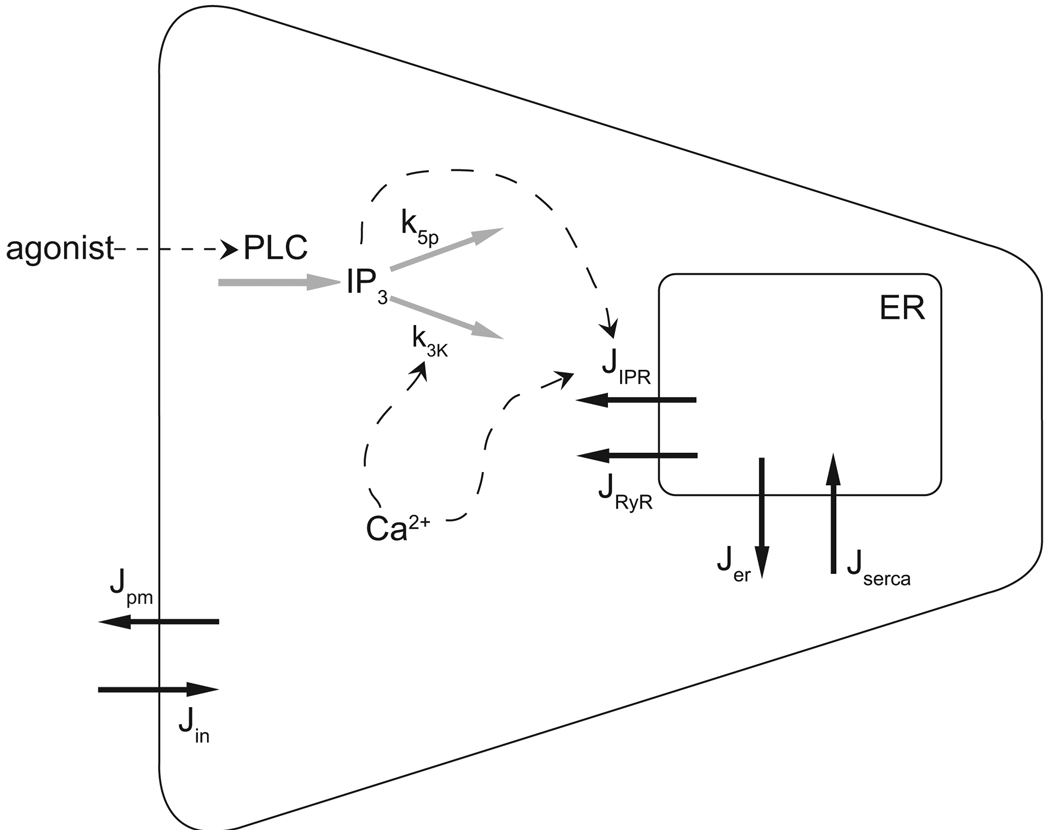
We use a recent model of the inositol (1,4,5)-trisphosphate receptor (IP3R) by Gin et al. (2009) and a model of inositol (1,4,5)-trisphosphate (IP3) dynamics by Politi et al. (2006) with the aim of reproducing Ca2+ behaviour seen experimentally. Ca2+ is stored in the ER and is released via Ca2+ and IP3-dependent channels into the cytoplasm. Ca2+ influxes and effluxes are also present from the interstitium to the cytoplasm. A schematic diagram of our Ca2+ model is shown in Figure 2.
Figure 2.
Schematic of the calcium model. Ca2+ fluxes are shown with solid black arrows. IP3 and Ca2+ feedback on the IP3R and IP3 degradation are shown with dashed arrows. Agonist concentration stimulates IP3 production via PLC. IP3 then degrades by dephosphorylation at rate k5p and phosphorylation at a Ca2+-dependent rate k3K (grey arrows). Increases in Ca2+ and IP3 concentration raise the open probability of the IP3R, releasing Ca2+ from the ER.
Two feedback mechanisms have been found capable of creating Ca2+ oscillations. In one, Ca2+ feeds back on the inositol (1,4,5)-trisphosphate receptor (IP3R), and in the other Ca2+ feeds back on IP3 metabolism. This second feedback mechanism can be positive or negative in nature, with Ca2+ increasing IP3 production or increasing IP3 degradation. Sneyd et al. (2006) found that in pancreatic acinar cells Ca2+ oscillations were dependent on IP3 oscillations and thus the feedback on IP3 metabolism was responsible for Ca2+ oscillations. Given the similarity of the pancreatic acinar to the parotid acinar cell our model assumes that the Ca2+ oscillations arise from feedback of Ca2+ on IP3 metabolism.
2.2.1. IP3 dynamics
Our model of IP3 dynamics is based on Politi et al. (2006). The IP3 production rate, ν is proportional to the applied agonist concentration. IP3 then degrades by Ca2+- dependent phosphorylation up to a maximum rate k3K and constant dephosphorylation at a rate k5p. High IP3 concentrations cause the channels in the ER to open which causes an increase in the cytosolic Ca2+ concentration. As the Ca2+ concentration rises IP3 degradation is increased and IP3 concentration falls, causing a subsequent closing of the ER channels and a drop in Ca2+ concentration. As the Ca2+ concentration decreases IP3 is able to increase in concentration due to the lowered degradation rate. It is in this cycle that the Ca2+ and IP3 oscillations occur. The rate of change of IP3 can be expressed in the following differential equation
| (1) |
where w is the cell volume, w0 is the steady state cell volume, ν is the agonist-dependent rate of IP3 production, which will be used as our control parameter for simulations, and
| (2) |
is the rate of degradation. Parameter values are given in Table 1.
Table 1.
Parameters modified slightly from those given for the negative feedback model in Politi et al. (2006)
| IP3 parameter values | |
|---|---|
| k3K | 40 s−1 |
| k5p | 0.005 s−1 |
| kdeg | 400 nM |
Sims and Allbritton (1998) give the half life of IP3 in the parotid acinar cell as approximately 1 second. The parameter value k3K = 40 s−1 satisfies this half life at a intracellular Ca2+ concentration near the steady state value of 50 nM and using the half activation of kdeg of 400 nM as given in Politi et al. (2006). The constant dephosphorylation rate k5p is a fitted parameter found to give Ca2+ oscillations seen experimentally.
In Politi et al. (2006) parameter values are given for both positive and negative feedback relating to whether Ca2+ feeds back on IP3 production or degradation, with positive feedback models being relevant to fast IP3 behaviour. Given the IP3 turnover in parotid cells is slow with a half life of 1 second our model includes only Ca2+ feedback on IP3 degradation and has production of IP3 linear with agonist.
2.2.2. IP3 receptor model
The IP3 receptor model is based on the recent work of Gin et al. (2009). Where single channel data from the type-1 IP3 receptor is used to determine rate constants and their dependence on both IP3 and Ca2+.
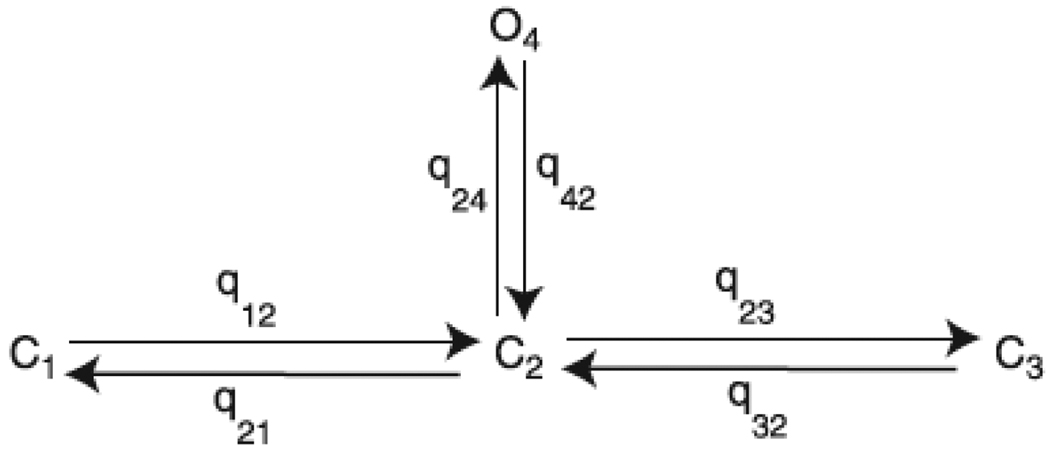
Following Gin et al. (2009) we use a four-state model with one open state and three closed states, (Figure 3). The steady state open probability is given by
| (3) |
Figure 3.
Four state model of the IP3 receptor
The rate constants between the states were investigated for their dependence on both the concentration of Ca2+ and IP3 and are given by,
| (4) |
where
| (5) |
The rate constants q23 and q32 depend on both Ca2+ and IP3. The dependence of the rate constants on Ca2+ was established at an IP3 concentration of 100 µM. Scaling factors ensure our model matches the experimental data at this IP3 concentration.
Parameter values can be found in Table 2. All values are those found in Gin et al. (2009) with the following exception. bp21 is increased slightly from the paper value of 0.085 to the new value of 0.11. This is to ensure that when the IP3 concentration is 100 µM the rate q21 is equal to that found in the Ca2+ dependence experiments. The parameter bp32 is set to zero (as opposed to its value in Gin et al. (2009) of 0.0007) this is to ensure that the IP3 receptor is shut when the IP3 concentration is zero.
Table 2.
All parameters taken from Gin et al. (2009) with the following exceptions,
| IP3 receptor parameters | |||||
|---|---|---|---|---|---|
| bp21* | 0.11 ms−1 | bp23 | 0.001 ms−1 | bp32* | 0 |
| kp21* | 5 × 10⁻¹⁰ nM−3 | kp23 | 5 × 10⁻⁹ nM−3 | kp32 | 1.5 × 10⁻¹⁰ nM−3 |
| VP21 | 0.0949 nM3 ms−1 | VP23 | 0.162 nM3 ms−1 | VP32 | 3 × 10⁻¹² nM3 ms−1 |
| α23 | 1/1.023 ms−1 | α23# | 1000 | α32# | 50 |
| V23 | 1.08 × 10⁻⁶ nM2 ms−1 | k23 | 2000 nM | b23 | 2.2 ms−1 |
| Vm23 | 0.3545 | km23 | 72 nM | bm23 | 0.042 |
| V32 | 7 × 10⁶ nM3 ms−1 | k32 | 520 nM | b32 | 0.005 ms−1 |
| Vm32 | 1.06 | km32 | 150 nM | bm32 | 0.03 |
are scaling parameters,
parameters have been modified from original values in Gin et al. (2009) to ensure correct scaled rates and a closed IPR in the absence of IP3.
Given the steady-state open probability, PIPR, the flux through the IP3 is given by,
| (6) |
Here kIPR = 0.04 s−1 is the IP3 receptor density, [Ca]er and [Ca]i are the Ca2+ concentrations in the ER and cytoplasm respectively.
2.2.3. Calcium fluxes
Experimental data shows the ryanodine receptor (RyR) is important for Ca2+ oscillations, Bruce et al. (2002). We use a RyR model developed by Keizer and Levine (1996). Here the flux through the RyR is given by
| (7) |
where kRyR = 0.01 s−1 is the receptor density and PRyR is the steady state open probability given by
| (8) |
and
| (9) |
Here and , (Table 3). We include a passive leak of Ca2+ from the ER into the cytoplasm,
| (10) |
where ker = 1.554 × 10⁻⁴ s−1.
Table 3.
| Ca2+ parameters | ||||||||
|---|---|---|---|---|---|---|---|---|
| kIPR | 0.04 s−1 | kRyR | 0.01 s−1 | ker | 1.554 × 10⁻⁴ s−1 | |||
| VSERCA | 1 × 10⁻⁹ nmol s−1 | KSERCA | 400 nM* | |||||
| Vpm | 15 × 10−12 nmol s−1 | Kpm | 200 nM ** | |||||
| α1 | 2.31 × 10⁻¹³ nmol s−1 | α2 | 3.5 × 10⁻⁴ s−1 | |||||
| w0/wer | 5.405 | |||||||
| RyR parameters # | ||||||||
|
|
1500 (µM)−4 s−1 |
|
1500 (µM)−3 s−1 |
|
1.75 s−1 | |||
|
|
28.8 s−1 |
|
385.9 s−1 |
|
0.1 s−1 | |||
| Ka | 372 nM | Kb | 636 nM | Kc | 0.0057 | |||
parameters from Keizer and Levine (1996),
from Lytton et al. (1992),
taken from Camello et al. (1996), all remaining receptor densities and parameters are fitted to recreate experimental Ca2+ oscillations.
Ca2+ is removed from the cytoplasm back to the ER by a SERCA pump. This is modelled with a Hill coefficient of 2 and a half activation, KSERCA, of 400nM (Lytton et al. (1992)),
| (11) |
Ca2+ enters and leaves the cytoplasm through the membrane via two fluxes, Jin and Jpm. Efflux is approximated by a Hill function with Hill coefficient of 3 and half activation, Kpm, of 200 nM (Camello et al. (1996)):
| (12) |
Influx of Ca2+ from the interstitium to the cytoplasm is modelled as by Gin et al. (2007) with a constant leak, α1 and agonist dependent influx α2ν.
| (13) |
2.2.4. Calcium model equations
Changes in Ca2+ are the result of the fluxes into and out of the cell and ER. The system of equations for the Ca2+ model is,
| (14) |
| (15) |
together with
| (16) |
Here, w is the volume of the cytoplasm and wer is the volume of the ER.
2.3. Ion channels and fluxes
The osmotic gradient across the apical membrane, which drives the fluid flow, is maintained primarily by movement of Cl− ions through the Cl− channels located in the apical membrane. We use a model developed by Arreola et al. (1996), where the Cl− channel open probability is a function of Ca2+. Details can be seen in Appendix A.
Our model allows for K+ channels in both the apical and basal membrane, with the currents denoted by IK,a and IK,b respectively. In Section 3.4 we investigate the effect the distribution of the K+ channels has on saliva secretion. We use a K+ channel model developed by Takahata et al. (2003) where the open probability of the channel increases as Ca2+ increases (Appendix B). The maximum whole cell conductance gK is distributed in either the apical or basal membrane with the parameter αK. As αK increases from zero to one the whole cell K+ conductance is distributed from entirely in the apical membrane to entirely in the basal membrane. It is with this parameter we investigate how apical K+ channels affect secretion.
At the basal membrane the NKCC brings Cl− into the cell along with Na+ and K+. The basal membrane also contains the NaK which exchanges 3 Na+ ions for 2 K+ ions. Previous models of the parotid acinar cell by Gin et al. (2007) used complicated models for these fluxes with a large number of parameters (7 for the NKCC and 19 for the NaK).
We simplify the NKCC model of Benjamin and Johnson (1997) to a two-state model (details can be found in Appendix E). Similarly we simplify the NaK model of Smith and Crampin (2004) to a two-state model with only 2 parameters, a great reduction from the original 19 parameter model (Appendix F). A comparison between simulations run with our simplified models and those used in previous studies can be found in Appendix G. We see no qualitative difference in results using the simplified NKCC and NaK and only a 3% change in average fluid over a 300 second simulation compared to results computed with the original flux transporter models.
2.4. Intracellular ionic differential equations
Cl− influx into the cytoplasm is via the NKCC. The apical Cl− channel releases this Cl− into the lumen.
| (17) |
The factor of 2 in the cotransport term is present because for every K+ and Na+ that enter the cell, two Cl− are transported into the cell. zCl = −1 is the valence of Cl− and F = 96490 C mol−1 is Faraday’s constant.
Na+ enters the cytoplasm via the NKCC and is extruded by the NaK;
| (18) |
The rate of change of intracellular K+ is due to the K+ channels, the NKCC and the NaK;
| (19) |
Here zK = +1 is the valence of K+, IK,ba and IK,Ap are the basal and apical K+ currents respectively.
2.5. A two membrane model and the role of the tight junction
Previous modelling of the parotid cell by Gin et al. (2007) assumed that because the resistance in the tight junction is small the electrical properties at the apical and basal membranes will be the same. However it is seen in experiments that the lumen is far from electroneutral with respect to the interstitium (Young (1968)). Thus, here we include both an apical and basolateral membrane. The membrane potential at a given membrane is determined by the movement of ions through the membrane and any current applied to the membrane.
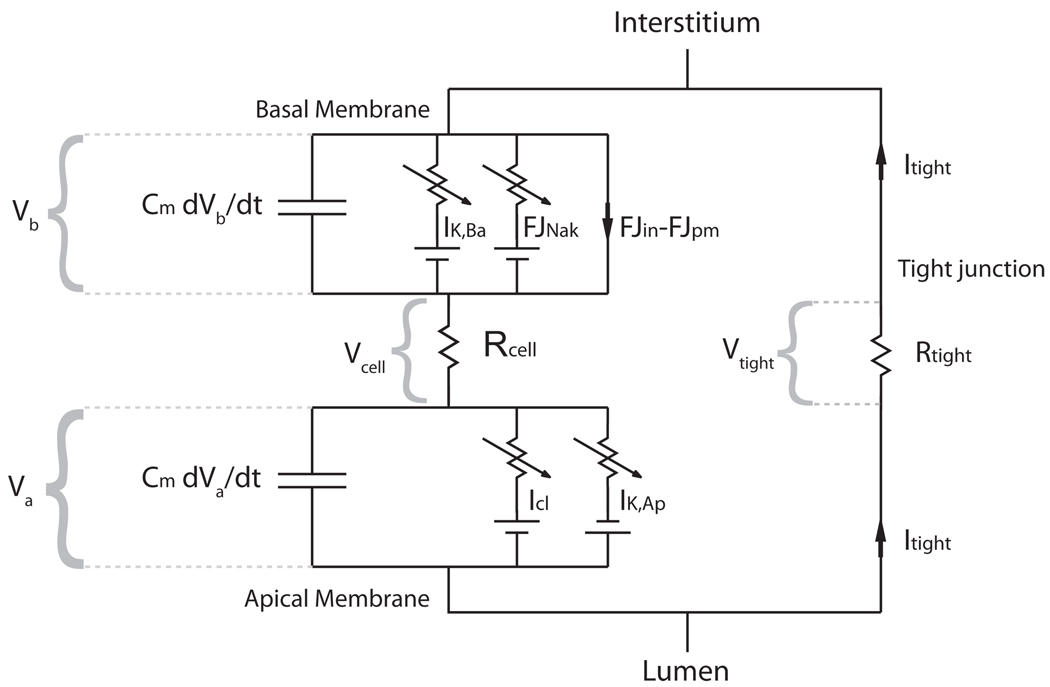
With a closed circuit model as seen in Figure 4 we include a current of positive K+ and Na+ ions through the tight junction, Itight. This movement of cations through the tight junction balances the movement of negative Cl− ions to stop the lumen becoming too negatively charged. Membrane potentials, currents and fluxes are measured from the exterior of the cell to the cytoplasm. Thus,
| (20) |
| (21) |
where Jin and Jpm are the Ca2+ fluxes into and out of the cell. The factor of 2 is due to Ca2+ having a valence of +2.
Figure 4.
Circuit model of two membranes in series
In Figure 4 the tight junction current is shown to be moving anticlockwise around the circuit. Here Itight is the movement of negative ions and is equal and opposite to the movement of K+ and Na+ ions. We assume the resistances to ions moving through the tight junction and the cell, Rtight and Rcell respectively, are constant and independent of cell activity. Given that the sum of voltage drops around the circuit must be zero we have
| (22) |
Note that Va is negative as we measure its potential from the lumen to the cytoplasm. By substituting Vtight = ItightRtight and Vcell = ItightRcell we can then calculate the current through the tight junction
| (23) |
The current through the tight junction is the sum of the K+ and Na+ currents through the tight junctions. We denote the respective ionic currents as,
| (24) |
Here gt,Na is the relative conductance of Na+ ions through the tight junction with respect to K+ ions. As such it gives a measure for what fraction of the tight junctional current is due to Na+ movement. Although we allow for resistance of ionic flow in both the cell and the tight junction, no significant potential changes are seen throughout the interior of the cell, (Berridge and Prince (1972)) and hence we set Rcell = 0.
2.5.1. Luminal ionic concentrations and water transport
We model the rate of water flow based on the difference between external and internal concentrations and a water permeability term. We assume cell volume changes purely based on the difference between apical and basal fluid flow,
| (25) |
where the rate of water flow through the apical and basal membranes is given by,
| (26) |
| (27) |
Here x is the number of impermeable ions and other solutes in the cytoplasm, LPa and LPb are the permeability of the apical and basal membranes respectively to water. Interstitial ionic concentrations, with notation []e, are assumed constant with the values shown in Table 5.
Table 5.
Steady state results and comparison to experimental results
| Model Result | Experimental Result | |
|---|---|---|
| Cytosolic ion concentrations | ||
| [Cl]i | 61.2 mM | 61 mM (Foskett, 1990) |
| [K]i | 145.0 mM | 152 mM (Izutsu and Johnson, 1986) |
| [Na]i | 11.2 mM | 13 mM (Izutsu and Johnson, 1986), 18.6 mM (Soltoff et al., 1989) |
| Luminal ion concentrations | ||
| [Cl]l | 124.3 mM | 112.6 mM (Mangos et al., 1973) |
| [K]l | 5.6 mM | 5.6 mM (Mangos et al., 1973) |
| [Na]l | 118.7 mM | 141.6 mM (Mangos et al., 1973) |
| Interstitial concentrations (constants) | ||
| [Cl]e | 102.6 mM | 102.6 mM (Mangos et al., 1973) |
| [K]e | 5.3 mM | 5.3 mM (Mangos et al., 1973) |
| [Na]e | 140.2 mM | 140.2 mM (Mangos et al., 1973) |
| Membrane potentials | ||
| Vb | −50.7 mM | −44 mV (Berridge and Prince, 1972), −65 mV (Lang and Walz, 2001), −33 mV (Lundberg, 1957). |
| Vtight | −11 mV | −13 mV (Lang and Walz, 2001), −13 mV (Martin et al., 1973) |
Ma et al. (1999) find in aquaporin-5 (APQ5) knockout mice saliva secretion is reduced by more than 60% compared to wild-type mice. This suggests that the majority of water flow is through the cell. We also allow for water flow through the tight junction to the lumen, paracellular water flow, and denote this qtight,
| (28) |
with the permeability of the tight junction given by LPt. Water flow into the lumen will then be the sum of the apical fluid flow and the tight junctional fluid flow, qtot = qa+qtight. We assume the flow of water into the lumen, qtot must be matched by a water flow out of the lumen and into the parotid duct. Any ions in the lumen will be removed by this water flow.
Sodium enters the lumen via the tight junctional current and so
| (29) |
Here wL is the luminal volume and is modelled as a constant. Luminal K+ concentration changes due to the tight junction K+ current, any current through the apical K+ channel and removal due to fluid flow;
| (30) |
Cl− enters the lumen through the chloride channel and is removed at the rate of apical water flow;
| (31) |
2.6. Summary of the model
| (32) |
| (33) |
| (34) |
| (35) |
| (36) |
| (37) |
| (38) |
| (39) |
| (40) |
| (41) |
| (42) |
| (43) |
| (44) |
| (45) |
| (46) |
| (47) |
| (48) |
2.7. Numerical simulations
In solving the system of equations the small membrane capacitance Cm produces a highly stiff system of equations, which gives rise to difficulties during numerical solution. We ignore the fast dynamics of the membrane potentials and find solutions to the differential equations using a quasi-steady state approximation to the membrane potential Vb and Va. The system of differential equations is solved using the Matlab code ode15s. At each time step we solve dVb/dt = 0 and dVa/dt = 0 to find the quasi-steady state potentials using a simple Newton solver.
As such we solve the following at each time step,
| (49) |
| (50) |
Here the superscript notation denotes the time step. We use a simple Newton solver in the implementation of the above solution which finds the present membrane potentials using concentrations from the previous time step.
3. Results
3.1. Calcium model results
We aim to reproduce experimental traces found by Bruce et al. (2002) using the unconstrained Ca2+ flux density parameters, kIPR, kRyR, VSERCA and the constant IP3 dephosphorylation rate k5p to fit the model to the data. In simulating the experimental procedures we hold the cell volume constant, this demonstrates that the model Ca2+ oscillations are not dependent on cell volume oscillations.
In experimental recreation of the salivation process carbachol (CCh) is added to the parotid cells. CCh is known to stimulate the muscarinic acetylcholine receptors which results in the activation of phospholipase C which in turn induces the breakdown of phosphatidylinositol 4,5-bisphosphate (PIP2) in the cell membrane to release IP3 into the cytosol. We model CCh application by increasing the IP3 production rate, ν, assuming a greater CCh concentration leads to a higher IP3 production rate. The Ca2+ concentration is measured using fura-2 dye.
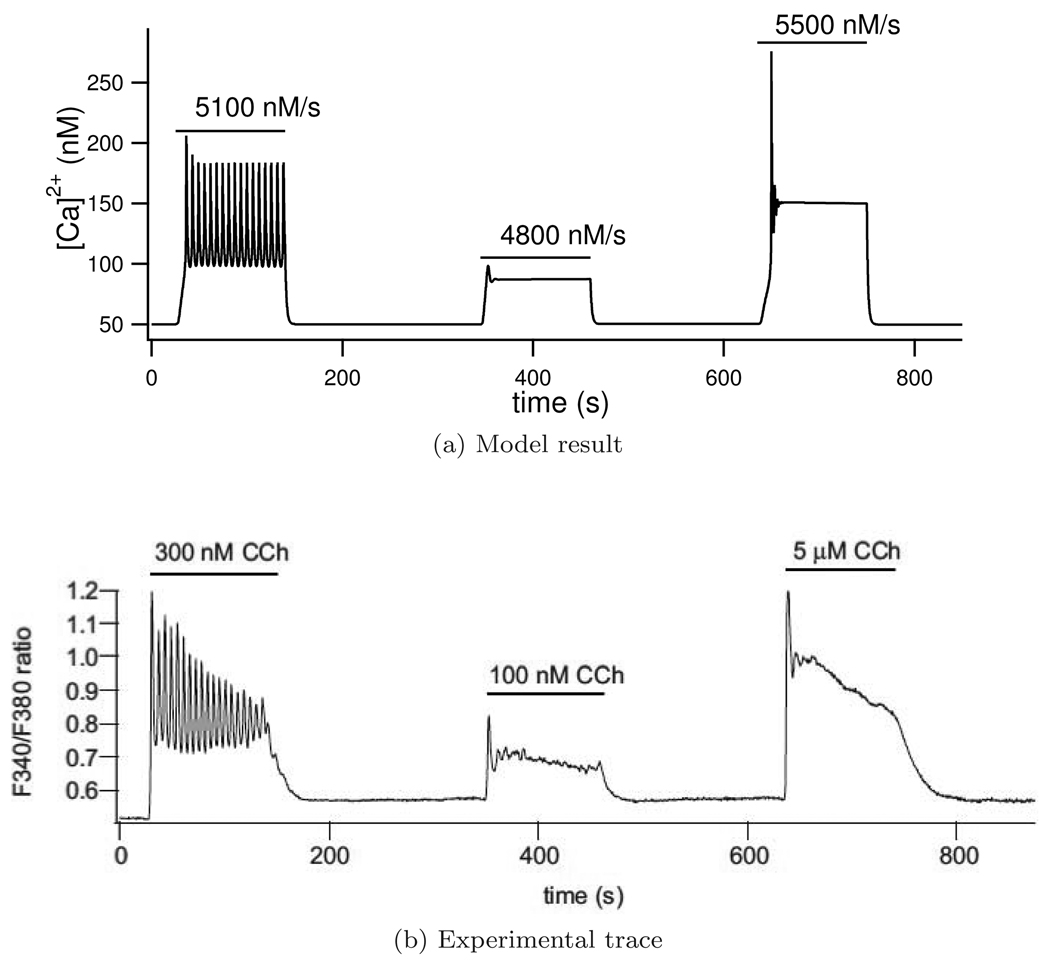
With the parameters found our model is able to recreate several experimentally observed Ca2+ behaviours. Firstly our model is able to recreate experimental results of Ca2+ oscillations at three different agonist concentrations, (Figure 5). We simulate different agonist concentrations by changing the IP3 production rate, ν. Ca2+ oscillations are seen for ν = 5100 nM/s. As the IP3 production rate is increased or decreased from this value to ν = 4800 nM/s or ν = 5400 nM/s the Ca2+ oscillations are damped. Any further increases or decreases in the IP3 production rate would result in no Ca2+ oscillations being found. Unlike Gin et al. (2007), who similarly recreated this result, our model is able to reproduce the experimental traces when cell volume is fixed.
Figure 5.
Ca2+ traces for three agonist concentrations with the model result in (a) and the experimental trace (b) reproduced from original figure in Gin et al. (2007) with permission from the authors. Parameter ν is zero except when indicated by a horizontal bar with its non-zero value written above. In the experimental trace, F340/F380 represents the fluorescence of fura-2 and gives a measure of Ca2+ concentration.
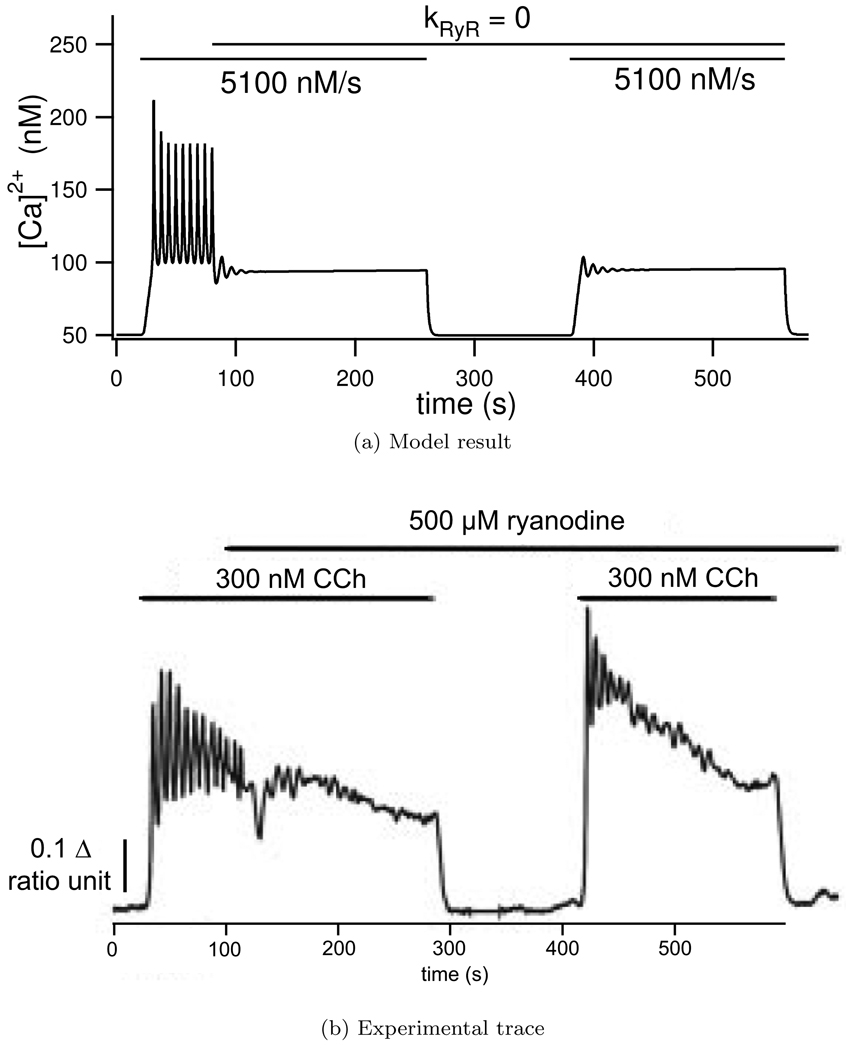
Ca2+ release from the ER is due to the IP3 receptor, ryanodine receptor (RyR) and a leak term. Experimentally when a high concentration of ryanodine is added to the cell, with the effect of blocking the RyR, Ca2+ oscillations are damped. As can be seen in Figure 6 our model recreates the observed Ca2+ traces and oscillations are damped when the ryanodine receptor is blocked.
Figure 6.
Effect of blocking the Ryanodine receptor in the model (a) by setting kRyR = 0 and (b) experimentally by applying a large (500 µM) Ryanodine concentration. Ca2+ oscillations are initiated in the model by setting ν = 5100 nM/s, and experimentally by adding 300 nM carbachol at the times shown with the horizontal bars. With the exception of the period when kRyR = 0 all the model parameters are those found in Table 3. Experimental ‘ratio unit’ represents the fluorescence of fura-2 and gives a measure for Ca2+ concentration. Experimental trace reproduced from Bruce et al. (2002) with permission from the authors.
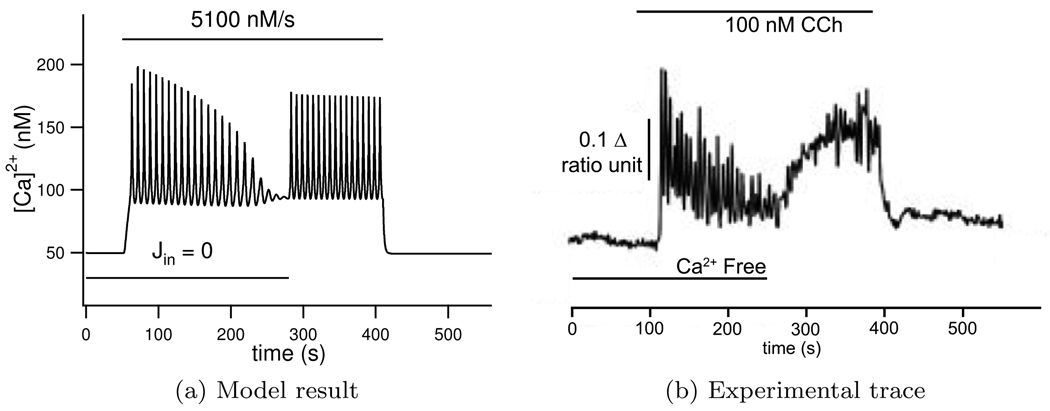
Experimental traces show Ca2+ oscillations continue when extracellular Ca2+ is set to zero. We recreate this experiment by setting Jin = 0. The parameter Vpm is chosen to give the right time scale of Ca2+ efflux from the cell. Parameters α1 and α2 are then subsequently found in order to have balanced influx and efflux in both stimulated and un-stimulated conditions. Parameter values can be found in Table 3.
The results from this simulation can be seen in Figure 7. When the addition of agonist is simulated by setting ν = 5100 nM/s Ca2+ oscillations are seen. As Jin is set to zero the total Ca2+ in the cell decreases due to the leak Jpm which slowly damps the oscillations until eventually the total intracellular Ca2+ decreases sufficiently to stop oscillations entirely. When Jin is restored to its previous non-zero value Ca2+ oscillations are again observed.
Figure 7.
The effect of stopping Ca2+ entry from the interstitium which is seen to damp oscillations, experimental result shown in (b), experiment reproduced in the model by setting Jin = 0, seen in (a). Ca2+ oscillations are initiated in the model by setting ν = 5100 nM/s, and experimentally by adding 100 nM carbachol at the times shown with the horizontal bars. Experimental ‘ratio unit’ represents the fluorescence of fura-2 and gives a measure for Ca2+ concentration. Experimental trace reproduced from Bruce et al. (2002) with permission from the authors.
3.2. Steady state results
We simulate the un-stimulated parotid cell by setting ν = 0. We then use experimentally observed steady-state ionic concentrations to fit model parameters to the pump densities αNaK and αNKCC. Water permeabilities LPa, LPb and tight junctional conductance gt,Na are fitted to give correct steady state luminal concentrations and cell volume. Finally the resistance of the tight junction, Rtight is fitted to give the correct steady state membrane potentials. A comparison between model steady state values and those observed experimentally can be seen in Table 5.
With the parameter values found at zero agonist we have a Ca2+ concentration of 50 nM. This similar to the 59 nM observed by Foskett and Melvin (1989).
In the cytoplasm Cl− has a steady state of 61.2 mM, which agrees well with the 61 mM found by Foskett (1990). The K+ steady state is found to be 145 mM in the cytoplasm, slightly less than that found by Izutsu and Johnson (1986) of 152 mM. The steady state sodium in the cytoplasm is 11.2 mM which is close to the values of 13 mM found by Izutsu and Johnson (1986) and the 18.6 mM found by Soltoff et al. (1989).
We have luminal steady-state values of 124.3 mM, 118.7 mM and 5.6 mM for Cl−, Na+ and K+ respectively. Mangos et al. (1973) found experimental values of 112.6 mM, 141.6 mM and 5.6 mM for ionic concentrations of Cl−, Na+ and K+ in the primary fluid respectively. Our model results are similar to those by Mangos et al. (1973) with a slightly lower luminal Na+ concentration than found experimentally.
The steady-state membrane potentials are found as −50.7 mV for the basal membrane and −39.7 mV for the apical membrane. The basal membrane potential is between the measurements of −44.2 mV and −65 mV obtained by Berridge and Prince (1972) and Lang and Walz (2001) respectively. Measurements by Lang and Walz (2001) and Martin et al. (1973) find the lumen to be around 13 mV negative with respect to the interstitium which agrees nicely with the 11 mV negative found in our model.
3.3. Fluid transport results
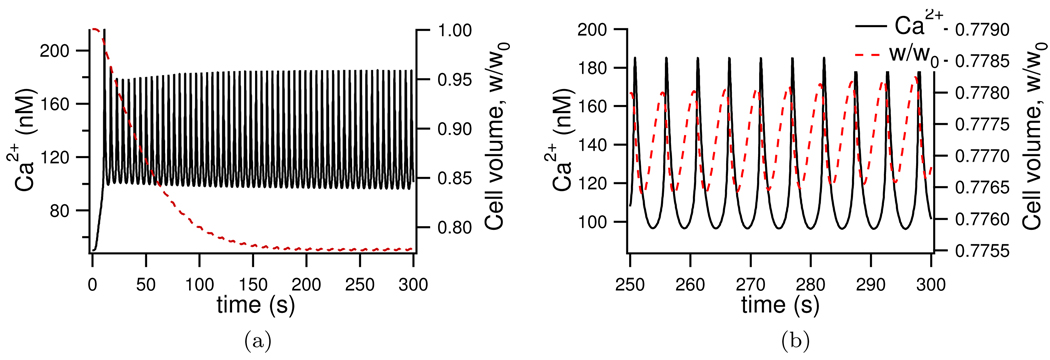
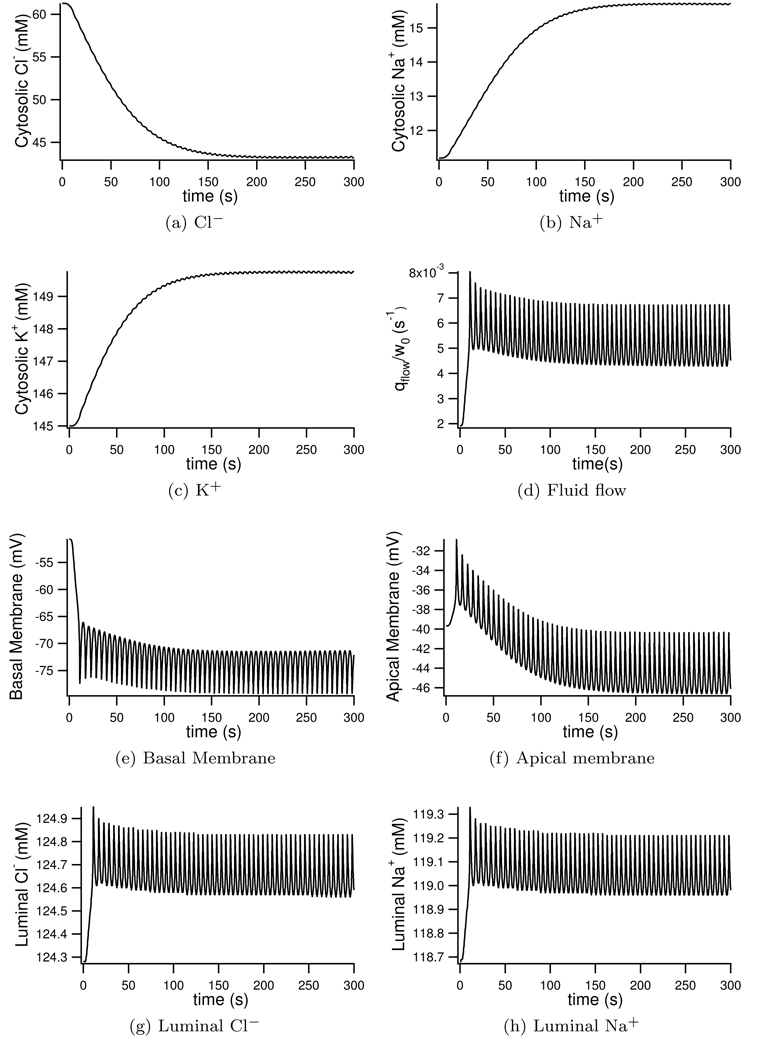
We next simulate fluid secretion in the presence of an agonist by setting the parameter ν = 5100 nM/s. With this stimulation we see Ca2+ oscillations around 140 nM (Figure 9a). Once stimulated the intracellular Cl− is seen to drop from 61.2 mM to 43 mM (see Figure 8a). Foskett (1990) similarly observes a fall in cytosolic Cl− concentration, albeit slightly larger with a 50% reduction in Cl− upon stimulation. The cell volume is seen to shrink by 22% after stimulation with agonist (Figure 9a). Experimentally Foskett and Melvin (1989) see an almost identical 15% cell volume reduction upon stimulation. Cytosolic Na+ increases from 11.2 mM to 15.7 mM (Figure 8b), increases in Na+ upon stimulation are found experimentally by Soltoff et al. (1989), where Na+ doubles in concentration after stimulation. No experimental data was found as to the change in cytosolic K+ upon stimulation. Our model shows only a small increase (Figure 8c) which may explain the lack of data. As with experimental results seen by Mangos et al. (1973) the luminal concentrations change very little when stimulated. The luminal Cl− and Na+ increase slightly (Figures 8g and 8h) with no significant change in luminal K+ as seen by Mangos et al. (1973).
Figure 9.
Model volume (red trace) change with Ca2+ oscillations (black trace) upon stimulation with agonist. 9b shows the final 50 seconds of 9a and shows clearly the simultaneous Ca2+ and volume oscillations.
Figure 8.
Model ionic and potential changes with simulated saliva production. Parameter ν = 5100 nM/s for the duration to represent continued stimulation with agonist.
In Figure 9b the relationship between cell volume and Ca2+ is shown. Foskett and Melvin (1989) found cell shrinkage corresponded with Ca2+ increases, and that the cell would continue to shrink even after Ca2+ levels started to subside. This behaviour is observed in our model where a peak in the Ca2+ is seen to precede a trough in the cell volume.
When stimulated, the basal membrane hyperpolarises from −50.7mM to around −75 mV (Figure 8e) whilst the apical membrane oscillates around its steady-state value of −43 mV (Figure 8f). Experimentally Lundberg (1957) finds the basal membrane to hyperpolarise by −22 mV which agrees well with our model. With this hyperpolarisation of the basal membrane stimulation is found to make the lumen more negative with respect to the interstitium than steady state values. Lundberg (1957) observe a 10–22 mV hyperpolarisation of the lumen with respect to the interstitium. Our model shows a similar hyperpolarisation from −11 mV to −31 mV with respect to the interstitium.
Upon stimulation the average normalised water flow is found to be 0.0058 s−1, 3 times its resting rate, see Figure 8d. Evans et al. (2000) found a volume of 400 µl saliva secreted per 100 g of parotid gland in 50 minutes. One cell in our model produces 1.77 × 10⁻⁵ µl in 50 minutes. We therefore require 2.26 × 10⁷ cells in 100 g to produce the experimentally result. This agrees well with the 108 parotid cells Gin et al. (2007) estimated to be found in 100 g of parotid gland.
3.4. Location of K+ channels
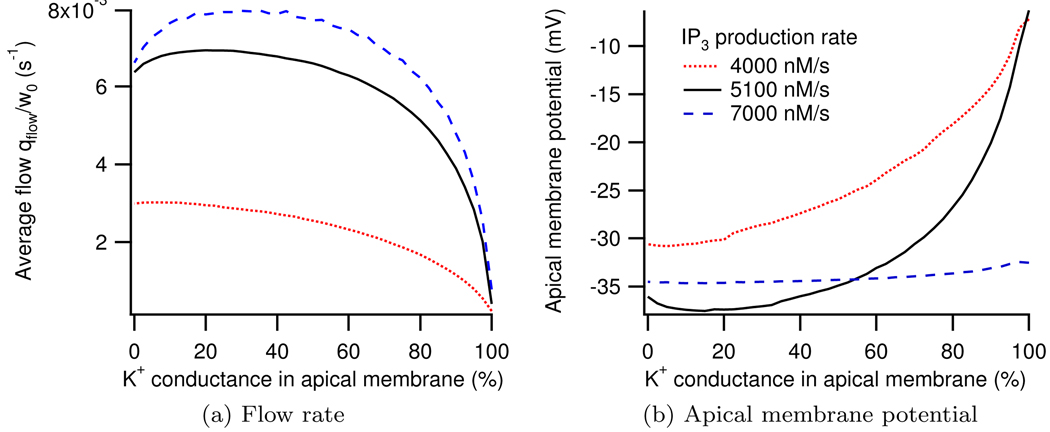
In Figure 10a it can be seen that as the whole cell K+ conductance goes from being entirely in the basal membrane to being entirely in the apical membrane we see an initial increase in fluid output before the saliva secretion then diminishes. Maximum fluid production occurs for 5100 nM agonist when 20% of the whole cell conductance is located in the apical membrane and the remaining 80% is in the basal membrane. Figure 10b shows the apical membrane potential as the distribution of the K+ channels is changed. The distribution of K+ channels for which maximum fluid production occurs coincides with the distribution where the minimum membrane potential is seen. Similar results were observed by Cook and Young (1989) in their steady-state model.
Figure 10.
Dependence of fluid flow and apical membrane potential on location of K+ conductance at three different IP3 productions rates.
3.5. Location of Cl− channels
Existing models of the parotid acinar cell place Cl− channels exclusively in the apical membrane. However, Marty et al. (1984) reported basal Cl− channels in the rat lacrimal glands which similarly transport fluid from the interstitium to the lumen via osmosis.
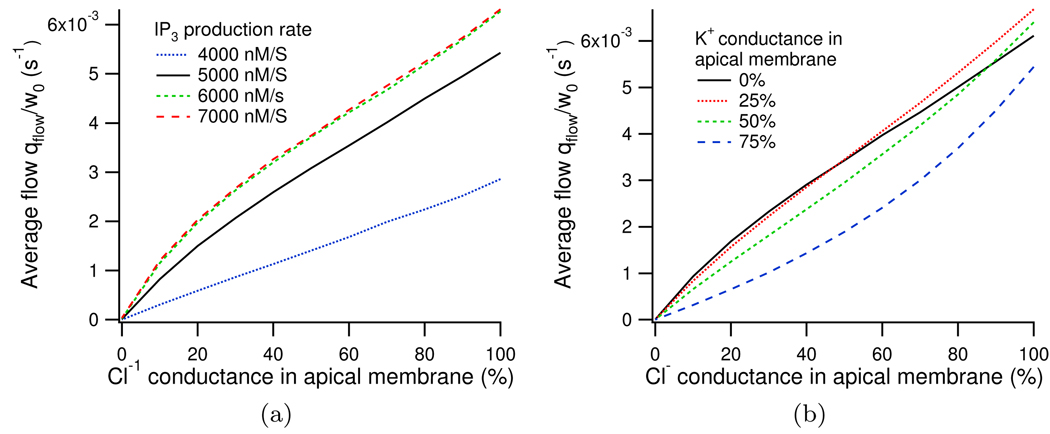
Using the same method of distributing the whole cell conductance between apical and basolateral membranes, as used above in Section 3.4, we can investigate the location of the Cl− channels. We find that maximum fluid secretion occurs when all the Cl− conductance is located in the apical membrane, supporting the traditional models. As Cl− is distributed into the basal membrane the average fluid flow is seen to decrease almost linearly, see Appendix H.
3.6. Effect of tight junctional resistance
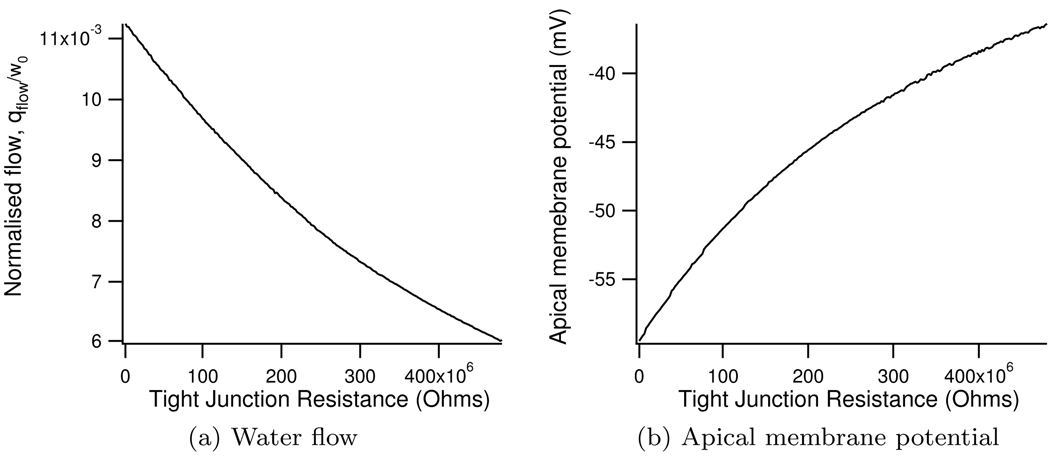
It can be seen in Figure 11a that as the resistance of the tight junction increases the fluid output from the model decreases. As the tight junctional resistance increases the flow of cations through the tight junction is reduced. This causes the apical membrane to depolarise (Figure 11b), which inhibits the flow of Cl− through the apical Cl− channel and thus reduces the water flow.
Figure 11.
Change in normalised water flow and apical membrane potential with tight junctional resistance
3.7. The effect of water permeabilities on the model
The water permeabilities were chosen such that the majority of fluid would flow through the transcellular pathway, with only a small amount travelling through the tight junction. In Table 6 the effect of varying the water permeabilities are calculated, showing that the model is robust, with large changes in the parameters having very little effect on the average fluid flow and steady-state ionic concentrations.
Table 6.
The effect of water permeability on the model
| Water permeabilities | Average Fluid flow | Steady state concentrations (mM) | ||
|---|---|---|---|---|
| {LPa,LPb,LPt} | qflow/w0 (s−1) | [Cl]l | [K]l | [Na]l |
| {LPa,LPb,LPt} | 6.10948 × 10⁻³ | 124.27 | 5.59 | 118.68 |
| {10 × LPa,LPb,LPt} | 6.16029 × 10⁻³ | 124.27 | 5.58 | 118.49 |
| {0.1 × LPa,LPb,LPt} | 5.14813 × 10⁻³ | 124.07 | 5.74 | 121.85 |
| {LPa,10 × LPb,LPt} | 6.08307 × 10⁻³ | 124.59 | 5.59 | 118.69 |
| {LPa,0.1 × LPb,LPt} | 5.99480 × 10⁻³ | 124.26 | 5.64 | 119.77 |
| {LPa,LPb,10 × LPt} | 6.12486 × 10⁻³ | 125.42 | 5.58 | 118.50 |
| {LPa,LPb,0.1 × LPt} | 6.06686 × 10⁻³ | 124.09 | 5.59 | 118.70 |
4. Discussion
The model we have developed here with intracellular Ca2+ oscillations driving secretion via secondary chloride transport we have shown to be consistent with a range of experimental data and extends previous parotid acinar cell models by Gin et al. (2007) and Cook and Young (1989). Ca2+ oscillations that previously depended on volume oscillations (Gin et al. (2007)) or were altogether absent (Cook and Young (1989)) are now based on physiological models of the IPR and IP3 dynamics. Independent apical and basal membrane potentials allow for the inclusion of an apical K+ channel and an understanding of how potentials change during stimulation.
There remain some differences between model predictions and experimental observation that warrant further comment. In Figure 7 Ca2+ oscillations are seen instantaneously with the reintroduction of Jin. Experimentally, Ca2+ oscillations are not seen immediately but instead return after a delay where the cytosolic Ca2+ slowly increases. This delay in oscillations experimentally can be explained by the gradual increase in the Ca2+ influx as the external Ca2+-free solution is replaced by a solution containing Ca2+. In our model, however, the term Jin has no dependence on extracellular Ca2+ so is applied suddenly causing instantaneous oscillations.
It should also be noted that experimentally when external Ca2+ is reintroduced the cytosolic Ca2+ increases to a peak slightly above the value seen when first stimulated. This is not seen in our model. This difference can be explained by the absence of Ca2+ release-activated Ca2+ channels (CRAC) or store-operated channels (SOC) in our model. CRAC and SOC are situated on the plasma membrane and bring Ca2+ into the cytoplasm at varying rates dependent on ER Ca2+ levels, increasing when the internal stores are depleted.
Upon stimulation with agonist, concentrations of ions behave in the model as seen experimentally. Some slight inconsistencies are found with the magnitude of concentration and volume changes upon stimulation. Foskett (1990) saw a 50% reduction in cytosolic Cl+ upon stimulation, whereas only a 30% reduction is seen in our model. Similarly Soltoff et al. (1989) found Na+ to double in the cytoplasm upon stimulation, a much larger increase than the 40% found in the model results. Experimentally Foskett and Melvin (1989) observed volume oscillations between 0.85 and 1 times the resting cell volume with agonist induced Ca2+ oscillations. However our model results show only small amplitude oscillations of cell volume. The above discrepancies could be due to the amplitude of the Ca2+ oscillations in our model. Upon stimulation with agonist Ca2+ increases from its steady state of 50 nM to oscillate around 140 nM. However Foskett and Melvin (1989) see Ca2+ increase from 60 nM to 474 nM upon stimulation, 3 times the Ca2+ concentration in our model results.
Poulsen and Bundgaard (1994) measured the apical membrane of the parotid acinar cell to be more than 12 times smaller in surface area than the basal membrane. However it is the apical membrane through which Cl− exits to the lumen and is therefore essential for saliva production. Extending the work of Gin et al. (2007) we include both an apical and basal membrane with distinct properties in our model. Several attempts have been made to measure the potentials of these two membranes. There is agreement that at the basal membrane the cytoplasm is negative with respect to the lumen. Values found experimentally range between −33 mV and −65 mV. Where there is disagreement is in whether, at steady-state, the lumen is negative or positive with respect to the interstitium. Berridge and Prince (1972) and Lundberg (1957) claim the lumen is positive with respect to the interstitium whilst Young (1968), Martin et al. (1973) and Lang and Walz (2001) find negative readings. A feature of our model is the movement of Na+ and K+ ions through the tight junction into the lumen which requires a lumen negative driving force we therefore lumen negative with respect to the interstitium at steady-state. Our model agrees with experimental findings that the lumen becomes more negative when stimulated with agonist (Berridge and Prince (1972), Lundberg (1957), Lang and Walz (2001)). The reader should be aware that we are cautious relying entirely on readings by Berridge and Prince (1972) and Lang and Walz (2001) which are taken from insects, where the salivation process is thought to be very different to mammals. However these readings are reconfirmed by similar recording in mammals.
The current through the tight junction is determined by the voltages of the apical and basal membranes and the resistance of the tight junction. There is very little experimental data as to the size of ionic currents through the tight junction or what the resistance to ionic flow must be. In our model the tight junctional resistance is fit to ensure a correct difference between apical and basal membrane potentials. The parameter gt,Na then assigns the fraction of tight junctional current that results from Na+ and K+ movement. Simulations were run allowing for Cl− movement through the tight junction but the addition of large tight junctional Cl− only decreased the fluid production slightly. As the resistance of the tight junction to cations increases, fluid flow was seen to decrease due to a depolarisation of the apical membrane and a subsequent reduction in Cl− movement into the lumen.
Mangos et al. (1973) measured the ionic concentrations of the primary fluid. We expect these to be consistent with the luminal concentrations found by our model. Mangos et al. (1973) found the Na+ concentration in the primary fluid to be 141.6 mM, higher than the Cl− concentration found, 112.6 mM. Our model is created such that Na+ moves through the tight junction to the lumen to balance the movement of negatively charged Cl− into the lumen through the Cl− channels. It is a constraint of our model that the luminal Na+ can never be greater than the luminal Cl− concentration. In order to recreate experimental concentrations of Na+ in the lumen the model would require the addition of a mechanism bringing other negatively charged ions into the lumen. Evans et al. (2000) find that impairing the Na+-K+-2Cl− cotransporter reduces saliva secretion by 60%. However this impairment does not stop saliva production entirely and a significant fluid flow is still observed. A second mechanism for Cl− uptake into the cell is thought to exist in the form of a Cl−- paired with a Na+-H+ exchanger. This mechanism using allows saliva production to continue even when the Na+-K+-2Cl− cotransporter is removed. The presence of these Cl−- exchangers has been found in rat sublingual gland. Future work will include modelling of in the cell. The addition of could provide the necessary negative ion movement into the lumen required to find experimentally observed luminal Na+ concentrations that our current model is unable to reproduce.
Our model uses fitted parameters for water permeability. Poulsen and Bundgaard (1994) found the basolateral membrane surface area to be 12.32 times larger than the apical membrane surface area. In our model we assume permeability per area is the same for both the membranes and therefore LPb = 12.32 × LPa. The permeability per unit area of the tight junction is seen by Berry (1983) to be higher than that of the apical or basal membrane. However, the tight junction is assumed to have a very small area in comparison to the two membrane and therefore LPt is small. Ma et al. (1999) found that knocking out APQ5 reduced saliva secretion by great than 60%. Experimentally, if we were to effectively block all aquaporins we could make a prediction of the relative paracellular pathway of fluid flow to the lumen, giving us an idea of the size of LPt in relation to LPa and LPb. Changes to the model water permeabilities were found to make very little effect to the volume of saliva produced or the the steady-state concentrations.
We investigated the effect the distribution of K+ channels had on fluid output. Our results agree with those found by Cook and Young (1989) where a small conductance through an apical K+ was found to increase fluid flow. The additional movement of positive ions through the apical membrane was initially able to reduce the apical membrane potential and facilitate the flow of Cl− through the Cl− channel. However as K+ conductance is distributed away from the basal membrane a depolorisation of the basal membrane is observed, this inhibits the effectiveness of the Na+-K+-ATPase, which in turn causes a decrease in the flux of the Na+-K+-2Cl−. The movement of Cl− into the cytoplasm is then reduced and fluid flow is similarly reduced. This accounts for the initial increase in fluid output followed by a decrease as the conductance is moved to the apical membrane.
As agonist concentration increases both the mean and frequency of the Ca2+ oscillations increases and an increase in saliva production is seen. However if we increase agonist but scale the mean Ca2+ to some base concentration no significant change in saliva production is found. We therefore conclude that Ca2+ oscillation frequency has no effect on saliva production. Presently our model is non spatial and Ca2+ concentration is the only direct factor in fluid production. However the entry or exit of ions in the cell is distinctly distributed in either the apical or basal membrane. Ca+ waves have been seen in parotid acinar cells by Won et al. (2007) and may be important in the signalling process required to initiate saliva production. We plan to build a spatial model of the parotid cell and investigate how Ca+ waves and specifically frequency affect saliva production. Currently our model produces Ca+ oscillations with a smaller amplitude than seen experimentally. The addition of spatial Ca+ to the model could solve this problem with high micro-domain Ca+ concentrations around the ER receptors causing an increased release of Ca+ from the ER and subsequently larger amplitude Ca2+ oscillations.
Table 4.
| Parameter values for ion movement | |||||
|---|---|---|---|---|---|
| Physical constants | |||||
| R | 8.315 J mol−1 K−1 | T | 310 K | F | 96490 C mol−1 |
| Whole cell conductance’s | |||||
| gCl | 31.4 nS * | gK | 14 nS ** | ||
| Pump Densities | |||||
| αNaK | 2.236 × 10⁻¹⁷ mol | αNKCC | 3.2 × 10⁻¹⁷ mol | ||
| Volumes | |||||
| w0 | 10− 12 L | wL/w0 | 0.02 | ||
| Water permeabilities | |||||
| LPa | 1.68 × 10⁻¹⁵ L2 J−1 s−1 | LPb | 2.07 × 10⁻¹⁴ L2 J−1 s−1 | ||
| LPt | 8.4 × 10⁻¹⁷ L2 J−1 s−1 | ||||
| Cell properties | |||||
| Cm | 10−11F | x/w0 | 30.7 mM | ||
| Electrical parameters | |||||
| Rtight | 6.8 × 10⁸ ohms | Rcell | 0 | gt,Na | 0.955 |
| Ionic valence | |||||
| zCl | −1 | zK | +1 | zNa | +1 |
| zCa | +2 | ||||
from Arreola et al. (1996),
from Thompson and Begenisich (2006), other parameters are physical constants or model fits chosen to give the correct steady state concentrations and membrane potentials.
Table C.7.
Values from Benjamin and Johnson (1997)
| Parameter values for Na+ - K+ - 2Cl− cotransporter | |||||
|---|---|---|---|---|---|
| Rate constants | |||||
|
|
1406 s−1 |
|
4025 s−1 | ||
|
|
37767 s−1 |
|
13196 s−1 | ||
| Dissociation constants | |||||
| KCl | 2.42 mM | KK | 234.74 mM | ||
| KNa | 22.38 mM | ||||
Table D.8.
Values from Smith and Crampin (2004) with the exception of [MgATP], [MgADP] and [Pi]
| Parameter values for Na+ - K+ - ATPase | |||||
|---|---|---|---|---|---|
| Rate constants | |||||
|
|
1050 s−1 |
|
172.1 s−1 mM−1 | ||
|
|
481 s−1 |
|
40 s−1 | ||
|
|
2000 s−1 |
|
79300 s−1 mM−2 | ||
|
|
320 s−1 |
|
40 s−1 | ||
| Dissociation constants | |||||
|
|
15.5 mM | 2.49 mM | |||
| Kd,Ke | 0.213 mM | Kd,Ki | 0.5 mM | ||
| Kd,MgATP | 2.51 mM | ||||
| Other parameters | |||||
| [MgATP] | 4.99 mM | [MgADP] | 0.06 mM | ||
| [Pi] | 4.95 mM | [H+] | 1000 × 10−pH mM | ||
| pH | 7.09 | Δ | −0.031 | ||
Acknowledgments
Thanks to Kate Patterson, Ivo Siekmann, Oliver Maclaren at the University of Auckland and Ted Begenisich and James Melvin at the University of Rochester for their comments on an earlier version of this manuscript. We also thank Bill Holmes at Indiana University for his help with simplifying the NaK. This work was supported by National Institutes of Health (NIH) Grant R01-DE19245.
Appendix A
Cl− channel
The main driving force of the fluid flow is the chloride channels located in the apical membrane. We use a model developed by Arreola et al. (1996). The steady state open probability of the chloride channels is given by,
| (A.1) |
where
| (A.2) |
| (A.3) |
Here Va is the membrane potential of the apical membrane. Total current through the Cl− channels is then given by,
| (A.4) |
gCl is the maximum whole cell conductance, 31.4 nS found by Arreola et al. (1996). VCl is the Nernst potential given by,
| (A.5) |
zCl = −1 is the valence of Cl−, R = 8.315 J mol−1 K−1, T = 310 K and F = 96490 C mol−1.
Appendix B
K+ channels
We use the model of Takahata et al. (2003), here the open probability of the K+ channel is,
| (B.1) |
where nH = 2.54 and Kd = 0.182µM. Kd is modified from the value found by Takahata et al. (2003) of Kd = 0.43µM to give a small open probability at steady state Ca2+ concentrations.
The current through the K+ channel at the basolateral membrane, IK,ba, and the apical membrane, IK,ap, are given by
| (B.2) |
| (B.3) |
respectively, where gK is the maximum whole cell conductance of 14 nS, the value found by Thompson and Begenisich (2006). The factor αK denotes the fraction of whole cell conductance in the basal membrane leaving 1 − αK in the apical membrane. VK,ba and VK,ap are the nernst potentials at both the basolateral and apical membranes,
| (B.4) |
| (B.5) |
here zK = +1 is the valence of K+.
Appendix C
Na+ - K+ - 2Cl− cotransporter
We present a model by Benjamin and Johnson (1997) which was used in a previous model of the parotid acinar cell by Gin et al. (2007) for comparison with the simplified model show in Appendix E. The whole cell flux is then given by,
| (C.1) |
where αNKCC is the density of the cotransporter.
| (C.2) |
where
| (C.3) |
and
with
Where Lion is the reciprocal of Kion. Finally
| (C.4) |
Appendix D
Na+ - K+ - ATPase
Here we present the original four-state model of the NaK used by Gin et al. (2007) in their model of the the parotid acinar, for comparison to the two-state simplification shown in Appendix F. Details of the original four-state simplification can be found in Smith and Crampin (2004). The flux through the NaK exchanger is given by,
| (D.1) |
where αNaK is the density of the Na+ - K+ - ATPase.
Steady state flux is given by,
| (D.2) |
where,
| (D.3) |
| (D.4) |
where
| (D.5) |
| (D.6) |
| (D.7) |
| (D.8) |
Finally
| (D.9) |
Appendix E
Na+ - K+ - 2Cl− cotransporter simplification
We construct a two-state simplification of the model by Benjamin and Johnson (1997), the original model can be seen in Appendix C. Given an outside state, O and an inside state I we assume simultaneous binding and unbinding of Cl−, Na+ and K+. Denoting as the ions outside the cell and as ions inside the cell, the model can be written as,
| (E.1) |
By setting the resulting scheme of differential equations to steady state and assuming the outside ions are supplied at a constant rate J, the same rate at which the inside ions are removed, we find the steady-state flux:
| (E.2) |
The steady-state flux through the cotransporter, νNKCC is equal to the rate at which ions are supplied on the cells exterior and removed on the cells interior. Therefore we have an expression for the whole cell flux which depends on four constants (reduced from seven constants in the original model),
| (E.3) |
We now complete a parameter search to best approximate the original model by Benjamin and Johnson (1997) over a physiologically reasonable range of ionic concentrations. We can then simplify the flux through the cotransporter as,
| (E.4) |
Then JNKCC = νNKCCαNKCC where αNKCC is the membrane density of the cotransporter.
Appendix F
Na+ - K+ - ATPase simplification
The Na+ - K+ - ATPase exchanges two external K+ ions for three internal Na+ at the expense of energy. We write a two state scheme simplification of the original model by Smith and Crampin (2004), the original model can be seen in Appendix D.
| (F.1) |
| (F.2) |
By setting the resulting system of differential equations to steady state, and assuming external K+ and internal Na+ get supplied at a constant rate, J we get
| (F.3) |
If we assume that the forward reaction rates are higher than the reverse rates, and , and that the steady-state flux through the Na+ - K+ - ATPase, νNaK, is equal to the constant rate J, then
| (F.4) |
We match our simplified model to the original by Smith and Crampin (2004) to find the two model constants (a great reduction from the 18 in the original model). We find our constant to be, r = 1.305 × 10⁶ and α = 0.647.
Then JNaK = αNaKνNaK, where αNaK is the density of the Na+ - K+ - ATPase exchanger.
Appendix G
Comparing simulations run with simplified NKCC and NaK models versus the more complex models
We compare simulations run with the simplified NKCC and NaK seen in Appendix E and Appendix F to those run with the more complicated models in Appendix C and Appendix D. In Figure G.12 we can see that there is no qualitative difference between the fluid flow predicted by the two simulations.
Figure G.12.
A comparison between a model simulation run with (a) the simplified NKCC and NaK fluxes found in Appendix E, Appendix F and (b) run with more complicated 4-state models found in Appendix C and Appendix D. ν = 5100 nM/s for duration to simulate continuous stimulation with agonist.
All parameters are the same between the two simulations, and are those given in the main body of this manuscript, with the exception of αNKCC = 2.3 × 10⁻¹⁶ for the simulation with complicated transporters (Figure G.12b). If we compare the average fluid flow over a 300 second simulation (Table G.9) we see that simplifying the parameters only affects the result by 3%.
Table G.9.
Comparison between simulations runs with complicated NKCC and NaK (Appendix C, Appendix D) and the simplified versions (Appendix E, Appendix F). ν = 5100 nM/s for duration to simulate continuous stimulation with agonist.
| Average fluid flow over 300 second simulation | |
|---|---|
| Original transporter models | Simplified transporters |
| 5.954548 × 10⁻³ | 5.766172 × 10⁻³ |
Appendix H
Location of Cl− channels
Similar to the apical and basal K+ currents in Appendix B we define two Cl− currents, one in the apical and one in the basal membrane.
| (H.1) |
| (H.2) |
where
| (H.3) |
and
| (H.4) |
Given the possibility of an basal Cl− channel we must alter the equations for membrane potential seen in Section 2.5, we now have,
| (H.5) |
| (H.6) |
Then using the parameters αCl we can distribute the whole cell Cl− conductance between the apical and basal membranes.
In Figure H.13 it can be seen that regardless of IP3 production rate, ν, or the distribution of K+ channels, the maximum fluid flow is always seen to occur when all of the Cl− channels are located in the apical membrane.
Figure H.13.
Change in normalised water flow with distribution of Cl− channels, in (a) with varying IP3 production rates and in (b) with varying K+ distributions.
Footnotes
Publisher's Disclaimer: This is a PDF file of an unedited manuscript that has been accepted for publication. As a service to our customers we are providing this early version of the manuscript. The manuscript will undergo copyediting, typesetting, and review of the resulting proof before it is published in its final citable form. Please note that during the production process errors may be discovered which could affect the content, and all legal disclaimers that apply to the journal pertain.
References
- Arreola J, Melvin J, Begenisich T. Activation of calcium-dependent chloride channels in rat parotid acinar cells. The Journal of General Physiology. 1996;108(1):35–47. doi: 10.1085/jgp.108.1.35. [DOI] [PMC free article] [PubMed] [Google Scholar]
- Benjamin BA, Johnson EA. A quantitative description of the Na-K-2Cl cotransporter and its conformity to experimental data. AJP - Renal Physiology. 1997;273(3):F473–F482. doi: 10.1152/ajprenal.1997.273.3.F473. [DOI] [PubMed] [Google Scholar]
- Berridge MJ, Prince WT. Transepithelial potential changes during stimulation of isolated salivary glands with 5-hydroxytryptamine and cyclic Amp. Journal of Experimental Biology. 1972;56(1):139–153. doi: 10.1242/jeb.56.1.139. [DOI] [PubMed] [Google Scholar]
- Berry C. Water permeability and pathways in the proximal tubule. The American journal of physiology. 1983;245(3):F279. doi: 10.1152/ajprenal.1983.245.3.F279. [DOI] [PubMed] [Google Scholar]
- Bruce JIE, Shuttleworth TJ, Giovannucci DR, Yule DI. Phosphorylation of inositol 1,4,5-trisphosphate receptors in parotid acinar cells. a mechanism for the synergistic effects of cAMP on Ca2+ signaling. J Biol Chem. 2002;277(2):1340–1348. doi: 10.1074/jbc.M106609200. [DOI] [PubMed] [Google Scholar]
- Camello P, Gardner J, Petersen OH, Tepikin AV. Calcium dependence of calcium extrusion and calcium uptake in mouse pancreatic acinar cells. The Journal of Physiology. 1996;490(Pt 3):585–593. doi: 10.1113/jphysiol.1996.sp021169. [DOI] [PMC free article] [PubMed] [Google Scholar]
- Cook DI, Young JA. Effect of K+ channels in the apical plasma membrane on epithelial secretion based on secondary active Cl− transport. Journal of Membrane Biology. 1989;110(2):139–146. doi: 10.1007/BF01869469. [DOI] [PubMed] [Google Scholar]
- Evans R, Park K, Turner R, Watson G, Nguyen H, Dennett M, Hand A, Flagella M, Shull G, Melvin J. Severe impairment of salivation in Na+/K+/2Cl− cotransporter (NKCC1)-deficient mice. Journal of Biological Chemistry. 2000;275(35):26720. doi: 10.1074/jbc.M003753200. [DOI] [PubMed] [Google Scholar]
- Foskett J, Melvin J. Activation of salivary secretion: coupling of cell volume and [Ca2+]i in single cells. Science. 1989;244(4912):1582–1585. doi: 10.1126/science.2500708. [DOI] [PubMed] [Google Scholar]
- Foskett JK. [Ca2+]i modulation of Cl− content controls cell volume in single salivary acinar cells during fluid secretion. AJP - Cell Physiology. 1990;259(6):C998–C1004. doi: 10.1152/ajpcell.1990.259.6.C998. [DOI] [PubMed] [Google Scholar]
- Gin E, Crampin EJ, Brown DA, Shuttleworth TJ, Yule DI, Sneyd J. A mathematical model of fluid secretion from a parotid acinar cell. Journal of Theoretical Biology. 2007;248(1):64–80. doi: 10.1016/j.jtbi.2007.04.021. [DOI] [PMC free article] [PubMed] [Google Scholar]
- Gin E, Falcke M, Wagner LEn, Yule DI, Sneyd J. A kinetic model of the inositol trisphosphate receptor based on single-channel data. Biophys J. 2009;96(10):4053–4062. doi: 10.1016/j.bpj.2008.12.3964. [DOI] [PMC free article] [PubMed] [Google Scholar]
- Izutsu KT, Johnson DE. Changes in elemental concentrations of rat parotid acinar cells following pilocarpine stimulation. The Journal of Physiology. 1986;381(1):297–309. doi: 10.1113/jphysiol.1986.sp016328. [DOI] [PMC free article] [PubMed] [Google Scholar]
- Keizer J, Levine L. Ryanodine receptor adaptation and Ca2+(−)induced Ca2+ release-dependent Ca2+ oscillations. Biophysical Journal. 1996;71(6):3477–3487. doi: 10.1016/S0006-3495(96)79543-7. [DOI] [PMC free article] [PubMed] [Google Scholar]
- Lang I, Walz B. Dopamine-induced epithelial K+ and Na+ movements in the salivary ducts of periplaneta americana. Journal of Insect Physiology. 2001;47(4–5):465–474. doi: 10.1016/s0022-1910(00)00134-7. [DOI] [PubMed] [Google Scholar]
- Lundberg A. Secretory Potentials in the Sublingual Gland of the Cat. Acta Physiologica Scandinavica. 1957;40(1):21–34. doi: 10.1111/j.1748-1716.1957.tb01475.x. [DOI] [PubMed] [Google Scholar]
- Lytton J, Westlin M, Burk SE, Shull GE, MacLennan DH. Functional comparisons between isoforms of the sarcoplasmic or endoplasmic reticulum family of calcium pumps. Journal of Biological Chemistry. 1992;267(20):14483–14489. [PubMed] [Google Scholar]
- Ma T, Song Y, Gillespie A, Carlson EJ, Epstein CJ, Verkman AS. Defective Secretion of Saliva in Transgenic Mice Lacking Aquaporin-5 Water Channels. Journal of Biological Chemistry. 1999;274(29):20071–20074. doi: 10.1074/jbc.274.29.20071. [DOI] [PubMed] [Google Scholar]
- Mangos J, McSherry N, Nousia-Arvanitakis S, Irwin K. Secretion and transductal fluxes of ions in exocrine glands of the mouse. AJP. 1973;225(1):18–24. doi: 10.1152/ajplegacy.1973.225.1.18. [DOI] [PubMed] [Google Scholar]
- Martin CJ, Frömter E, Gebler B, Knauf H, Young JA. The effects of carbachol on water and electrolyte fluxes and transepithelial electrical potential differences of the rabbit submaxillary main duct perfusedin vitro. Pflügers Archiv European Journal of Physiology. 1973;341(2):131–142. doi: 10.1007/BF00587320. [DOI] [PubMed] [Google Scholar]
- Marty A, Tan YP, Trautmann A. Three types of calcium-dependent channel in rat lacrimal glands. The Journal of Physiology. 1984;357(1):293–325. doi: 10.1113/jphysiol.1984.sp015501. [DOI] [PMC free article] [PubMed] [Google Scholar]
- Nauntofte B. Regulation of electrolyte and fluid secretion in salivary acinar cells. AJP - Gastrointestinal and Liver Physiology. 1992;263(6):G823–G837. doi: 10.1152/ajpgi.1992.263.6.G823. [DOI] [PubMed] [Google Scholar]
- Politi A, Gaspers LD, Thomas AP, Hofer T. Models of IP3 and Ca2+ oscillations: frequency encoding and identification of underlying feedbacks. Biophys J. 2006;90(9):3120–3133. doi: 10.1529/biophysj.105.072249. [DOI] [PMC free article] [PubMed] [Google Scholar]
- Poulsen J, Bundgaard M. Quantitative estimation of the area of luminal and basolateral membranes of rat parotid acinar cells: some physiological applications. Pfl ”ugers Archiv European Journal of Physiology. 1994;429(2):240–244. doi: 10.1007/BF00374318. [DOI] [PubMed] [Google Scholar]
- Sims CE, Allbritton NL. Metabolism of inositol 1,4,5-trisphosphate and inositol 1,3,4,5-tetrakisphosphate by the oocytes of xenopus laevis. Journal of Biological Chemistry. 1998;273(7):4052–4058. doi: 10.1074/jbc.273.7.4052. [DOI] [PubMed] [Google Scholar]
- Smith NP, Crampin EJ. Development of models of active ion transport for whole-cell modelling: cardiac sodium-potassium pump as a case study. Prog Biophys Mol Biol. 2004;85(2–3):387–405. doi: 10.1016/j.pbiomolbio.2004.01.010. [DOI] [PubMed] [Google Scholar]
- Sneyd J, Tsaneva-Atanasova K, Reznikov V, Bai Y, Sanderson MJ, Yule DI. A method for determining the dependence of calcium oscillations on inositol trisphosphate oscillations. Proceedings of the National Academy of Sciences of the United States of America. 2006;103(6):1675–1680. doi: 10.1073/pnas.0506135103. [DOI] [PMC free article] [PubMed] [Google Scholar]
- Sneyd J, Wetton BT, Charles AC, Sanderson MJ. Intercellular calcium waves mediated by diffusion of inositol trisphosphate: a two-dimensional model. Am J Physiol Cell Physiol. 1995;268(6):C1537–C1545. doi: 10.1152/ajpcell.1995.268.6.C1537. [DOI] [PubMed] [Google Scholar]
- Soltoff S, McMillian M, Cantley L, Cragoe E, Jr, Talamo B. Effects of muscarinic, alpha-adrenergic, and substance P agonists and ionomycin on ion transport mechanisms in the rat parotid acinar cell. The dependence of ion transport on intracellular calcium. Journal of General Physiology. 1989;93(2):285–319. doi: 10.1085/jgp.93.2.285. [DOI] [PMC free article] [PubMed] [Google Scholar]
- Sørensen J, Nielsen M, Gudme C, Larsen E, Nielsen R. Maxi K+ channels co-localised with CFTR in the apical membrane of an exocrine gland acinus: possible involvement in secretion. Pfl ”ugers Archiv European Journal of Physiology. 2001;442(1):1–11. doi: 10.1007/s004240000493. [DOI] [PubMed] [Google Scholar]
- Takahata T, Hayashi M, Ishikawa T. Sk4/ik1-like channels mediate tea-insensitive, ca2+-activated k+ currents in bovine parotid acinar cells. AJP - Cell Physiology. 2003;284(1):C127–C144. doi: 10.1152/ajpcell.00250.2002. [DOI] [PubMed] [Google Scholar]
- Thompson J, Begenisich T. Membrane-delimited inhibition of maxi-K channel activity by the intermediate conductance Ca2+-activated K channel. J Gen Physiol. 2006 Feb;127(2):159–169. doi: 10.1085/jgp.200509457. [DOI] [PMC free article] [PubMed] [Google Scholar]
- Turner R, Paulais M, Manganel M, Lee S, Moran A, Melvin J. Ion and water transport mechanisms in salivary glands. Critical Reviews in Oral Biology and Medicine. 1993;4:385–385. doi: 10.1177/10454411930040031801. [DOI] [PubMed] [Google Scholar]
- Turner R, Sugiya H. Understanding salivary fluid and protein secretion. Oral diseases. 2002;8(1):3–11. doi: 10.1034/j.1601-0825.2002.10815.x. [DOI] [PubMed] [Google Scholar]
- Warren N, Tawhai M, Crampin E. A mathematical model of calcium-induced fluid secretion in airway epithelium. Journal of Theoretical Biology. 2009;259(4):837–849. doi: 10.1016/j.jtbi.2009.04.026. [DOI] [PubMed] [Google Scholar]
- Warren NJ, Tawhai MH, Crampin EJ. Mathematical modelling of calcium wave propagation in mammalian airway epithelium: evidence for regenerative ATP release. Experimental Physiology. 2010;95(1):232–249. doi: 10.1113/expphysiol.2009.049585. [DOI] [PubMed] [Google Scholar]
- Won J, Cottrell W, Foster T, Yule D. Ca2+ release dynamics in parotid and pancreatic exocrine acinar cells evoked by spatially limited flash photolysis. American Journal of Physiology-Gastrointestinal and Liver Physiology. 2007;293(6):G1166. doi: 10.1152/ajpgi.00352.2007. [DOI] [PubMed] [Google Scholar]
- Young JA. Microperfusion investigation of chloride fluxes across the epithelium of the main excretory duct of the rat submaxillary gland. Pflügers Archiv European Journal of Physiology. 1968;303(4):366–374. doi: 10.1007/BF00596392. [DOI] [PubMed] [Google Scholar]


