

Abstract
Human satellite cells (SCs) are heterogeneous with respect to markers for their identification in the niche between the muscle fibre plasma membrane and its basal lamina. We have previously shown that, in biopsies from highly competitive power lifters, power lifters with long-term use of anabolic steroids and a population of healthy sedentary men, antibodies against the neuronal cell adhesion molecule (NCAM) and the paired box transcription factor Pax7 together label 94% of the SCs, NCAM alone labels 4% and Pax7 alone labels 1%. In the present study, we have further studied these biopsies with four markers related to SC activation and differentiation. Our study unequivocally shows that staining for MyoD and myogenin are present in nuclei of SCs and of myoblasts and myotubes in areas of muscle fibre regeneration. Staining for c-Met was observed in a proportion of Pax7+ SCs. However, widespread labelling of the sarcolemma precluded the quantification of c-Met+/Pax7+ SCs and the use of c-Met as a reliable SC marker. Pax7+ SCs labelled by anti-Delta like1 (Dlk1) were present in all samples but in variable proportions, whereas muscle progenitor cells related to repair were Dlk1−. Staining for Dlk1 was also observed in Pax7− interstitial cells and in the cytoplasm of some small muscle fibres. Interestingly, the proportion of Dlk1+/Pax7+ SCs was significantly different between the groups of power lifters. Thus, our study confirms that human SCs show marked heterogeneity and this is discussed in terms of SC activation, myonuclei turnover, muscle fibre growth and muscle fibre damage and repair.
Keywords: Skeletal muscle satellite cells, Myogenic regulatory factors, Pax7, Dlk1/FA1, Strength training, Anabolic steroids
Introduction
Satellite cells (SCs) have, since their identification between the muscle fibre plasma membrane and its basal lamina, traditionally been associated with muscle damage and repair (Bischoff and Franzini-Armstrong 2004). However, in the last decade, an additional focus has been made on SCs as stem cells and candidates for cell-based therapies to treat muscular dystrophies and other neuromuscular diseases. This research on SC molecular and cellular biology has been so far done mostly in vitro using cultured cells and isolated muscle fibres with adhering SCs, or in in vivo studies on molecular engineered rodents (Amthor et al. 2006; Gnocchi et al. 2009; Nagata et al. 2006). Research on human SCs in vivo has been focused on their relation to ageing, exercise and growth (for reviews, see (Degens 2007; Eriksson 2006; Kadi et al. 2005; Snijders et al. 2009; Thornell et al. 2003).
SCs were primarily only detectable with electron microscopy, but can now be revealed at the light microscopic level using immunohistochemistry. In human muscle biopsies, antibodies against the adhesion molecules, neural cell adhesion molecule (NCAM) and M-cadherin, are widely used for SC identification (Charifi et al. 2003; Crameri et al. 2007; 2004; Kadi 2000; Kadi et al. 2005; 1999a; Mackey et al. 2007a; Mackey et al. 2007b; Olsen et al. 2006; Petrella et al. 2006; Reimann et al. 2004; Renault et al. 2002; Sajko et al. 2004; Verney et al. 2008) although they are not specific markers for SCs (Illa et al. 1992). In 2000, the transcription factor Pax7 was introduced as a specific marker for SCs in mice muscle (Seale et al. 2000). However, in human muscle biopsies, anti-Pax7 labels approximately 95% of all SCs in comparison to staining for M-cadherin (Reimann et al. 2004) or NCAM (Lindstrom and Thornell 2009). In our studies on the trapezius muscle of power lifters and sedentary men, the majority of SCs, 94.1%, were NCAM+ and Pax7+, whereas 4.7% were NCAM+ and Pax7− and 1.2% NCAM− and Pax7+. What this SC heterogeneity in human muscle reflects is unknown, but might indicate that the SCs are intrinsically different or that they are in different stages of quiescence, activation or differentiation.
Myogenic specification and differentiation of SCs in mature muscle closely recapitulate foetal myogenesis and are dependent on factors such as Myf5, MyoD, Mrf4 and myogenin. These factors are collectively known as the myogenic regulatory factors (MRFs). Expression of Myf5, MyoD and Mrf4 are related to activation and proliferation of SCs, whereas myogenin reflects terminal myoblast differentiation (Kuang et al. 2007; Tajbakhsh 2009). Several studies have aimed to study the expression of MyoD or myogenin in human muscle, but to the best of our knowledge, no study has shown their presence in SCs in vivo in resting skeletal limb muscle nor after sessions of training or bouts of intensive exercise (Crameri et al. 2007; 2004; Dreyer et al. 2006; Kadi et al. 2004).
Rodent muscle studies have shown SC heterogeneity based on different proliferative (Rantanen et al. 1995; Rossi et al. 2010) and myogenic capacities (Rossi et al. 2010) or variability in the expression of different SC markers (Beauchamp et al. 2000; Cornelison and Wold 1997; Holterman et al. 2007; Kuang et al. 2007). Based on heterogeneous expression of Myf5, it is suggested that mouse SCs are composed of two hierarchical subpopulations identified as Pax7+ and Myf5− stem cells (10%) and Pax7+ and Myf5+ committed myogenic progenitor cells (90%) (Kuang et al. 2007).
Delta like1 (Dlk1), also known as preadipocyte factor-1 (Pref-1) and pG2 (Lee et al. 1995), has also been related to a subpopulation of SCs (Crameri et al. 2004; Mackey et al. 2007a; White et al. 2008). Dlk1 is a transmembrane protein belonging to the epidermal growth factor (EGF)-like protein family that includes proteins containing tandem EGF repeats in their extracellular domain (D’Souza et al. 2008). The extracellular domain of Dlk1 can be proteolytically released and is referred to as fetal antigen 1 (FA1) (Wang and Sul 2006). Studies on human skeletal muscle using antibodies against Dlk1 have shown that it is highly expressed during muscle development and in muscle disorders (Andersen et al. 2009). Reports on the presence of Dlk1 in normal resting human muscle are highly divergent and vary between being practically absent (Andersen et al. 2009; Crameri et al. 2004) to being present in SCs and in cells located in between muscle fibres (Mackey et al. 2007b). Furthermore, it is not fully understood how the expression of Dlk1 is affected by exercise (Crameri et al. 2004; Mackey et al. 2007b).
c-Met, the receptor for hepatocyte growth factor (HGF), is generally considered to be present on both quiescent and activated SCs in rodents (Cornelison and Wold 1997; Hawke and Garry 2001). c-Met has been used as a marker for human myogenic cells in vitro (Ozeki et al. 2006) and in vivo as a total SC marker (Antunes-Foschini et al. 2006; De Luna et al. 2004), but knowledge on c-Met in human skeletal muscle in trained subjects are lacking.
In the present study, we have further explored the heterogeneity of human SCs in the biopsies of power lifters, power lifters using anabolic substances and control subjects. Our newly developed multiple marker (MM) method (Lindstrom and Thornell 2009) was used to compare staining for MyoD, myogenin, c-Met and Dlk1 with staining for NCAM or Pax7, which are the reference markers of SCs.
Materials and methods
Biopsies from the descending part of the trapezius muscle from 11 male power lifters and 6 healthy sedentary male controls (C) were thoroughly investigated. Five of the power lifters had never used anabolic drugs (P), whereas six had used high doses of anabolic substances (PAS). Vastus lateralis biopsies from the PAS subjects were also used. For a full description of the participant elite power lifters, their training regime and the substances used for doping see Eriksson et al. (2005). Handling of biopsies and their detailed analysis with respect to muscle fibre types, muscle fibre area, muscle pathology and SC frequency have been reported previously (Eriksson et al. 2005; Kadi et al. 1999a; 1999b; Lindstrom and Thornell 2009). Written consent in accordance with the World Medical Association “Declaration of Helsinki” was obtained from all the subjects. The study was approved by the Ethical Committee of Umeå University.
Immunohistochemistry
Serial frozen muscle cross sections (5 μm) were prepared as previously described (Lindstrom and Thornell 2009). The primary antibodies used are listed in Table 1. SCs were visualized using an MM protocol (Lindstrom and Thornell 2009) or by double labelling of a single SC marker (NCAM, Pax7, MyoD, myogenin, c-Met or Dlk1) in combination with staining for the basal lamina (laminin or laminin alpha 2 chain) or the myofibre plasma membrane (dystrophin) to discriminate between cells in the SC niche from adjacent cells and myonuclei. For the MM protocol, antibodies against NCAM or Pax7 were used as the reference markers for SC identification in combination with antibodies against MyoD, myogenin, c-Met or the transmembrane and extracellular (FA1) portion of Dlk1. Bound primary antibodies were visualized by indirect immunofluorescence using affinity-purified antibodies specifically prepared for multiple labelling and conjugated with fluorescein (FITC), Rhodamine Red-X (RRX) or Cyanine 5 (Cy5) (Jackson ImmunoResearch Laboratories Inc., West Grove, PA, USA). Nuclei were identified with 4′, 6-diamidino-2-phenylindole (DAPI) provided in the mounting medium (Vectashield®, Vector Laboratories Inc., Burlingame, CA, USA). Control sections were treated according to standard protocols except that the primary antibody was omitted.
Table 1.
Primary antibodies used
| Primary antibody target | Host species | Company | Catalogue number |
|---|---|---|---|
| Leu19/CD56/NCAM | Mouse | Beckton Dickinson, San Jose, CA, USA | 347740 |
| Pax7 | Mouse | Developmental Studies Hybridoma Bank, University of Iowa, USA | PAX7 |
| MyoD | Mouse | Dako, Glostrup, Denmark | M3512 |
| Myogenin | Mouse | Developmental Studies Hybridoma Bank, University of Iowa, USA | F5D |
| c-Met | Mouse | Novocastra Laboratories Ltd., UK | NCL-cMet |
| Dlk1 | Rabbit | Kindly provided by Profs C Harken Jensen and B Teisner, Odense, Denmark | |
| Dystrophin | Rabbit | Gene Tex, Inc. | GTX15277 |
| Laminin | Sheep | The Binding Site Ltd., Birmingham, UK | PC128 |
| Laminin alpha 2 chain | Mouse | Novocastra Laboratories Ltd., UK | NCL-Merosin |
| Nestin | Mouse | R&D Systems Inc. | MAB1259 |
| Vimentin | Mouse | Dako, Glostrup, Denmark | M0725 |
| Desmin | Mouse | Dako, Glostrup, Denmark | M0760 |
| Embryonic-MyHC | Mouse | Developmental Studies Hybridoma Bank, University of Iowa, USA | F1.652 |
| Foetal/perinatal-MyHC | Mouse | Novocastra Laboratories Ltd., UK | NCL-MHCn |
Light microscopy and analysis of immunostained sections
The sections were evaluated using a Nikon eclipse E800 microscope (Nikon Inc., Melville, NY, USA) equipped with fluorescence filters for FITC (MBE34133), Texas Red (MBE34172), FITC/Texas Red (MBE 34720), DAPI/FITC/Texas Red (MBE34820) (Nikon Inc., Melville, NY, USA) and Cy5 (HQ41008) (Chroma Technology Corp, Rockingham, USA). A SPOT RT KE slider camera (6 megapixel sampling) (Diagnostic Instruments Inc., Sterling Heights, MI, USA) was used for image acquisition.
Stained cross sections were analysed using different filter cubes and 20× and 40× objectives. High-resolution digital images were captured to cover the whole or a significant part of a large section using the 20× objective and used for detailed analysis and quantification using the Adobe Photoshop CS2 software (Adobe Systems Inc., Mountain View, CA, USA).
MyoD and myogenin-labelled SCs
For each subject, the number of SCs labelled by anti-MyoD was quantified on three sections and SCs labelled by anti-myogenin were counted on one section. The number of muscle fibres was counted on the section stained for MyoD or myogenin in combination with staining for dystrophin. Fibres with incomplete staining of the plasma membrane, visualized by staining for dystrophin, were not included in the analysis. The mean number of SCs per fibre (total SCs/fibre), previously calculated for each subject (Lindstrom and Thornell 2009) (i.e. all cells identified by their staining for Pax7 and/or NCAM inside the basal lamina of the myofibres divided by the total number of analysed myofibres) was used to estimate the proportion of SCs labelled by anti-MyoD and anti-myogenin. The following calculations were used: %MyoD+ SCs = [(number of MyoD+ SCs/number of fibres)/(total SCs/fibre)] × 100 and %myogenin+ SCs = [(number of myogenin+ SCs/number of fibres)/(total SCs/fibre)] × 100.
Dlk1-stained SCs
The proportion of Pax7+ SCs labelled by anti-Dlk1 for each subject was determined from all Pax7+ SCs identified in the cross section stained for Pax7, Dlk1, laminin and DAPI.
Statistics
All statistical analyses were performed using SPSS standard Version 17.0 (SPSS, Chicago, Illinois, USA). Residual analyses revealed no strong discrepancies from the one-way analysis of variance (ANOVA) assumptions. When the ANOVA test suggested statistical differences, the Tukey post hoc test was applied.
A χ2 test was used to compare the counts of MyoD+ and myogenin+ SCs. Statistical significance was accepted at p < 0.05. Data are presented as means and standard deviations.
Results
Staining for MyoD and myogenin
When using the MM method as previously described for two SC markers from the same species, i.e. antibodies against MyoD or myogenin applied as the second primary antibody, after the cell surface marker anti-NCAM, we noticed that staining for MyoD did not label any nuclei, whereas the combination with anti-NCAM worked well for labelling with anti-myogenin (Fig. 1). To overcome the lack of staining for MyoD together with staining for NCAM, analysis of new sections stained for MyoD only was performed under the microscope before further labelling. If staining for MyoD was observed, the sections were additionally labelled with anti-dystrophin and DAPI or anti-laminin and DAPI. This combination of labelling allowed us to examine whether MyoD-stained nuclei were in a SC position or within the myofibre plasma membrane, or whether they belonged to another cell type (Fig. 2). No nuclei labelled by anti-MyoD were observed outside the basal lamina. Thus, a MyoD+ nucleus was identified as belonging to a SC if it was observed outside the myofibre plasma membrane labelled by anti-dystrophin in otherwise normal fibres. To make sure that all nuclei at the periphery of myofibres labelled by anti-myogenin were also located outside the myofibre plasma membrane, additional adjacent sections were stained for myogenin, dystrophin and DAPI (Fig. 2). Interestingly, the staining for dystrophin was often thinner in the area between the MyoD+ or the myogenin+ SC and the myofibre. Furthermore, a thin rim of staining for dystrophin was often present exterior to the MyoD+ or myogenin+ nucleus (Fig. 2).
Fig. 1.
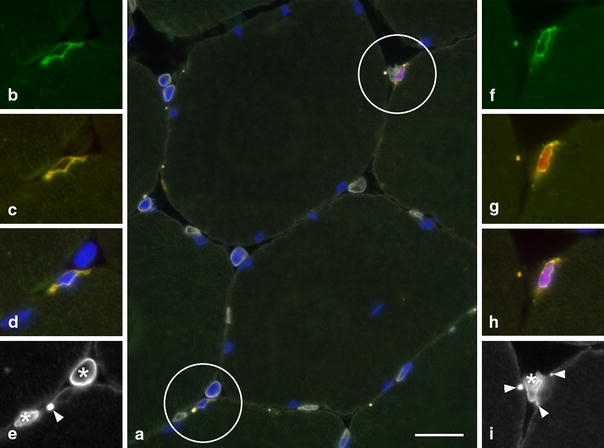
Cross section from trapezius muscle of a PAS subject stained for NCAM, myogenin, laminin and DAPI shown in a merged image of all markers in a. Two SCs are encircled and shown in higher magnification in single and merged images (insets b–e and f–i): b and f NCAM (green); c and g NCAM (green + red = yellow) and myogenin (red); d and h NCAM (yellow), myogenin (red) and DAPI (blue); e and i laminin (white). Note the distinct staining for myogenin in one of the SC (upper circle). b–e NCAM+/myogenin− SC and f–i NCAM+/myogenin+ SC. Auto fluorescent lipofuscin granules are indicated with small arrowheads in e and i. Capillaries (asterisks). Bar 20 μm
Fig. 2.
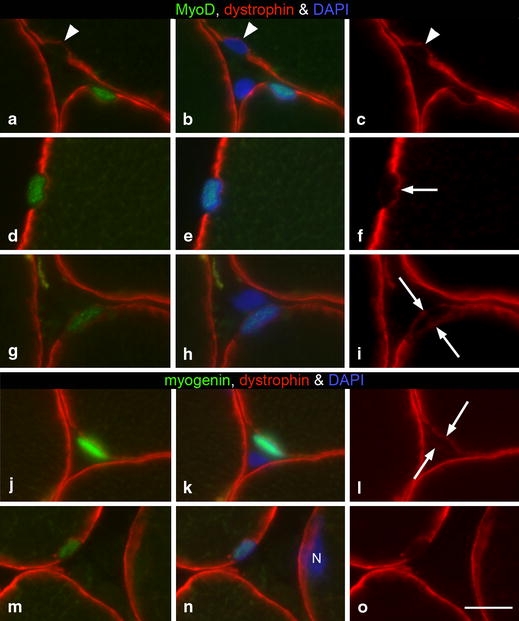
Cross sections from trapezius muscle of C, P and PAS subjects stained for MyoD or myogenin, dystrophin and DAPI to examine whether anti-MyoD and/or anti-myogenin labels SCs (i.e. nuclei located exterior to the staining for dystrophin of myofibres) and/or myonuclei (i.e. nuclei interior of the staining for dystrophin). a–c (PAS subject), d–f (P subject) and g–i (C subject) three MyoD+ nuclei located in a SC position exterior to the myofibre plasma membrane. Note also the MyoD− nucleus in a SC position (arrowheads a–c). j–l (C subject) and m–o (P subject) two myogenin+ nuclei located in a SC position exterior to the myofibre plasma membrane. Note in n, the myonucleus (N) not labelled by anti-myogenin. In j–l weak staining for anti-dystrophin is seen on both sides of the myogenin+ nucleus. Note the variability of anti-dystophin labelling on the outside of the MyoD+ and myogenin+ nuclei. A thin rim is evident in g–i and j–l. Arrows show the thin rim of staining for dystrophin interior to (f) and around (i and l) the SCs. Bar 10 μm
Staining for MyoD and myogenin was unquestionably present in some biopsies; however, the number of positive nuclei was low (Table 2). MyoD+ SCs were found in four of five individuals in the P group, three of five in the PAS group and in two of five in the C group. The mean proportion of MyoD+ SCs was slightly higher in the P group (1.2% ± 1.9) compared to the C group (0.5% ± 0.8) and the PAS group (0.5% ± 0.6). The proportion of MyoD+ SCs in subjects with MyoD+-stained SCs (9 out of 15) ranged between 0.3 and 4.6%.
Table 2.
The proportions of satellite cells stained by NCAM, Pax7, MyoD, myogenin and Dlk1
| Group | Subject | NCAM, Pax7, laminin and DAPI | Pax7, Dlk1, laminin and DAPI | ||||||
|---|---|---|---|---|---|---|---|---|---|
| Number of SCs | % NCAM+/Pax7+ of total SCs | % NCAM+/Pax7− of total SCs | % NCAM−/Pax7+ of total SCs | % MyoD+ of total SCs | % Myogenin+ of total SCs | Number of Pax7+SCs | % Dlk1+ of total Pax7+SCs | ||
| C | 1 | 44 | 95.5 | 4.5 | 0 | Na | Na | 63 | 90.5 |
| 4 | 73 | 95.9 | 2.7 | 1.4 | 0.89 | 0.76 | 135 | 54.8 | |
| 5 | 92 | 88 | 8.7 | 3.3 | 0 | 0 | 72 | 44.4 | |
| 6 | 97 | 94.8 | 3.1 | 2.1 | 0 | 0 | 172 | 76.0 | |
| 7 | 139 | 95.0 | 4.3 | 0.7 | 0 | 0.36 | 248 | 88.3 | |
| 8 | 88 | 92 | 5.7 | 2.3 | 1.84 | 1.19 | 212 | 76.9 | |
| Mean ± SD | 76 ± 35 | 94.1 ± 3.6 | 4.3 ± 2.5 | 1.6 ± 1.2 | 0.5 ± 0.8 | 0.5 ± 0.5 | 150 ± 75 | 71.8 ± 18.5 | |
| P | 2 | 62 | 87.1 | 1.6 | 11.3 | 0.52 | 0 | 76 | 90.8 |
| 3 | 62 | 98.4 | 1.6 | 0 | 0.46 | 0 | 109 | 72.5 | |
| 4 | 120 | 100 | 0 | 0 | 0 | 0 | 154 | 91.6 | |
| 5 | 83 | 96.4 | 3.6 | 0 | 0.45 | 1.35 | 93 | 89.2 | |
| 9 | 68 | 92.6 | 5.9 | 1.5 | 4.58 | 3.05 | 86 | 80.2 | |
| Mean ± SD | 79 ± 24 | 94.9 ± 5.2 | 2.5 ± 2.3 | 2.6 ± 4.9 | 1.2 ± 1.9 | 0.9 ± 1.4 | 104 ± 31 | 84.9 ± 8.3 | |
| PAS | 1 | 36 | 100 | 0 | 0 | Na | Na | 59 | 25.4 |
| 2 | 79 | 91.2 | 8.9 | 0 | 1.49 | 0.9 | 130 | 36.9 | |
| 3 | 161 | 91.3 | 8.7 | 0 | 0 | 0 | 106 | 76.4 | |
| 5 | 97 | 95.9 | 4.1 | 0 | 0.6 | 0 | 139 | 41.7 | |
| 6 | 29 | 96.3 | 3.5 | 0 | 0 | 0 | 108 | 14.8 | |
| 7 | 116 | 92.2 | 6.9 | 0.9 | 0.31 | 0 | 245 | 74.7 | |
| Mean ± SD | 86 ± 50 | 94.5 ± 3.5 | 5.4 ± 3.5 | 0.2 ± 0.4 | 0.5 ± 0.6 | 0.2 ± 0.4 | 131 ± 62 | 45.0 ± 25.0* | |
The abbreviation (*) means significantly different (p = 0.01) from the P group
Myogenin+ SCs were found in two of five individuals in the P group, in one of five in the PAS group and in three of five in the C group. The mean proportion of myogenin+ SCs was 0.9% ± 1.4 in the P group, 0.5% ± 0.5 in the C group and 0.2% ± 0.4 in the PAS group. The proportion of myogenin+ SCs in subjects with myogenin+ SCs (6 out of 15) ranged between 0.4 and 3.0%. No statistical difference in the mean proportion of MyoD+ SCs or myogenin+ SCs was found between the groups.
MyoD+ and/or myogenin+ nuclei were seen inside the basal lamina of a few dystrophin negative myofibres, containing Pax7+ and NCAM+, and Pax7− and NCAM+ cells and some macrophage nuclei (Figs. 3, 5g–o), as well as in regenerating (NCAM+) myofibres (Figs. 4, 5a–f).
Fig. 3.
Necrotic myofibre under early repair, from trapezius muscle of a PAS subject, shown in serial muscle cross sections. A number of NCAM+ cells are seen inside the myofibre basal lamina. Some of these cells are labelled by antibodies against Pax7, MyoD or myogenin, but none by anti-Dlk1. Sets of arrows in the same position (a–f and g–l, respectively) indicate what we believe to be the same nucleus in two serial sections (a–c is adjacent to d–e and g–i is adjacent to j–l). Note the presence of an intact basal lamina (e–f) around the muscle fibre under repair and lack of plasma membrane visualized by lack of staining for dystrophin (h–i). a–c Note NCAM+ and Pax7+ SC (arrowhead) and in j–l MyoD−/Dlk1+ SC (arrowhead). Bar 50 μm. The cell and images depicted in a–c, stained for NCAM, Pax7, DAPI and laminin have been published previously in Lindstrom and Thornell (2009)
Fig. 5.
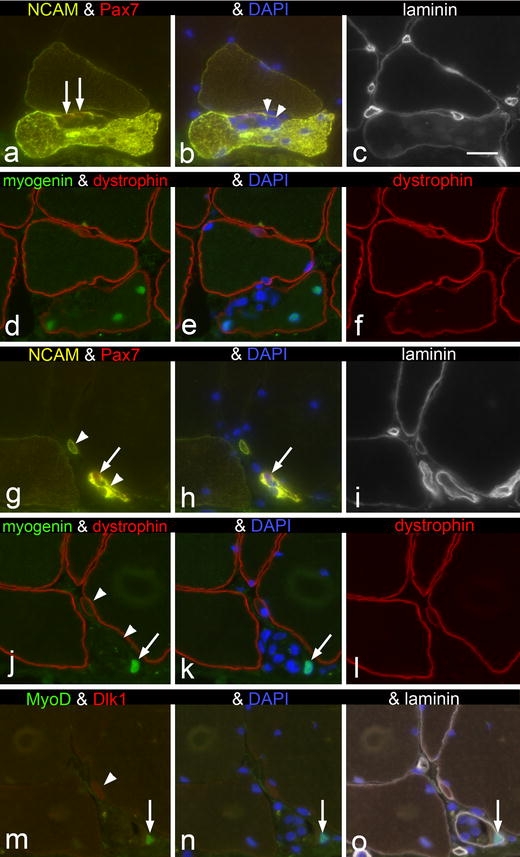
Serial muscle cross sections from trapezius muscle of a PAS subject. Two different areas are shown: (a–f) and (g–o). Note a myofibre partly labelled by anti-NCAM containing central nuclei and having a cluster of nuclei (arrowheads) within its basal lamina. Two NCAM+ and Pax7+ cells (arrows), judged as muscle progenitor cells, are present close to the basal lamina in the cluster of nuclei interpreted to represent macrophages. d–f Three myogenin+ internal myonuclei are seen (d–e) in the part of the myofibre labelled by anti-NCAM in a–b and which also shows distinct staining for dystrophin. The nuclei in the cluster of mononuclear cells are not labelled by anti-myogenin and the area lacks a distinct staining for dystrophin. g–i Two NCAM+ small muscle fibre profiles are indicated with arrowheads. Note the Pax7+ nucleus (arrows) representing the presence of a muscle progenitor cell. j–l The smallest myofibre shows distinct staining for dystrophin, whereas the other lacks staining for dystrophin (arrowheads) and is now seen as a cluster of nuclei, one of which is labelled by anti-myogenin (arrows). m–o The small fibre is weakly stained for Dlk1 (arrowhead), whereas a MyoD+ and Dlk1− nucleus is seen in the larger of the two small muscle fibre profiles (arrow). Bar 20 μm
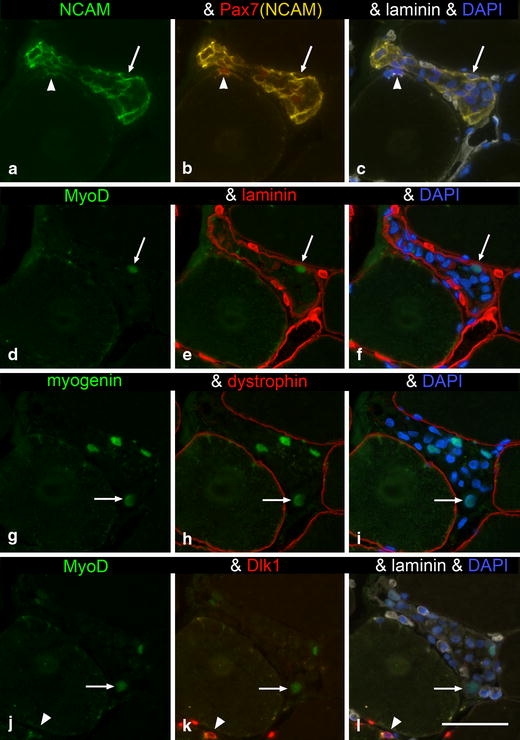
Fig. 4.
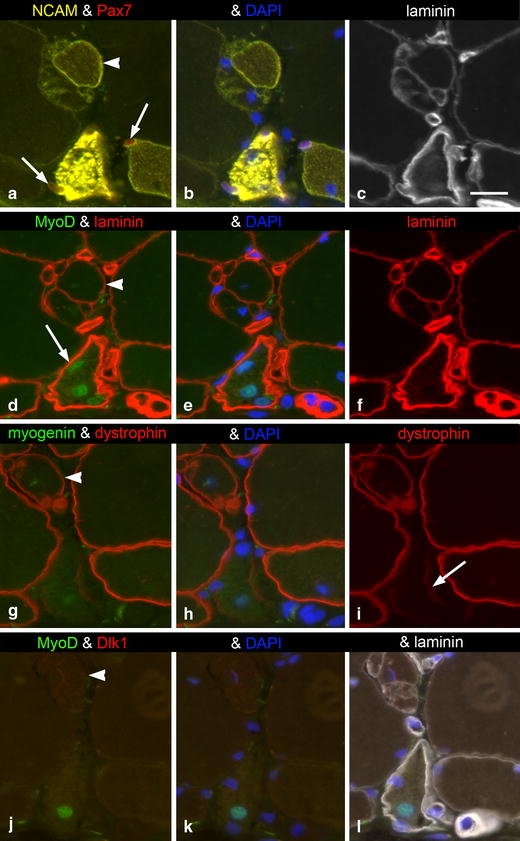
Serial muscle cross sections from trapezius muscle of a PAS subject. a–c Stained for NCAM, Pax7, laminin and DAPI. a Two Pax7+ nuclei judged as SCs are marked (arrows). d–f Stained for MyoD, laminin and DAPI. Note the presence of three MyoD+ nuclei in the myofibre (arrow in d) strongly labelled by anti-NCAM (compare with a). g–i Stained for myogenin, dystrophin and DAPI. The strong NCAM+ myofibre is only partly and weakly labelled by anti-dystrophin (arrow). j–l Stained for MyoD, Dlk1, laminin and DAPI. The strong NCAM+ myofibre has a MyoD+ nucleus and is not labelled by anti-Dlk1, whereas faint staining for Dlk1 is seen in the abnormal NCAM+ and dystrophin + myofibre formation at the top of the images (arrowheads). The staining for Dlk1 is more distinct close to the nucleus. Capillaries (asterisks). Bar 20 μm
In one PAS subject, weak staining for MyoD and myogenin was observed in the myonuclei of some myofibres with angular shape. On adjacent sections, these myofibres showed increased staining for nestin, but not for other markers related to myofibre regeneration such as NCAM or developmental MyHC isoforms (Fig. 6). Interestingly, the staining for MyoD or myogenin observed in these myonuclei was obviously weaker than the nuclear staining for MyoD or myogenin in SCs and in regenerating fibres (compare Figs. 1–5 with 6).
Fig. 6.
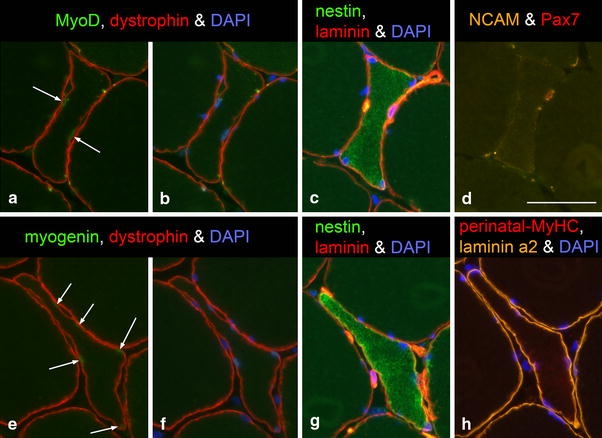
Serial cross sections from trapezius muscle of a PAS subject. Two fibres with angular shape are shown in a–d and e–h, respectively. All myonuclei in the angulated fibres show a weak staining for both MyoD (a, arrows) and myogenin (e, arrows). The sarcoplasm stained for nestin (c and g), but did not stain for NCAM (d) or foetal–perinatal-MyHC (h). Bar 50 μm
Staining for Dlk1
Using the MM method, sections were labelled by either anti-Pax7 or anti-NCAM for SC identification together with staining for Dlk1, laminin and DAPI. The staining for Dlk1 was found on the SC plasma membrane and/or their cytoplasm (Fig. 7a–e) and showed that a subpopulation of SCs were Dlk1+. Both Pax7+ and Dlk1+, and Pax7+ and Dlk1− SCs were observed in the same myofibre and cross section (Fig. 7d–e). We could exclude the presence of Pax7− and Dlk1+ cells inside the basal lamina of myofibres labelled by anti-laminin (Fig. 7f–i). The subpopulation of SCs labelled by anti-Dlk1 did not mirror the positive staining for MyoD or myogenin. For all subjects, a total number of 22 MyoD+ SCs were identified on sections also stained for Dlk1, laminin and DAPI. Of the MyoD+ SCs, 64% were Dlk1+ and 36% were Dlk1−.
Fig. 7.
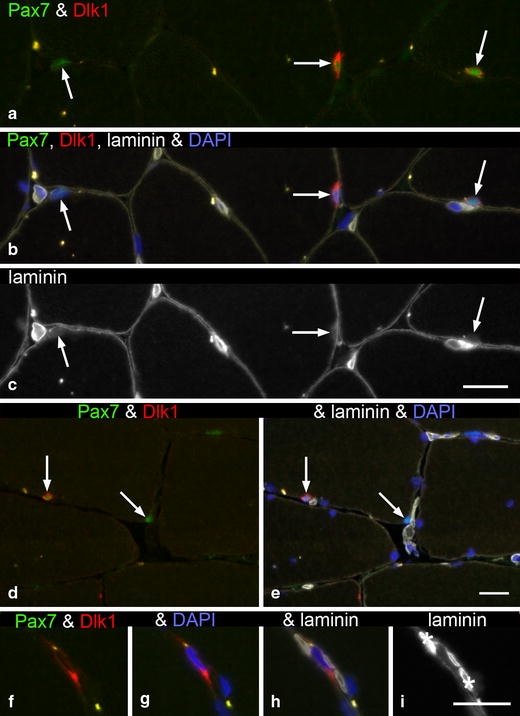
Cross sections from trapezius muscle stained for Pax7, Dlk1, laminin and DAPI. Three SCs (arrows a–c) labelled by anti-Pax7 (a), contain a nucleus (b) and are present beneath the basal lamina (c). One SC is Dlk1−, whereas the other two are Dlk1+ but to different degrees (a–b), (C subject). d Two Pax7+ SCs are seen in the same myofibre (arrows in d–e), only one is labelled by anti-Dlk1 (PAS subject). f–h A Dlk1+ cell is seen in the endomysium between two myofibres. This cell is not labelled by anti-Pax7. Two capillaries are marked (asterisk) (C subject). Bars 20 μm
Muscle progenitor cells Pax7+ and NCAM+, Pax7− and NCAM+, MyoD+ or myogenin+ inside the basal lamina of some dystrophin negative myofibres or regenerating NCAM+ myofibres were not labelled by anti-Dlk1. (Figs. 3j–l, 4j–l and 5m–o). Staining of Dlk1 in mononuclear cells and cell structures within the endomysium, i.e. outside the muscle fibre basal lamina, was observed. These cells were negative for antibodies against Pax7, NCAM or MyoD and were not labelled by anti-laminin (Fig. 7f–i). They were in general few in both power lifters and sedentary subjects. However, in one sedentary subject, more interstitial cells labelled by anti-Dlk1 were seen close to the area of some regenerating myofibres.
In addition, occasional myofibres with small cross-sectional area showed staining for Dlk1 in their cytoplasm. The staining was stronger close to the nucleus in some of these fibres. Such myofibres were also labelled by anti-NCAM and observed in both power lifter and sedentary subjects (Fig. 8). However, as already stated above, the majority of NCAM+ myofibres as well as NCAM+ regenerating fibres were Dlk1−. Notably, some intrafusal fibres were also labelled by anti-Dlk1 (not shown).
Fig. 8.
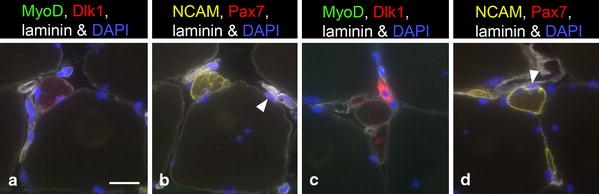
Two serial cross sections from trapezius muscle of a PAS subject. a and c stained for MyoD, Dlk1, laminin and DAPI; b and d stained for NCAM, Pax7, laminin and DAPI. Merged images of all markers are shown to illustrate co-staining for Dlk1 and NCAM in some small-sized myofibres. One small-sized myofibre in a and b and several small-sized myofibres in c and are stained for Dlk1 and NCAM. One fibre in c shows intense staining for Dlk1. Staining for MyoD was not seen in these fibres. SCs are indicated with arrowheads in (b) and (d). Bar 20 μm
Proportion of Dlk1+/Pax7+ SCs
In the C group, 72% ± 19 (range 44.4–90.5%) of the Pax7+ SCs were Dlk1+ (Table 2). The largest proportion of Dlk1+/Pax7+ SCs, 85% ± 8 (range 72.5–91.6%), was found in the P group, whereas the lowest proportion, 45% ± 25 (range 14.8–76.4%), was observed in the PAS group. No statistical difference was observed between the C group and either of the P or PAS groups, whereas the proportion of Dlk1+/Pax7+ SCs was significantly elevated in the P group compared to the PAS group (p = 0.01).
Interestingly, in the PAS group, the proportion of Dlk1+/Pax7+ SCs was ≤42% in four of six individuals. Three of these four power lifters had used combinations of testosterone, anabolic steroids and IGF-1 (PAS1, PAS2, PAS5) and one had used testosterone (PAS6). The other PAS subjects had reported intake of testosterone and anabolic steroids (PAS3, PAS7). To further investigate whether the proportion of Dlk1+/Pax7+ SCs was influenced by the nature of their intake of anabolic drugs (IGF-1), and assuming a similar effect on other muscles, biopsies from the vastus lateralis muscle were also analysed. The mean proportion of Dlk1+/Pax7+ SCs was 70% ± 25 (range 23–92%). A low proportion of Dlk1+/Pax7+ SCs in the vastus lateralis muscle similar to that observed in the trapezius muscle was only observed in one of the four PAS subjects (PAS1) (Table 3).
Table 3.
Comparison of the proportion of Dlk1/Pax7-stained satellite cells in the trapezius and vastus lateralis muscles of power lifters with reported intake of anabolic substances
| Trapezius | Vastus lateralis | ||||
|---|---|---|---|---|---|
| Group | Subject | Number of Pax7+ SCs | % Dlk1+ of total Pax7+ SCs | Number of Pax7+ SCs | % Dlk1+ of total Pax7+ SCs |
| PAS | 1 | 59 | 25.4 | 43 | 23.3 |
| 2 | 130 | 36.9 | 87 | 92.0 | |
| 3 | 106 | 76.4 | 26 | 65.4 | |
| 5 | 139 | 41.7 | 87 | 85.1 | |
| 6 | 108 | 14.8 | 112 | 68.8 | |
| 7 | 245 | 74.7 | 136 | 85.3 | |
| Mean ± SD | 131 ± 62 | 45.0 ± 25.0 | 82 ± 41 | 69.9 ± 25.1 | |
Staining for c-Met
The MM method was used to evaluate the staining for c-Met in SCs identified by anti-Pax7 and for some control subjects also in combination with staining for Dlk1, laminin and DAPI.
Anti-c-Met obviously labelled more cell structures than SCs. On the basis of co-staining for Pax7, we could observe that some SCs were undoubtedly c-Met+, whereas others were clearly c-Met− (Fig. 9). However, without co-staining for an additional SC marker and the basal lamina, it would have been impossible to judge the c-Met+ labelling as a marker for some SCs. Furthermore, we observed rare cases of Pax7+ and c-Met+-stained cells with a basal lamina of their own (Fig. 9). The main problem was that staining for c-Met was also regularly seen at the periphery of the myofibres and accumulated close to myonuclei (Fig. 10). This made quantification of the number of c-Met+/Pax7+ SCs impossible to carry out in a reliable way, as it was not always clear whether the staining for c-Met was related to the Pax7+ SC or to the myofibre plasma membrane. In addition, staining for c-Met was also seen in small blood vessels and in mononuclear cells located between the myofibres. These cells were sometimes increased close to myofibres with signs of injury and repair and were not labelled by anti-Pax7 or anti-laminin (not shown). Some c-Met+ cells present between the myofibres were observed to co-stain for Dlk1, but the majority were Dlk1− (not shown).
Fig. 9.
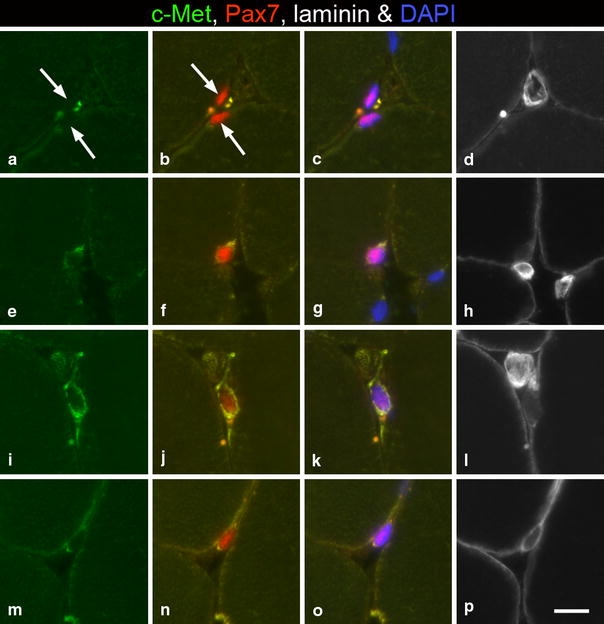
Cross sections from trapezius muscle stained for c-Met, Pax7, laminin and DAPI. a–d Two Pax7+ SCs are not labelled by anti-c-Met (arrows). e–h One Pax7+ SC shows staining for c-Met close to the nucleus. i–l A Pax7+ SC with a large nucleus is clearly labelled by anti-c-Met. m–p A Pax7+ muscle progenitor cell shows weak staining for c-Met and distinct staining for laminin. Bar 10 μm
Fig. 10.
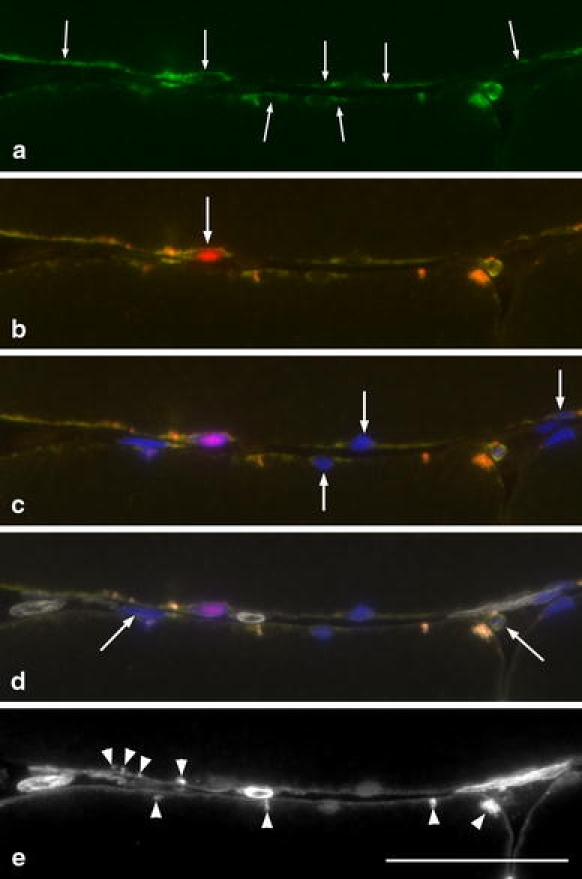
Cross section from trapezius muscle of a PAS subject stained for c-Met (green or yellow), Pax7 (red), laminin (white) and DAPI (blue). a Note the staining for c-Met (green) along the plasma membrane of the myofibres (arrows). b Merged image shows staining for c-Met (yellow) and Pax7 (red), c staining for DAPI is added. d Merged image of all markers and e staining for laminin. Staining for c-Met is sometimes accumulated to a SC identified as a Pax7+ nucleus (arrow in b) or a Pax7− nucleus, i.e. myonuclei or SC (arrows in c) and some c-Met+ cells or cell structures are seen between the myofibres (arrows in d). See also e for clear visualization of the basal lamina and the unspecific auto fluorescence from lipofuscin granules (arrowheads). Note the difficulty to clearly match the staining for c-Met to a Pax7+ SC and the impossibility to identify SCs by their staining for c-Met alone. Bar 50 μm
Discussion
Our multiple label method has made it possible to explore how MyoD, myogenin, Dlk1 and c-Met are related to SCs in situ in human limb muscle.
MyoD and myogenin in human skeletal muscle
This is the first report on human limb skeletal muscle where staining for MyoD and myogenin is unequivocally shown in the nuclei of SCs in vivo. This was accomplished by using the multiple label method comparing the staining patterns for MyoD, myogenin, NCAM, dystrophin and laminin. Thereby, it was possible to distinguish MyoD+ or myogenin+ SCs in situ from myonuclei labelled by these markers. Importantly, we did not observe staining for MyoD and myogenin in myonuclei in normal muscle fibres in any of the sedentary or strength trained subjects. This is in contrast to a previous study where staining for myogenin was seen in myonuclei, but not in SCs after exercise (Kadi et al. 2004). As expected, MyoD+ and myogenin+ nuclei were also present in fibres under repair.
As MyoD is the hallmark for myogenic activation and proliferation, and myogenin is a marker for terminal differentiation of myoblasts (Zammit 2008), the MyoD+ SCs might reflect a time point of increase in the number of SCs, whereas myogenin+ SCs might be on their way to be incorporated in the muscle fibre and reflect a forthcoming increase or turnover of myonuclei. The power lifters we studied who had performed heavy resistance strength training for years, some also using anabolic steroids, had increased their pool of SCs by 50% compared to untrained sedentary controls (Lindstrom and Thornell 2009). Importantly, in these physically active power lifters, we observed that the increased number of SCs was balanced with an increased number of myonuclei acquired during myofibre hyperthrophy (Lindstrom and Thornell 2009). Because the vast majority of SCs were in a MyoD− and myogenin− quiescent state similar to untrained sedentary subjects, we conclude that a steady state level of SC activation, not different from normally active subjects, was reached in these power lifters. Our present results suggest that the myogenin+ SCs, and also to some extent MyoD+ SCs, fall within the subpopulation of SCs, which were NCAM+ and Pax7− (approximately 5% of the SCs (Table 2)) (Lindstrom and Thornell 2009) This conclusion is supported by: (1) cell culture studies showing that Pax7 is down-regulated and not expressed together with myogenin upon myogenic differentiation (Olguin and Olwin 2004; Reimann et al. 2004) and (2) that in multiple labelled sections for NCAM, Pax7, myogenin, laminin and DAPI of Duchenne muscular dystrophy muscle biopsies, many NCAM+ and Pax7− SCs were clearly labelled by anti-myogenin, whereas still some NCAM+ SCs were not labelled by either anti-Pax7 or anti-myogenin (Lindström 2009).
Interestingly in our study, the subsarcolemmal cytoskeleton, as shown by staining for dystrophin, differed at the site of contact between MyoD+ and myogenin+ SCs and the muscle fibre. Undoubtedly, this area is of special importance for the fusion or signalling between the muscle fibre and the SC (Boonen and Post 2008; Cosgrove et al. 2009; Kuang et al. 2008; Lutolf et al. 2009). Whether the thinner staining for dystrophin reflects (1) an adaptation before the fusion of these myoblasts and the muscle fibre or (2) different amounts of protein in general at the SC niche, has to await further studies. On the other hand, staining for dystrophin on both sides of a SC might suggest its separation from the myofibre.
Dlk1
Our study unequivocally shows that anti-Dlk1 marks a considerable proportion of SCs in regular power lifters and sedentary men, although with large inter-individual variations.
The reliability of our identification of the Dlk1+ cells as SCs is evidenced by the co-localization of staining for Pax7 and nuclei inside the myofibre basal lamina and that both Dlk1+ and Dlk1− SCs were present even within the same muscle fibre profile. Both quiescent and activated (MyoD+) SCs were either Dlk1+ or Dlk1−. However, staining for Dlk1 was also observed in the cytoplasm of some small muscle fibres and in mononuclear cells present in the extracellular matrix (ECM) in conformity with previous studies (Andersen et al. 2009; Mackey et al. 2007b).
The highest mean proportion of Dlk1+/Pax7+ SCs and the lowest variability was found in the P group. The PAS group had significantly lower proportion of Dlk1+/Pax7+ SCs compared to the P group. As four of six subjects in the PAS group had distinctly lower values (41.7–14.8%) compared to C (>44%) and P (>72%) subjects, we decided to analyse also the biopsies, obtained at the same time, from the vastus lateralis muscle of the PAS subjects. The purpose was to answer whether the intake of steroids has a general effect on the proportion of Dlk1+/Pax7+ SCs. As no correlation was observed, the prediction was rejected. One possible explanation for the divergent results might be that trapezius and vastus lateralis muscles respond differently to anabolic steroids due to their different numbers of androgen receptors (Eriksson 2006).
The evaluation of Dlk1 expression in adult human skeletal muscle has so far revealed very different results. In normal and resting skeletal muscle, Dlk1 is reported to be practically absent (Andersen et al. 2009; Crameri et al. 2004), or to be expressed by the majority of SCs and by interstitial cells (Mackey et al. 2007b and the present study). In response to one bout of unaccustomed eccentric exercise, the proportion of Dlk1+ mononuclear cells/myonuclei was highly increased (Crameri et al. 2004), whereas the proportion of Dlk1+/NCAM+ SCs remained unchanged in response to a 36-km run (Mackey et al. 2007b). The proportion of Dlk1+/NCAM+ SCs in the endurance trained athletes was significantly lower compared to untrained individuals (48% ± 18 vs. 73% ± 12) (Mackey et al. 2007b), whereas the group of regular power lifters in our study instead indicated a higher proportion of Dlk1+/Pax7+ SCs compared to untrained individuals (85% ± 8 vs. 72% ± 19). This difference may reflect that during normal conditions, long-term strength training and endurance training induce factors with different effects on Dlk1 expression and Dlk1-mediated effect on SC regulation.
In the present study, a few small Dlk1+ myofibres were present. Previously, Dlk1+ fibres were only seen in muscle biopsies of patients with DMD or Becker muscular dystrophy. Dlk1+ myotubes during muscle development and Dlk1+ fibres in dystrophic muscle were suggested to reflect the immaturity of these fibres (Andersen et al. 2009). Remarkably, in our study, other immature fibres (i.e. Figs. 3, 4 and 5g–o) with signs of early repair were Dlk1−. Taken together, these findings urge the need for further investigations of the temporal aspects of Dlk1 expression in muscle regeneration.
In both power lifters and sedentary subjects, interstitial staining for Dlk1 was modest and Dlk1+ mononuclear cells in the ECM were not labelled by antibodies against Pax7, MyoD or NCAM. Collectively, our results using the MM method and other recent studies (Andersen et al. 2009; Mackey et al. 2007b; Uezumi et al. 2010) clearly separate Dlk1+ SCs and Dlk1+ interstitial cells as two distinct cell types. The heterogeneous labelling by anti-Dlk1 on SCs and other cells in the ECM under different conditions indicates that Dlk1 has profound biological significance and should be considered in further studies.
c-Met
c-Met and HGF are generally considered to be part of the cascade of signalling pathways, which lead to activation of skeletal muscle SCs upon stretch or injury (Wozniak and Anderson 2005; Wozniak et al. 2005). Our study showed that antibodies against c-Met mark a small proportion of human SCs, but also the muscle fibre cell membrane and interstitial cells. If we had not been able to verify the true identity of SCs, by using Pax7 as SC marker, it would have been impossible to distinguish with certainty whether some of the SCs actually were labelled by anti-c-Met. Thus, we conclude that c-Met is a more widespread receptor than expected in human muscle, as it was not confined to SCs only, thereby excluding c-Met as a total marker for SCs (De Luna et al. 2004; Pawlikowski et al. 2009). Our results also prove that SCs in human muscle are heterogeneous with respect to staining for c-Met. The staining of myofibres was most prominent in some biopsies of the power lifters and might suggest some influence of exercise on c-Met expression. Further studies are needed to clarify the distribution of c-Met in human muscle and its relation to exercise.
We conclude that the method used to visualize human SCs in vivo matters. Our approach using multiple labels of proteins in the same tissue section showed that human SCs are more heterogeneous than previously recognized.
Acknowledgments
We wish to thank Asst Prof. C H Jensen and Prof. B Teisner, Odense, Denmark for kindly providing the Dlk1 antibody and Prof. H D Schroeder, Odense Denmark for valuable discussions about Dlk1 in human skeletal muscle, Mrs. A-K Olofsson and M Enerstedt for excellent technical assistance, Asst Prof. Leif Nilsson for statistical support and Asst Prof. Anders Eriksson for referring the power lifter subjects to us. This study was supported by grants from AFM (Association Française contre les Myopathies), MYORES Network of Excellence (contract 511978) of the European Union, the Swedish Research Council (12x3934 to L-ET, and 63x20399 to FPD), the Swedish National Centre for Research in Sports (108/08, 99/09) and the Medical Faculty, Umeå University, Sweden.
Open Access
This article is distributed under the terms of the Creative Commons Attribution Noncommercial License which permits any noncommercial use, distribution, and reproduction in any medium, provided the original author(s) and source are credited.
References
- Amthor H, Otto A, Macharia R, McKinnell I, Patel K. Myostatin imposes reversible quiescence on embryonic muscle precursors. Dev Dyn. 2006;235:672–680. doi: 10.1002/dvdy.20680. [DOI] [PubMed] [Google Scholar]
- Andersen DC, Petersson SJ, Jorgensen LH, Bollen P, Jensen PB, Teisner B, Schroeder HD, Jensen CH. Characterization of DLK1+ cells emerging during skeletal muscle remodeling in response to myositis, myopathies, and acute injury. Stem Cells. 2009;27:898–908. doi: 10.1634/stemcells.2008-0826. [DOI] [PubMed] [Google Scholar]
- Antunes-Foschini RM, Ramalho FS, Ramalho LN, Bicas HE. Increased frequency of activated satellite cells in overacting inferior oblique muscles from humans. Invest Ophthalmol Vis Sci. 2006;47:3360–3365. doi: 10.1167/iovs.05-0798. [DOI] [PubMed] [Google Scholar]
- Beauchamp JR, Heslop L, Yu DS, Tajbakhsh S, Kelly RG, Wernig A, Buckingham ME, Partridge TA, Zammit PS. Expression of CD34 and Myf5 defines the majority of quiescent adult skeletal muscle satellite cells. J Cell Biol. 2000;151:1221–1234. doi: 10.1083/jcb.151.6.1221. [DOI] [PMC free article] [PubMed] [Google Scholar]
- Bischoff R, Franzini-Armstrong C. Satellite and stem cells in muscle regeneration. In: Engle A, Franzini-Armstrong C, editors. Myology, vol 1. New York: McGraw-Hill; 2004. pp. 66–86. [Google Scholar]
- Boonen KJ, Post MJ. The muscle stem cell niche: regulation of satellite cells during regeneration. Tissue Eng Part B Rev. 2008;14:419–431. doi: 10.1089/ten.teb.2008.0045. [DOI] [PubMed] [Google Scholar]
- Charifi N, Kadi F, Feasson L, Denis C. Effects of endurance training on satellite cell frequency in skeletal muscle of old men. Muscle Nerve. 2003;28:87–92. doi: 10.1002/mus.10394. [DOI] [PubMed] [Google Scholar]
- Cornelison DD, Wold BJ. Single-cell analysis of regulatory gene expression in quiescent and activated mouse skeletal muscle satellite cells. Dev Biol. 1997;191:270–283. doi: 10.1006/dbio.1997.8721. [DOI] [PubMed] [Google Scholar]
- Cosgrove BD, Sacco A, Gilbert PM, Blau HM. A home away from home: challenges and opportunities in engineering in vitro muscle satellite cell niches. Differentiation. 2009;78:185–194. doi: 10.1016/j.diff.2009.08.004. [DOI] [PMC free article] [PubMed] [Google Scholar]
- Crameri RM, Langberg H, Magnusson P, Jensen CH, Schroder HD, Olesen JL, Suetta C, Teisner B, Kjaer M. Changes in satellite cells in human skeletal muscle after a single bout of high intensity exercise. J Physiol. 2004;558:333–340. doi: 10.1113/jphysiol.2004.061846. [DOI] [PMC free article] [PubMed] [Google Scholar]
- Crameri RM, Aagaard P, Qvortrup K, Langberg H, Olesen J, Kjaer M. Myofibre damage in human skeletal muscle: effects of electrical stimulation vs voluntary contraction. J Physiol. 2007;583:363–380. doi: 10.1113/jphysiol.2007.128827. [DOI] [PMC free article] [PubMed] [Google Scholar]
- D’Souza B, Miyamoto A, Weinmaster G. The many facets of Notch ligands. Oncogene. 2008;27:5148–5167. doi: 10.1038/onc.2008.229. [DOI] [PMC free article] [PubMed] [Google Scholar]
- De Luna N, Gallardo E, Illa I. In vivo and in vitro dysferlin expression in human muscle satellite cells. J Neuropathol Exp Neurol. 2004;63:1104–1113. doi: 10.1093/jnen/63.10.1104. [DOI] [PubMed] [Google Scholar]
- Degens H. Age-related skeletal muscle dysfunction: causes and mechanisms. J Musculoskelet Neuronal Interact. 2007;7:246–252. [PubMed] [Google Scholar]
- Dreyer HC, Blanco CE, Sattler FR, Schroeder ET, Wiswell RA. Satellite cell numbers in young and older men 24 hours after eccentric exercise. Muscle Nerve. 2006;33:242–253. doi: 10.1002/mus.20461. [DOI] [PubMed] [Google Scholar]
- Eriksson A (2006) Strength training and anabolic steroids: a comparative study of the trapezius, a shoulder muscle and the vastus lateralis, a thigh muscle, of strength trained athletes. Umeå University medical dissertations, New series no. 1032 ISSN 0346-6612 ISBN 91-7264-101-0:1-51
- Eriksson A, Kadi F, Malm C, Thornell LE. Skeletal muscle morphology in power-lifters with and without anabolic steroids. Histochem Cell Biol. 2005;124:167–175. doi: 10.1007/s00418-005-0029-5. [DOI] [PubMed] [Google Scholar]
- Gnocchi VF, White RB, Ono Y, Ellis JA, Zammit PS. Further characterisation of the molecular signature of quiescent and activated mouse muscle satellite cells. PLoS ONE. 2009;4:e5205. doi: 10.1371/journal.pone.0005205. [DOI] [PMC free article] [PubMed] [Google Scholar]
- Hawke TJ, Garry DJ. Myogenic satellite cells: physiology to molecular biology. J Appl Physiol. 2001;91:534–551. doi: 10.1152/jappl.2001.91.2.534. [DOI] [PubMed] [Google Scholar]
- Holterman CE, Le Grand F, Kuang S, Seale P, Rudnicki MA. Megf10 regulates the progression of the satellite cell myogenic program. J Cell Biol. 2007;179:911–922. doi: 10.1083/jcb.200709083. [DOI] [PMC free article] [PubMed] [Google Scholar]
- Illa I, Leon-Monzon M, Dalakas MC. Regenerating and denervated human muscle fibers and satellite cells express neural cell adhesion molecule recognized by monoclonal antibodies to natural killer cells. Ann Neurol. 1992;31:46–52. doi: 10.1002/ana.410310109. [DOI] [PubMed] [Google Scholar]
- Kadi F. Adaptation of human skeletal muscle to training and anabolic steroids. Acta Physiol Scand Suppl. 2000;646:1–52. [PubMed] [Google Scholar]
- Kadi F, Eriksson A, Holmner S, Butler-Browne GS, Thornell LE. Cellular adaptation of the trapezius muscle in strength-trained athletes. Histochem Cell Biol. 1999;111:189–195. doi: 10.1007/s004180050348. [DOI] [PubMed] [Google Scholar]
- Kadi F, Eriksson A, Holmner S, Thornell LE. Effects of anabolic steroids on the muscle cells of strength-trained athletes. Med Sci Sports Exerc. 1999;31:1528–1534. doi: 10.1097/00005768-199911000-00006. [DOI] [PubMed] [Google Scholar]
- Kadi F, Johansson F, Johansson R, Sjostrom M, Henriksson J. Effects of one bout of endurance exercise on the expression of myogenin in human quadriceps muscle. Histochem Cell Biol. 2004;121:329–334. doi: 10.1007/s00418-004-0630-z. [DOI] [PubMed] [Google Scholar]
- Kadi F, Charifi N, Denis C, Lexell J, Andersen JL, Schjerling P, Olsen S, Kjaer M. The behaviour of satellite cells in response to exercise: what have we learned from human studies? Pflugers Arch. 2005;451:319–327. doi: 10.1007/s00424-005-1406-6. [DOI] [PubMed] [Google Scholar]
- Kuang S, Kuroda K, Le Grand F, Rudnicki MA. Asymmetric self-renewal and commitment of satellite stem cells in muscle. Cell. 2007;129:999–1010. doi: 10.1016/j.cell.2007.03.044. [DOI] [PMC free article] [PubMed] [Google Scholar]
- Kuang S, Gillespie MA, Rudnicki MA. Niche regulation of muscle satellite cell self-renewal and differentiation. Cell Stem Cell. 2008;2:22–31. doi: 10.1016/j.stem.2007.12.012. [DOI] [PubMed] [Google Scholar]
- Lee YL, Helman L, Hoffman T, Laborda J. dlk, pG2 and Pref-1 mRNAs encode similar proteins belonging to the EGF-like superfamily. Identification of polymorphic variants of this RNA. Biochim Biophys Acta. 1995;1261:223–232. doi: 10.1016/0167-4781(95)00007-4. [DOI] [PubMed] [Google Scholar]
- Lindström M (2009) Satellite cells in human skeletal muscle: molecular identification, quantification and function. Umeå University medical dissertations New Series no. 1313 ISSN 0346-6612 ISBN 978-91-7264-900-2
- Lindstrom M, Thornell LE. New multiple labelling method for improved satellite cell identification in human muscle: application to a cohort of power-lifters and sedentary men. Histochem Cell Biol. 2009;132:141–157. doi: 10.1007/s00418-009-0606-0. [DOI] [PubMed] [Google Scholar]
- Lutolf MP, Gilbert PM, Blau HM. Designing materials to direct stem-cell fate. Nature. 2009;462:433–441. doi: 10.1038/nature08602. [DOI] [PMC free article] [PubMed] [Google Scholar]
- Mackey AL, Esmarck B, Kadi F, Koskinen SO, Kongsgaard M, Sylvestersen A, Hansen JJ, Larsen G, Kjaer M. Enhanced satellite cell proliferation with resistance training in elderly men and women. Scand J Med Sci Sports. 2007;17:34–42. doi: 10.1111/j.1600-0838.2007.00738.x. [DOI] [PubMed] [Google Scholar]
- Mackey AL, Kjaer M, Dandanell S, Mikkelsen KH, Holm L, Dossing S, Kadi F, Koskinen SO, Jensen CH, Schroder HD, Langberg H. The influence of anti-inflammatory medication on exercise-induced myogenic precursor cell responses in humans. J Appl Physiol. 2007;103:425–431. doi: 10.1152/japplphysiol.00157.2007. [DOI] [PubMed] [Google Scholar]
- Nagata Y, Partridge TA, Matsuda R, Zammit PS. Entry of muscle satellite cells into the cell cycle requires sphingolipid signaling. J Cell Biol. 2006;174:245–253. doi: 10.1083/jcb.200605028. [DOI] [PMC free article] [PubMed] [Google Scholar]
- Olguin HC, Olwin BB. Pax-7 up-regulation inhibits myogenesis and cell cycle progression in satellite cells: a potential mechanism for self-renewal. Dev Biol. 2004;275:375–388. doi: 10.1016/j.ydbio.2004.08.015. [DOI] [PMC free article] [PubMed] [Google Scholar]
- Olsen S, Aagaard P, Kadi F, Tufekovic G, Verney J, Olesen JL, Suetta C, Kjaer M. Creatine supplementation augments the increase in satellite cell and myonuclei number in human skeletal muscle induced by strength training. J Physiol. 2006;573:525–534. doi: 10.1113/jphysiol.2006.107359. [DOI] [PMC free article] [PubMed] [Google Scholar]
- Ozeki N, Lim M, Yao CC, Tolar M, Kramer RH. Alpha7 integrin expressing human fetal myogenic progenitors have stem cell-like properties and are capable of osteogenic differentiation. Exp Cell Res. 2006;312:4162–4180. doi: 10.1016/j.yexcr.2006.09.017. [DOI] [PMC free article] [PubMed] [Google Scholar]
- Pawlikowski B, Lee L, Zuo J, Kramer RH. Analysis of human muscle stem cells reveals a differentiation-resistant progenitor cell population expressing Pax7 capable of self-renewal. Dev Dyn. 2009;238:138–149. doi: 10.1002/dvdy.21833. [DOI] [PMC free article] [PubMed] [Google Scholar]
- Petrella JK, Kim JS, Cross JM, Kosek DJ, Bamman MM. Efficacy of myonuclear addition may explain differential myofiber growth among resistance-trained young and older men and women. Am J Physiol Endocrinol Metab. 2006;291:E937–E946. doi: 10.1152/ajpendo.00190.2006. [DOI] [PubMed] [Google Scholar]
- Rantanen J, Hurme T, Lukka R, Heino J, Kalimo H. Satellite cell proliferation and the expression of myogenin and desmin in regenerating skeletal muscle: evidence for two different populations of satellite cells. Lab Invest. 1995;72:341–347. [PubMed] [Google Scholar]
- Reimann J, Brimah K, Schroder R, Wernig A, Beauchamp JR, Partridge TA. Pax7 distribution in human skeletal muscle biopsies and myogenic tissue cultures. Cell Tissue Res. 2004;315:233–242. doi: 10.1007/s00441-003-0833-y. [DOI] [PubMed] [Google Scholar]
- Renault V, Thornell LE, Butler-Browne G, Mouly V. Human skeletal muscle satellite cells: aging, oxidative stress and the mitotic clock. Exp Gerontol. 2002;37:1229–1236. doi: 10.1016/S0531-5565(02)00129-8. [DOI] [PubMed] [Google Scholar]
- Rossi CA, Pozzobon M, Ditadi A, Archacka K, Gastaldello A, Sanna M, Franzin C, Malerba A, Milan G, Cananzi M, Schiaffino S, Campanella M, Vettor R, De Coppi P. Clonal characterization of rat muscle satellite cells: proliferation, metabolism and differentiation define an intrinsic heterogeneity. PLoS One. 2010;5:e8523. doi: 10.1371/journal.pone.0008523. [DOI] [PMC free article] [PubMed] [Google Scholar]
- Sajko S, Kubinova L, Cvetko E, Kreft M, Wernig A, Erzen I. Frequency of M-cadherin-stained satellite cells declines in human muscles during aging. J Histochem Cytochem. 2004;52:179–185. doi: 10.1177/002215540405200205. [DOI] [PubMed] [Google Scholar]
- Seale P, Sabourin LA, Girgis-Gabardo A, Mansouri A, Gruss P, Rudnicki MA. Pax7 is required for the specification of myogenic satellite cells. Cell. 2000;102:777–786. doi: 10.1016/S0092-8674(00)00066-0. [DOI] [PubMed] [Google Scholar]
- Snijders T, Verdijk LB, van Loon LJ. The impact of sarcopenia and exercise training on skeletal muscle satellite cells. Ageing Res Rev. 2009;8:328–338. doi: 10.1016/j.arr.2009.05.003. [DOI] [PubMed] [Google Scholar]
- Tajbakhsh S. Skeletal muscle stem cells in developmental versus regenerative myogenesis. J Intern Med. 2009;266:372–389. doi: 10.1111/j.1365-2796.2009.02158.x. [DOI] [PubMed] [Google Scholar]
- Thornell LE, Lindstrom M, Renault V, Mouly V, Butler-Browne GS. Satellite cells and training in the elderly. Scand J Med Sci Sports. 2003;13:48–55. doi: 10.1034/j.1600-0838.2003.20285.x. [DOI] [PubMed] [Google Scholar]
- Uezumi A, Fukada S, Yamamoto N, Takeda S, Tsuchida K. Mesenchymal progenitors distinct from satellite cells contribute to ectopic fat cell formation in skeletal muscle. Nat Cell Biol. 2010;12:143–152. doi: 10.1038/ncb2014. [DOI] [PubMed] [Google Scholar]
- Verney J, Kadi F, Charifi N, Feasson L, Saafi MA, Castells J, Piehl-Aulin K, Denis C. Effects of combined lower body endurance and upper body resistance training on the satellite cell pool in elderly subjects. Muscle Nerve. 2008;38:1147–1154. doi: 10.1002/mus.21054. [DOI] [PubMed] [Google Scholar]
- Wang Y, Sul HS. Ectodomain shedding of preadipocyte factor 1 (Pref-1) by tumor necrosis factor alpha converting enzyme (TACE) and inhibition of adipocyte differentiation. Mol Cell Biol. 2006;26:5421–5435. doi: 10.1128/MCB.02437-05. [DOI] [PMC free article] [PubMed] [Google Scholar]
- White JD, Vuocolo T, McDonagh M, Grounds MD, Harper GS, Cockett NE, Tellam R. Analysis of the callipyge phenotype through skeletal muscle development; association of Dlk1 with muscle precursor cells. Differentiation. 2008;76:283–298. doi: 10.1111/j.1432-0436.2007.00208.x. [DOI] [PubMed] [Google Scholar]
- Wozniak AC, Anderson JE. Single-fiber isolation and maintenance of satellite cell quiescence. Biochem Cell Biol. 2005;83:674–676. doi: 10.1139/o05-046. [DOI] [PubMed] [Google Scholar]
- Wozniak AC, Kong J, Bock E, Pilipowicz O, Anderson JE. Signaling satellite-cell activation in skeletal muscle: markers, models, stretch, and potential alternate pathways. Muscle Nerve. 2005;31:283–300. doi: 10.1002/mus.20263. [DOI] [PubMed] [Google Scholar]
- Zammit PS (2008) The Muscle Satellite Cell: The Story of a Cell on the Edge. In: Schiaffino S, Partridge T (eds) Skeletal Muscle Repair and Regeneration. Springer, pp 45–64