Abstract
The bulk mechanical properties of soft materials have been studied widely, but it is unclear to what extent macroscopic behavior is reflected in nanomechanics. Using an atomic force microscopy (AFM) imaging method called force spectroscopy mapping (FSM), it is possible to map the nanoscopic spatial distribution of Young’s modulus, i.e. “stiffness,” and determine if soft or stiff polymer domains exist to correlate nano- and macro-mechanics. Two model hydrogel systems typically used in cell culture and polymerized by a free radical polymerization process, i.e. poly (vinyl pyrrolidone) (PVP) and poly(acrylamide) (PAam) hydrogels, were found to have significantly different nanomechanical behavior despite relatively similar bulk stiffness and roughness. PVP gels contained a large number of soft and stiff nanodomains, and their size was inversely related to crosslinking density and changes in crosslinking efficiency within the hydrogel. In contrast, PAam gels displayed small nanodomains occuring at low frequency, indicating relatively uniform polymerization. Given the responsiveness of cells to changes in gel stiffness, inhomogeneities found in the PVP network indicate that careful nanomechanical characterization of polymer substrates is necessary to appreciate complex cell behavior.
Introduction
Hydrogels are commonly defined as three-dimensional networks of hydrophilic polymers that are able to absorb and retain large amounts of water.1–3 The mechanical behavior of hydrogels lies between viscoelastic polymer solutions and rubbers due to the presence of polymer chain entanglements and/or chemical crosslinks between the polymer chains.4 A variety of classical methods including static elongation/compression tests have been used to characterize the mechanical properties of hydrogels, e.g. the elastic or “Young’s” modulus (E) measured in Pascals (Pa), which is the amount of deformation possible for a given force. However, such techniques only provide macroscopic information, 1 despite the fact that hydrogels can be intrinsically inhomogeneous materials with crosslinks occurring at random active sites along the polymer chains.4–6 One such indication of inhomogeneities is that poly (acrylamide) (PAam) gels have been reported to have minor spatial fluctuations in their refractive index based on light scattering.7 However, it is not clear if refractive index changes are reflected in the formation of actual domains with greater or fewer crosslinks than average and what the spatial distribution of such domains would be.
To determine to what degree, if any, mechanical properties change spatially in gels, we chose to test two hydrogels commonly used in cell culture, poly(vinyl pyrrolidone) (PVP)8–10 and PAam11,12 for the presence of nanoscopic spatial variations as a function of their crosslinkers, di-ethylene glycol bis-allyl carbonate (DEGBAC) and N,N′-methylene-bis-acrylamide, respectively. Since both PVP and PAam gels are commonly used in biological applications, any spatial variation in hydrogel properties could influence cell behavior.12,13 Therefore, determining if crosslinking inhomogeneties exist is critically important in understanding complex cell behaviors.
The force-based imaging mode of Atomic Force Microscopy (AFM) called force spectroscopy mapping (FSM) has been used as a tool to study the spatial variations of mechanics for a variety of substrates.14 Recent advances in piezo-driven scanning stages now enable FSM at resolutions up to 2500 indentations µm−2, which approaches the detection limit of the AFM tip, i.e. 20 nm lateral spacing from tip geometry. The improved resolution has made it possible to measure nanoscopic spatial variations within a material,15 which bulk measurement techniques cannot detect. Despite this, here we show that bulk measurements correlate with average FSM-determined elasticity for both PVP and PAam gels, though FSM also has detected the first nanoscopic elastic inhomogeneties in PVP hydrogels.
Experimental
Preparation of PVP and PAam hydrogels
PVP hydrogels were obtained by solubilizing 10 g of 1-vinyl-2-pyrrolidone, di-ethylene glycol bis-allyl carbonate (DEGBAC) (Greyhound Chromatography; UK) at different concentrations (0.25, 0.5, 1.0, 1.5 and 1.75% w/v) and 2,2-azobis (2-methyl-propionitrile) (Molekula; UK) in a molar ratio 1 : 1 with respect to DEGBAC under nitrogen. Polymerization was carried out for 24h at 50 °C and the obtained hydrogels were immersed in an ethanol–water solution (70/30% v/v) in order to remove any unreacted reagents. Hydrogels were then swelled until equilibrium was reached in a 0.1 M phosphate buffer solution (PBS) (pH 7.4) and then stored at 4 °C before characterization.
Preparation of PAam hydrogels was carried out as described before.16 Briefly, acrylamide (Aam) (3, 4 and 5% wt) and N,N′ methyl-bis-acrylamide (1, 0.06 and 0.3% wt respectively) were mixed in PBS and degassed under vacuum for 15 min. 10 µL of ammonium persulfate (APS) and 1 µL of N,N,N′,N′-tetrame-thylethylenediamine (TEMED) for each 1 mL of solution were added. Polymerization was carried out at room temperature for 5–30 min between aminosilane- and chlorosilane-terminated coverslips, with the hydrogel bonding to the aminosilane coverslip. PAam gel thickness was approximately 70 µm for all experiments as determined by light microscopy. All reagents purchased from Sigma-Aldrich (St. Louis, MO) unless otherwise noted.
Compression test
Cylindrical samples of PVP hydrogels (10 mm diameter, 8 mm height) at equilibrium conditions 24 h post-polymerization were tested in an Electro Force 3200 Test Instrument (Bose, Eden Prairie; MN) equipped with parallel plates. The tests were performed using a displacement ramp at a rate of 0.1 mm s−1 with a load of 225 N. Young’s modulus was calculated as the slope of the linear region in the stress/strain curve. All data is shown as the average of triplicate tests with the standard deviation.
Rheological measurements
The viscoelastic properties of PAam gels were quantified by using a RFS II fluids rheometer (Rheometrics Inc.; Piscataway, NJ). Measurements were conducted using cone and plate geometry with a sample thickness of 200 µm, which was previsouly shown to be optimal.12 Young’s modulus was calculated according to the equation E = (1 + 2ν) G*, where ν = 0.45 is the Poisson’s ratio commonly used for hydrogels17 and G* = (G′ + G″)/2. Note that G′ and G″ are the shear and viscous loss moduli, respectively. All data is shown at the average of triplicate tests with the standard deviation.
AFM, force spectroscopy mapping, and analysis
PAam hydrogels were bonded to coverslips via aminosilane chemistry and cast as 70 µm thick gels, which is sufficiently thick for small indentation analyses.18 Large 1 mm thick PVP hydrogels were immobilized onto a glass slide using water-insoluble adhesive. Triplicate samples were placed on an Asylum MFP-3D-BIO atomic force microscope (Asylum Research; Santa Barbara, CA) 24 h post-polymerization to ensure measurement of equilibrium properties (see swelling behavior of PVP hydrogels in Fig. S1 of the ESI†). To obtain topographic images (Fig. S2 of the ESI†), samples were tested in AC mode in fluid using a SiN cantilever with a spring constant of 90 pN/nm. To determine surface roughness, Igor-pro software (Wavemetrics; Portland, OR) was used for the following calculation, where yi is the height value for each pixel and n is the total pixel count:
| (1) |
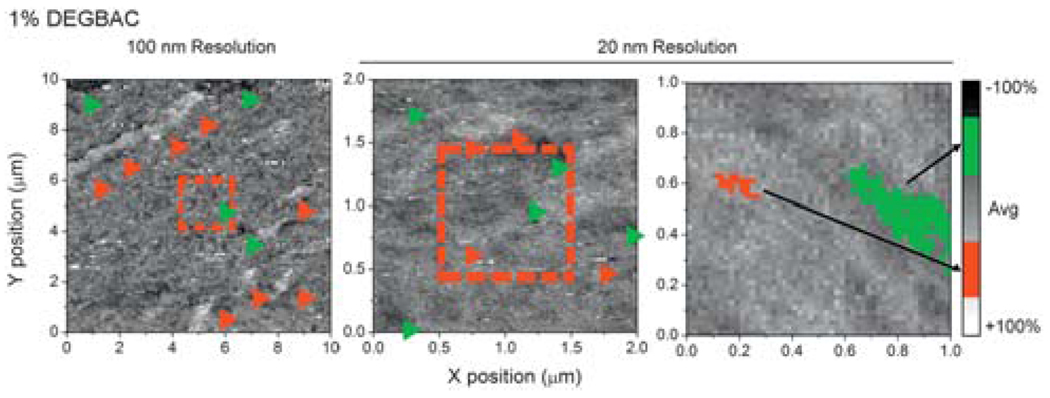
In the identical area after topographical imaging, an array of force-indentation spectrographs with known xy-coordinates was obtained by indenting the material and observing the resulting deflection. Knowing the spring constant and assuming Hookean behavior for the SiN cantilever, data was converted to plots of force vs. indentation depth (Fig. S3†). Fitting the data with the Hertz cone model determines the Young’s modulus of elasticity19,20 for that material, where stiffer materials register higher forces for a given indentation depth. With known xy-coordinates, elasticity values could be assembled onto an FSM image. Resolution was determined by the number of points in the array, e.g. for 100 nm resolution (Fig. 3), a 100 × 100 array over 100 µm2 was performed. For interpoint spacing to reach 20 nm, 2500 points from a 50 × 50 array were analyzed over a scan area of 1 µm2. Since the AFM tip has a radius of 20 nm, scans with a resolution of 20 nm represent a lower resolution limit. At 100 nm indentation spacing, tip indentations up to 250 nm into the hydrogels should produce sufficient deformation so that each indentation measures the properties of the entire 100 × 100 nm area.19,20 The spatial information from each force-indentation curve was then used to create a map of Young’s modulus, where the image colormap was scaled such that ±100% of the average modulus corresponded to maximum and minimum values. Images were thresholded using Image J software to show data 50% above (stiff) and below (soft) the sample’s modulus. A domain was considered any collection of at least 4 adjacent data points with modulii that vary no more than 20%.
Fig. 3.
Force spectroscopy mapping of a 1% DEGBAC/PVP gel where successive scans zoomed in from 100 nm resolution over a 10 × 10 µm scan (left) to 2 × 2 (center) and 1 × 1 µm scans (right) at 20 nm resolution. Red dashed boxes indicate where the previous scan the subsequent scanned area is from. Red and green arrowheads indicate stiff and soft domains, respectively; in the 10 × 10 and 2 × 2 µm scans. For 1 × 1 µm scan, representative soft and stiff nanodomains are indicated. Note that nanodomains present in the 2 × 2 µm scan cannot be easily resolved in the micro-domains in the 10 × 10 µm scan at 5-fold lower resolution (15-fold versus Fig. 2).
AFM data was further analyzed and compared with the initial polymer chemistry of each material to determine crosslinking efficiency. Rubber elasticity theory relates Young’s modulus to the absolute temperature and crosslinking density via:
| (2) |
where E is the Young’s modulus, R is the gas constant, T is absolute temperature, and N is the crosslink chain density in the material (in mol m−3).4,5 When N is divided by the total crosslinker density present in solution pre-polymerization, it is possible to calculate crosslinking efficiency, εXL.21
Results and discussions
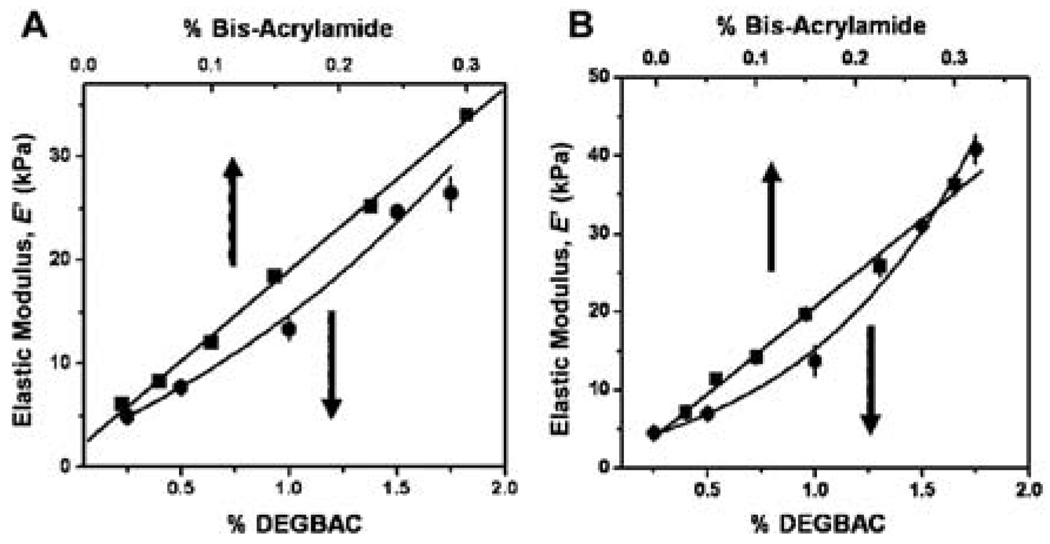
The elastic modulus of PVP and PAam hydrogels at varying crosslinker concentration were first measured by compression or rheological tests, respectively (Fig. 1A). Note that to obtain elastic moduli from rheological measurements as shown in Fig. 1A, data were first converted from shear moduli.17 These conventional measurements that observe bulk properties can easily be compared to force-indentation spectrograms obtained from hundreds of localized AFM indentation experiments, which are fitted using a Hertz model to obtain elastic moduli (Fig. 1B).13,16,20 In particular, elastic moduli for PVP hydrogels measured by AFM range from 4.5 ± 0.5 kPa, corresponding to the lowest crosslinking density (0.25% DEGBAC), to 40.8 ± 1.9 kPa for the highest crosslinking density (1.75% DEGBAC; Fig. 1B) and are comparable to with the results obtained by compression tests (Fig. 1A; correlation coefficient = 0.986). Similar results are shown with PAam hydrogels whose elastic moduli range from approximately 2.8 ± 0.3 kPa to 34.8 ± 1.5 kPa, as determined by AFM (Fig. 1B), which are comparable to rheological values (Fig. 1A) as has been previously noted (correlation coefficient = 0.996).13
Fig. 1.
Elastic modulus of (A) PVP hydrogels by compression test (dots) PAam hydrogels by rheology (squares) and (B) PVP hydrogels (dots) by AFM and PAam hydrogels (squares) by AFM as a function of the crosslinker percentage.
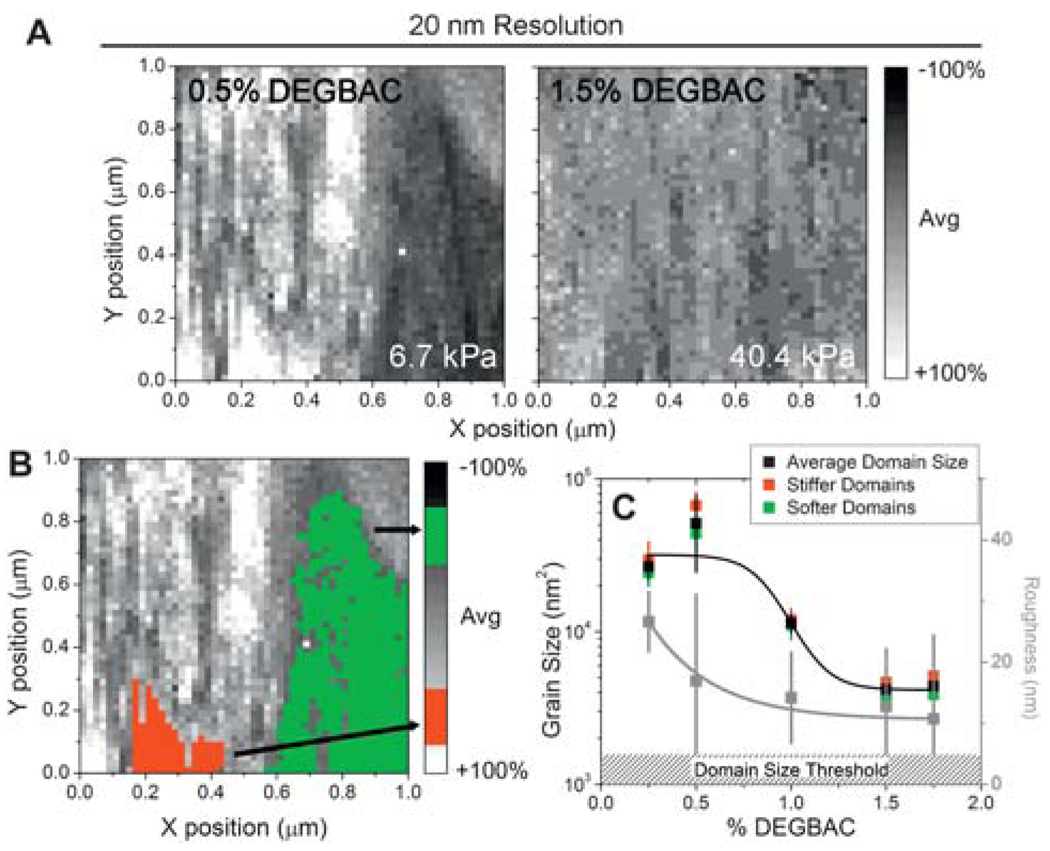
Unlike traditional methods, AFM can indent materials with nanometre precision, and by coupling a piezo-driven XY stage with AFM, hydrogels can be translated in X and Y such that force-indentation spectrograms can be determined at regular intervals. Our current version of FSM can collect data at high spatial resolution not previously possible, i.e. 2500 indentations µm−2 or 20 nm lateral spacing. Given that the AFM tip radius approaches 20 nm, this is the resolution limit.15 Fig. 2 shows the results of the force-indentation scans of PVP hydrogel surfaces at this resolution limit to detect nanoscopic domains. Fig. 2A shows the scans of PVP hydrogels with initial crosslink densities close to the minimum and maximum tested. Note the gray scale scheme (far right) indicates differences in the elastic modulus in relation to the mean value of each image. Despite the fact that the average elastic modulus of the two materials is very similar to their bulk measurements, PVP hydrogels show the presence of soft and stiff domains. Fig. 2B illustrates how soft and stiff domains of different elastic moduli were selected. Though there was no change in the prevalence of nanodomains between any of the PVP hydrogel samples (~4 nanodomains µm−2), there was a 10-fold difference in nanodomain size with a substantial size increase below 1% crosslinker (Fig. 2C). It is important to note that domain size differences did not depend on whether the domain was soft or stiff. However, the presence of nanodomains did not dramatically influence hydrogel surface roughness (eqn (1) and Fig. 2C; gray data), which was not significantly different across hydrogel samples, despite differences in swelling (ESI,† Fig. 2).
Fig. 2.
Force spectroscopy mapping of hydrogel surfaces of PVP at 20 nm lateral resolution. Color map ranges from low (black) to average (gray) to high (white) modulus and is shown as a percentage change from the average. (B) Illustration of the domain size measurement where stiff (red) and soft (green) domains are highlighted. (C) Average nanodomain size of PVP hydrogels as a function of DEGBAC crosslinking is shown in black. Data were divided into stiffer and softer domains and replotted in red and green, respectively. The hatched region indicates the domain size threshold, where a minimum of 4 adjacent points of the same value were required to be called a domain. *p < 0.05.
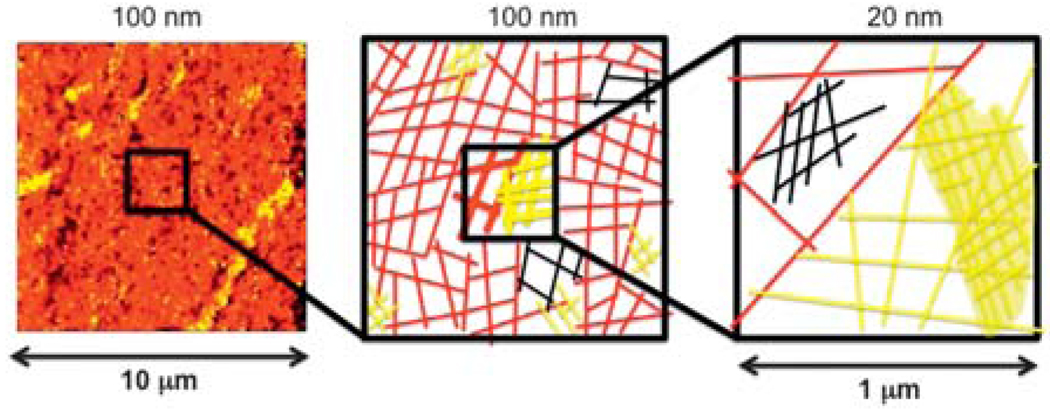
Given that there is a swelling change but lack of topographical change associated with the presence of nanodomains, we attempted to clarify the differences encountered in domain sizes via additional scans at two resolutions of same surface area. Using a 1% crosslinked PVP hydrogel, which is the transition point for domain size and swelling, sequential FSMs of the PVP hydrogel where made (Fig. 3), continuously zooming in from 100 nm resolution over 100 µm2 scan (left) to 20 nm scans over 4 µm2 (center) and 1 µm2 scans (right). While possible to observe at 100 nm resolution, nanodomains were more difficult to detect and did not occur at the same frequency as with higher resolution scans (1–2 domains µm−2). Thus spatial changes in the pre-polymerized solution likely exist below the 100 nm length scale and can possibly be explained by differential chemistry at these length scales: below 1% crosslinker, crosslinker efficiency, εXL, is much more variable than it is above 1% DEGBAC (ESI,† Fig. 4A); a greater difference in efficiency may be the result of poor nanoscopic mixing at lower DEGBAC concentrations that is not present at higher concentrations and hence nanodomain formation (Fig. 4).
Fig. 4.
Schematic of the mechanism of domains in PVP hydrogels. In left a scan of 10 × 10 of 1% DEGBAC/PVP, in center the polymer network, with domains of different density which are represented by color, and left schematic of 1% PVP at a higher resolution where sub-domains are easily resolved.
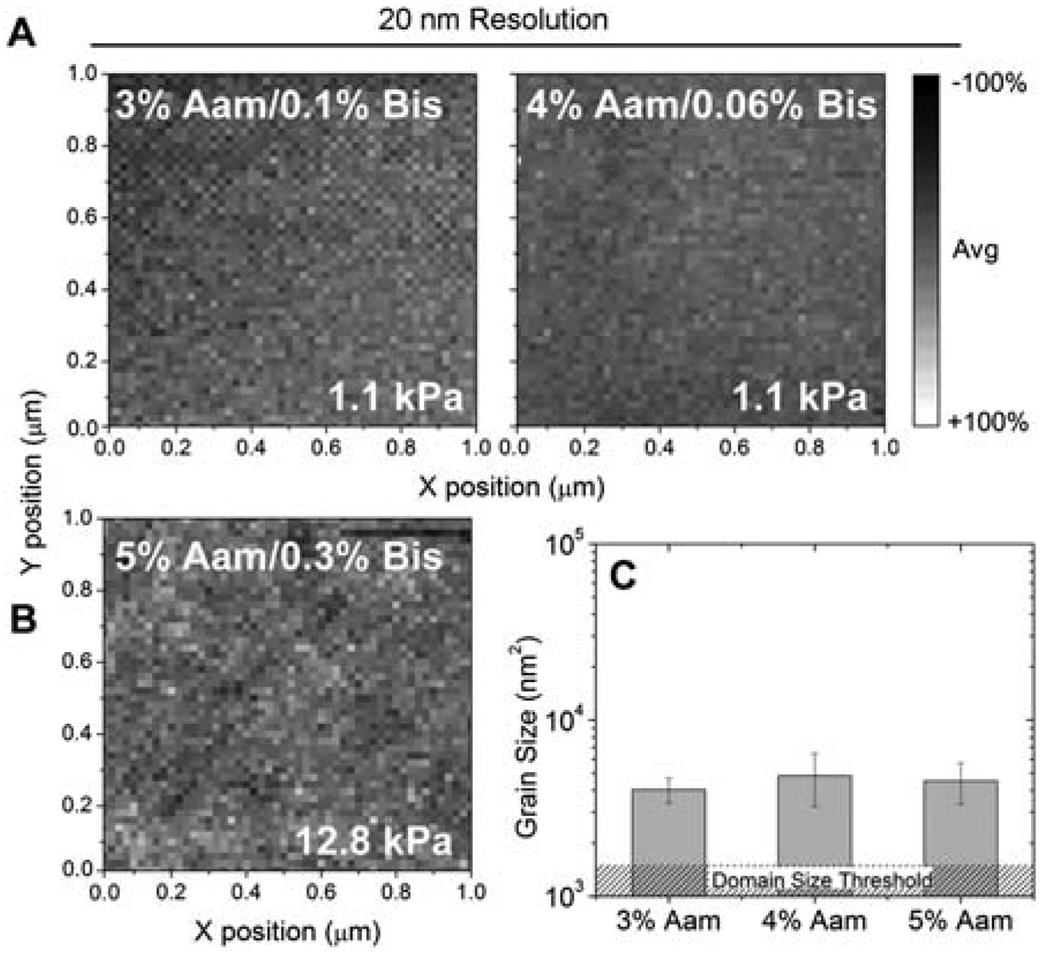
On the other hand, the spatial distribution of modulus in the PAam hydrogel surface was found to be homogeneous compared with low crosslinker PVP hydrogels surfaces. Specifically, PAam hydrogels had a much lower incidence of domain formation (1–2 nanodomains µm−2), and regardless of composition and modulus, domain size was small and did not change (Fig. 5) as with PVP hydrogels (Fig. 2C). No change was also found among the size of the stiff and soft domains in all the PAam hydrogels (not shown). With the absence of nanodomains (Fig. 5C) within the PAam hydrogels, one may argue that differences in crosslinking time and additional mixing of different phases could induce such a difference.22 In fact, PAam polymerization here occurred within 30 min at room temperature while PVP hydrogels required 24 h and 50 °C to solidify. PAam elasticity is known to be temperature-dependent,7,23 suggesting temperature-dependent domain formation could be possible but not observed in PA hydrogels given the polymerization temperature used here. On the other hand, PVP hydrogels could contain nanodomains due to a low initiation rate,24 where nucleating clusters are not evenly distributed due to the energy required. Since this is known to scale with crosslinker concentration, the sharp transition observed around 1% DEGBAC may be explained by an activation energy change within the PVP hydrogel. PAam hydrogels, which have a different activation,25 are not likely to be subject to such a trend as they do not form nanodomains in the first place.
Fig. 5.
Force spectroscopy mapping of hydrogel surfaces of PAam at 20 nm lateral resolution. (A) Indicated Aam/Bis ratios were used to achieve the same average modulus despite different bulk polymer concentrations without the formation of significantly sized nanodomains. (B) Force spectroscopy map of stiffer PAam gel also does not show large nanodomains. (C) Average nanodomain size of PAam hydrogels. The hatched region indicates the domain size threshold, where a minimum of 4 adjacent points of the same value were required to be called a domain.
A more likely explanation for the difference between PVP and PAam systems is in the existence of separate “nucleation and growth steps” or phase separation26 previously observed for hydrogels after the introduction of an interpenetrating polymer. 27 These processes would result in hydrogels that swell differently but which have a relatively smooth surface given the overall domain size. Formation of network chains by free radical polymerization, such as in the case of PVP, has been reported to take place in short periods of time compared to the long relaxation time of network chains, for this reason free radical polymerization reactions result in domain formation and inhomogeneities during the long relaxation times. Such a process is not likely in PAam hydrogels as their crosslinking efficiency, εXL, is known to scale with crosslink density21 and in this study ranged from being as efficient to being 3-fold more efficient than PVP hydrogels (Fig. S4B†). Though the exact mechanism(s) of inhomogeneities in PVP hydrogels is unclear and warrants further study, nanoscale domains pose an interesting system to explore biological questions involving nanoscale changes in stiffness.
Conclusions
Hydrogels are intrinsically heterogeneous, and depending on the crosslinking method, control over regions with higher or lower crosslinking density can be achieved.28–30 However, the presence of these stiffer or softer regions has largely been inferred from indirect measurements, e.g. the diffusion of water, different molecular weight molecules, or light scattering through the hydrogel.6,7 Since the crosslinking density is directly related to hydrogel mechanical properties, the FSM method here permits direct characterization of the crosslinking density distribution in hydrogels, and our results from these direct measurements do not necessarily align with the previous indirect measurements. Nonetheless, the heterogeneous nature of hydrogels has important consequences for the optimization of materials, especially for applications where uniform surface properties are desired, e.g. cell culture.11 FSM could also permit detailed chemical analysis of the surface if the AFM probe is chemically functionalized, e.g. mapping of the interaction between positively charged polymer such as poly(l-lysine) interacting with negatively charged DNA31 or mapping out adhesive sites within a matrix.
The combination of mechanical and chemical characterization make FSM an ideal imaging mode to measure abrupt changes in the nanoscale spatial distribution of elasticity,19 which presently can only be reflected in the variability of bulk mechanical properties, e.g. the error in Fig. 1, or inferred by indirect measurements. Moreover, these techniques are not likely to be sensitive enough to detect such small crosslink changes occurring with limited spatial variation. Whilst the presence of these inhomogeneities can be an obstacle for the design of controlled release devices, if patterned correctly, it can be a great advantage for emerging applications in tissue engineering, where nanopatterned changes in microenvironmental properties, such as stiffness, could be advantageous for the differentiation of stem cells.11
Supplementary Material
Acknowledgements
The authors gratefully acknowledge the financial support provided by CONACyT (to MVF-M), The University of Sheffield Excellence Exchange scheme (to MVF-M), the UK-US Foreign and Commonwealth office Stem Cell Collaboration Development Award (to GCR), the American Heart Association (#0865150F to AJE) and the technical support from Nicholas Geisse (Asylum Research; Santa Barbara, USA).
Footnotes
Electronic supplementary information (ESI) available: Details of the topographic profiles of PVP hydrogels and their swelling behavior. See DOI: 10.1039/c0sm00339e
Contributor Information
Gwendolen C. Reilly, Email: g.reilly@sheffield.ac.uk.
Giuseppe Battaglia, Email: g.battaglia@sheffield.ac.uk.
Adam J. Engler, Email: aengler@ucsd.edu.
References
- 1.Anseth KS, Bowman CN, Brannon-Peppas L. Biomaterials. 1996;17:1647–1657. doi: 10.1016/0142-9612(96)87644-7. [DOI] [PubMed] [Google Scholar]
- 2.Zimberlin JA, Sanabria-DeLong N, Tew GN, Crosby AJ. Soft Matter. 2007;3:763–767. doi: 10.1039/b617050a. [DOI] [PubMed] [Google Scholar]
- 3.Hoffman AS. Adv. Drug Delivery Rev. 2002;54:3–12. doi: 10.1016/s0169-409x(01)00239-3. [DOI] [PubMed] [Google Scholar]
- 4.Landu LD, Liftshiz EM. Theory of Elasticity. Oxford, UK: Butterworth-Heinemann; 1986. [Google Scholar]
- 5.Flory PJ. Principles of Polymer Chemistry. Cornell University Press; 1953. [Google Scholar]
- 6.Zhang X, Xu J, Okawa K, Katsuyama Y, Gong J, Osada Y. J. Phys. Chem. B. 1999;103:2888–2891. [Google Scholar]
- 7.Liu R, Oppermann W. Macromolecules. 2006;39:4159–4167. [Google Scholar]
- 8.Smith LE, Collins S, Zuifang L, MacNeil S, Williams R, Rimmer S. ACS Symp. Ser. 2008;977:196–203. [Google Scholar]
- 9.Vijayasekaran S, Chirila TV, Hong Y, Tahija S, Dalton PD, Constable IJ, McAllister IL. J. Biomater. Sci., Polym. Ed. 1996;7:685–696. doi: 10.1163/156856296x00453. [DOI] [PubMed] [Google Scholar]
- 10.Liu Z, Rimmer S. J. Controlled Release. 2002;81:91–99. doi: 10.1016/s0168-3659(02)00048-2. [DOI] [PubMed] [Google Scholar]
- 11.Engler AJ, Sens S, Sweeney HL, Discher DE. Cell. 2006;126:677–689. doi: 10.1016/j.cell.2006.06.044. [DOI] [PubMed] [Google Scholar]
- 12.Yeung T, Georges PC, Flanagan LA, Marg B, Ortiz M, Funaki M, Zahir N, Ming W, Weaver V, Janmey PA. Cell Motil. Cytoskeleton. 2005;60:24–34. doi: 10.1002/cm.20041. [DOI] [PubMed] [Google Scholar]
- 13.Engler AJ, Bacakova L, Newman C, Hategan A, Griffin M, Discher DE. Biophys. J. 2004;86:617–628. doi: 10.1016/S0006-3495(04)74140-5. [DOI] [PMC free article] [PubMed] [Google Scholar]
- 14.Frisbie CD, Rozsnyai LF, Noy A, Wrighton MS, Lieber CM. Science. 1994;265:2071–2074. doi: 10.1126/science.265.5181.2071. [DOI] [PubMed] [Google Scholar]
- 15.Chirasatitsin S, Engler AJ. J. Phys.: Condens. Matter. 2009:21. doi: 10.1088/0953-8984/22/19/194102. [DOI] [PMC free article] [PubMed] [Google Scholar]
- 16.Engler AJ, Rehfeldt F, Sen S, Discher DE. Methods in Cell Biology: Cell Mechanics. New York: Academic Press; 2007. pp. 521–545. [DOI] [PubMed] [Google Scholar]
- 17.Li Y, Hu ZB, Li C. J. Appl. Polym. Sci. 1993;50:1107–1111. [Google Scholar]
- 18.Engler AJ, Richert L, Wong JY, Picart C, Discher DE. Surf. Sci. 2004;570:142–154. [Google Scholar]
- 19.Radmacher M, Fritz M, Hansma PK. Biophys. J. 1995;69:264–270. doi: 10.1016/S0006-3495(95)79897-6. [DOI] [PMC free article] [PubMed] [Google Scholar]
- 20.Dimitriadis EK, Horkay F, Maresca J, Kachar B, Chadwick RS. Biophys. J. 2002;82:2798–2810. doi: 10.1016/S0006-3495(02)75620-8. [DOI] [PMC free article] [PubMed] [Google Scholar]
- 21.Orakdogen N, Okay O. Polym. Bull. 2006;57:631–641. [Google Scholar]
- 22.Tse JR, Engler AJ. Current Protocol Cell Biology. 2010;10:1–16. doi: 10.1002/0471143030.cb1016s47. [DOI] [PubMed] [Google Scholar]
- 23.Calvet D, Wong JY, Giasson S. Macromolecules. 2004;37:7762–7771. [Google Scholar]
- 24.Matsumoto A. Adv. Polym. Sci. 1995;123:41. [Google Scholar]
- 25.Muniz EC, Geuskens G. J. Membr. Sci. 2000;172:287–293. [Google Scholar]
- 26.Boots HMJ, Kloosterboer JG, Serbutoviez C, Touwslager FJ. Macromolecules. 1996;29:7683–7689. [Google Scholar]
- 27.Kwok AY, Prime EL, Qiao GG, Solomon DH. Polymer. 2003;44:7335–7344. [Google Scholar]
- 28.Tae G, Kornfeld JA, Hubbell JA. Biomaterials. 2005;26:5259–5266. doi: 10.1016/j.biomaterials.2005.01.042. [DOI] [PubMed] [Google Scholar]
- 29.Séréro Y, Aznar R, Porte G, Berret JF, Calvet D, Collet A, Viguier M. Phys. Rev. Lett. 1998;81:5584–5587. [Google Scholar]
- 30.Ryan AJ, Crook CJ, Howse JR, Topham P, Jones RAL, Geoghegan M, Parnell AJ, Ruiz-Pérez L, Martin SJ, Cadby A, Menelle A, Webster JRP, Gleeson AJ, Bras W. Faraday Discuss. 2005;128:55–74. doi: 10.1039/b405700g. [DOI] [PubMed] [Google Scholar]
- 31.Liu G, Molas M, Grossmann GA, Pasumarthy M, Perales JC, Cooper MJ, Hanson RW. J. Biol. Chem. 2001;276:34379–34387. doi: 10.1074/jbc.M105250200. [DOI] [PubMed] [Google Scholar]
Associated Data
This section collects any data citations, data availability statements, or supplementary materials included in this article.


