

Abstract
An accumulation of expressed sequence tag (EST) data in the public domain and the availability of bioinformatic programs have made EST gene expression profiling a common practice. However, the utility and validity of using EST databases (e.g., dbEST) has been criticized, particularly for quantitative assessment of gene expression. Problems with EST sequencing errors, library construction, EST annotation, and multiple paralogs make generation of specific and sensitive qualitative and quantitative expression profiles a concern. In addition, most EST-derived expression data exists in previously assembled databases. The Virtual Northern Blot (VNB) (http://tlab.bu.edu/vnb.html) allows generation, evaluation, and optimization of expression profiles in real time, which is especially important for alternatively spliced, novel, or poorly characterized genes. Representative gene families with variable nucleotide sequence identity, tissue specificity, and levels of expression (bcl-xl, aldoA, and cyp2d9) are used to assess the quality of VNB’s output. The profiles generated by VNB are more sensitive and specific than those constructed with ESTs listed in preindexed databases at UCSC and NCBI. Moreover, quantitative expression profiles produced by VNB are comparable to quantization obtained from Northern blots and qPCR. The VNB pipeline generates real-time gene expression profiles for single-gene queries that are both qualitatively and quantitatively reliable.
Key words: Expressed sequence tag (EST), Transcriptomics, Bioinformatics, Quantitative PCR, Northern blot
INTRODUCTION
Gene expression analysis, pathway profiling, gene regulatory networks, and modeling of biological processes are key for “post-genome project” studies. Various high-throughput methods of expression profiling are commonly employed, such as microarrays, serial analysis of gene expression (SAGE), and quantitative reverse transcription PCR (qPCR); some being more costly and labor intensive than other methods (4). Newer expression profiling technologies include genome-scale in situ hybridization databases (38) (e.g., www.eurexpress.org) and fully sequenced EST libraries using massively parallel DNA sequencing technologies (63). Moreover, there exists a vast array of primary experimental data in the public domain in the form of microarray data, SAGE, and the expressed sequence tags database (dbEST), which can be freely used by investigators for gene expression profiling. Many public microarray databases now provide tools to survey individual gene expression among normal and disease tissues. These include, but are not limited to, Stanford Microarray Database (SMD), Gene Expression Omnibus (GEO), Oncomine, Genesapiens, and Gene Expression Atlas (8,16,32,53,61). A new tool, called the Virtual Northern Blot (VNB), is described herein that maximizes the usefulness of dbEST as a resource in a unique fashion for effective gene expression profiling in real time, something not available in any of these other tools and databases.
ESTs are single-pass sequenced cDNAs representing expressed genes from a specific cell population or tissue (2). They are on average 200–700 nucleotides (nt) derived from partial sequencing of randomly primed or oligo-dT primed cDNA clones from libraries of different tissues. Some libraries have been manipulated (sometimes called normalization) such that rare transcripts might be more highly represented, while other libraries have not been manipulated and thus the proportion of particular cDNA clones should accurately represent the same proportion in the mRNA population in that tissue.
The dbEST is a public domain archival database of cDNA sequence files (10). Since its inception in 1994, dbEST has grown exponentially and this growth is expected to continue. Although a powerful resource for sequence analysis, and especially for identification of novel genes (42), the utility and validity of dbEST for quantitative expression profiling have been criticized. Such criticism stemmed from early high error rates in sequence determination (>3%), poor annotation, partial sequence reads, and large-scale contaminations (3,21,39,52). Despite these issues, numerous EST mining algorithms (31,42) have successfully taken advantage of this tremendous resource (>61 million sequences by May 2009). In addition, methods for systematic validation (60) have shown that some of the early concerns are less problematic as older ESTs have been diluted with higher quality data and better annotation. Expression profiling using dbEST is a common method for exploring the transcriptome (11,51), characterizing novel gene expression (7), and identifying novel pathways in tissues (20). The easy availability of these data has fostered continued improvement and innovation (34,43,69) that underscores the value of this resource.
Gleaning reliable expression information from the archival dbEST database begins with proper identification of ESTs derived from the gene(s) of interest, often by sequence alignment. Common sequence alignment tools (MegaBLAST, BLAT, d2, CAP3, PHRAP) (14,18,28,30,65,70) have been used to cluster ESTs and then assign each cluster to a gene, thus building a gene-indexed database from which expression profiles could be gleaned. This processed data is made available through web-based tools, or pipelines. Two of the most frequently accessed EST analysis pipelines used to display gene-associated EST information are the Genome Browser at UCSC (29), which uses BLAT, and UniGene (41) at NCBI, which uses MegaBLAST. These pipelines are easily accessed and UniGene is among the most commonly used sources for retrieving gene expression data. However, while these tools have enabled the widespread use of EST data, the assembly of these databases is prone to errors from significant sequence error rates, alternative splicing, and lack of genome coverage (11,51). All these issues are especially critical for novel genes and those with very high sequence similarity. In addition, compiling expression profiles from a gene cluster may prove quantitatively inaccurate due to various cDNA construction methods employed (27). Furthermore, such processed data is by its nature not current and pipelines for generating gene expression profiles in real time are not readily available. For those investigators wanting precise, sensitive, and up-to-date gene expression data for a single gene or gene family, there are few tools available for accessing dbEST. In addition, the use of any of these tools for quantitative analysis has not been clearly demonstrated. VNB was specifically designed to address these needs.
VNB is an application that can generate accurate quantitative and qualitative expression patterns for any human or mouse gene, which is available via a web interface (http://tlab.bu.edu/vnb.html). The algorithm is analogous to a classical Northern blot; the program is optimized for single-gene queries for difficult genes (e.g., genes with high sequence identity among paralogs or novel and poorly characterized genes). Validation of VNB, using gene families of varying sequence similarity, function, and expression profiles, demonstrates that this tool is more sensitive and specific than commonly employed algorithms. More importantly, quantitative gene expression information derived using VNB is validated by Northern blots and qPCR.
MATERIALS AND METHODS
Overview of the VNB Algorithm
The VNB algorithm is outlined in the flowchart shown in Figure 1. The algorithm is analogous to performing a Northern blot; first gene-specific “probe” sequences are identified for subsequent in silico “hybridization” against EST libraries of mRNA-derived sequences. The most important part of the algorithm, like in a Northern blot, is selecting the gene-specific probe(s). Using a multiple alignment of the gene of interest to its paralogs (generated by one of two methods, see below), a routine called AutoProbe finds sequence intervals, or probes, that are specific to the gene of interest. These probes can be further verified by ProbeChecker. Using gene-specific probes generated from AutoProbe and ProbeChecker, dbEST is searched using BLAST (5) for ESTs that exactly match at least one of the probes. Each EST is mapped to an EST library by using annotation from Entrez (9). The library identifiers are then used to search library construction information in the Cancer Genome Anatomy Project (CGAP) database (35). The construction information is then used to generate a qualitative and a quantitative expression profile for the query gene. A qualitative profile is generated by counting all ESTs that match the gene-specific probes for each tissue. Another profile, called the quantitative profile, is generated by counting only those ESTs that are annotated as “nonnormalized” by CGAP. Moreover, the quantitative level of expression is calculated as a percentage of the total number of ESTs from “nonnormalized” libraries for each tissue. A depiction of the user interface and a sample output are shown in Figure 2.
Figure 1.
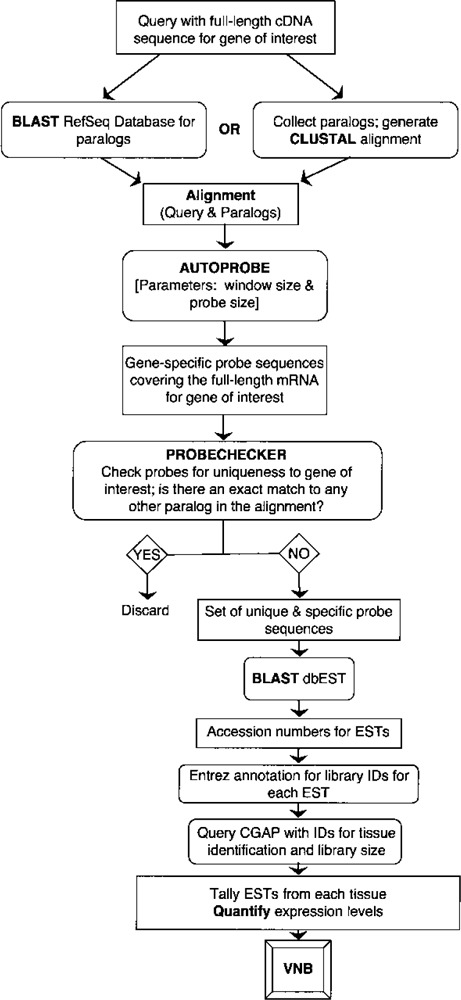
An Overview of VNB algorithm presented as a flow chart. A box represents either input data or a result. An oval represents an action. A diamond represents a decision point. A more informative description of the VNB algorithm is provided in Supplemental Materials.
Figure 2.
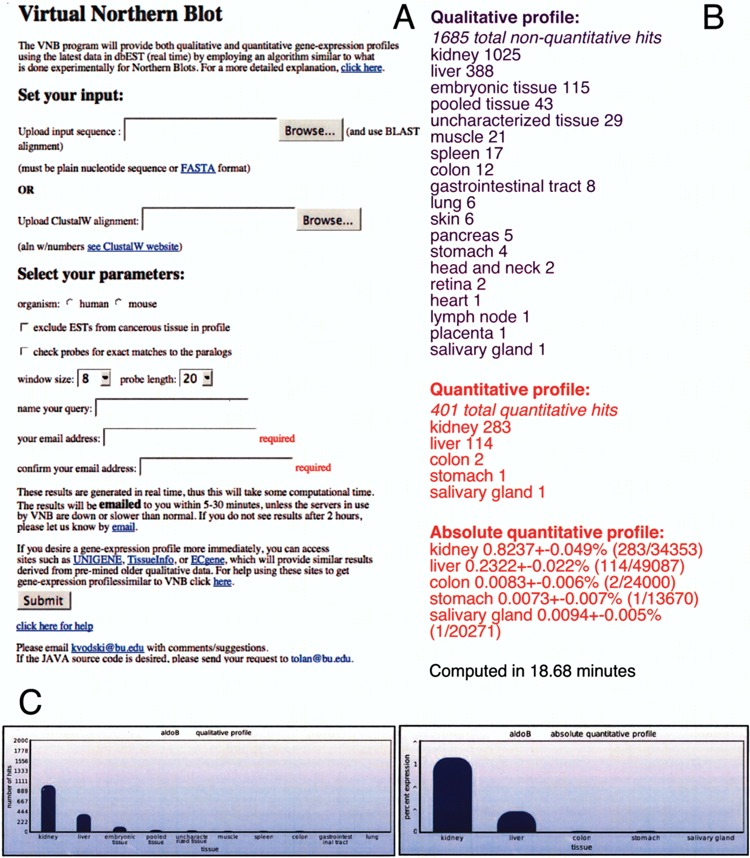
Illustration of the VNB user interface and output file. (A) The user interface for VNB at http://tlab.bu.edu/vnb.html. The “Set your input” section allows for the two different ways of inputting the query. The “Select your parameters” section allows the user to select the organism, normal/cancer tissues, activation of ProbeChecker, window size, and probe length. (B) A typical output for VNB using mouse aldolase B as an example, which is expressed predominantly in the liver and kidney. At the top (in purple), is the tissue expression profile grouped by total ESTs found and at the bottom (in red) is the quantitative tissue expression profile that uses only unmanipulated libraries as defined at CGAP. The numbers in parentheses are the absolute expression values obtained by dividing the number of ESTs found in each tissue by the total number of ESTs from that tissue. The errors are calculated to one standard deviation using a Poisson distribution. (C) A graphical representation of the information derived from (B). The qualitative profile, using all ESTs found, shows the top 10 tissues as a function of the number of ESTs. The absolute quantitative profile, using ESTs from nonnormalized libraries, shows the top tissues as a function of level of expression (fraction of total mRNAs).
The accurate annotation of library information at CGAP is critical to the accuracy of expression profiles generated by VNB. The CGAP site allows for the retrieval of tissue or cell origin, cDNA library construction information, normal or cancerous tissue types, and the number of ESTs in each library (http://cgap.nci.nih.gov/Tissues/LibraryFinder). Currently, CGAP only catalogs ESTs libraries from human and mouse. Both qualitative and quantitative profiles from VNB use the tissues annotated on the CGAP website. A more detailed description of the methodology used by the software can be found in Supplementary Materials (available at http://www.bu.edu/aldolase/lab/software.html).
Multiple Alignment
In order to generate a set of gene-specific probes, AutoProbe needs an alignment of the input gene to all of its paralogs. The user has the option of automatically generating an alignment by using BLAST to query the RefSeq database (http://www.ncbi.nlm.nih.gov/RefSeq/) (48) with the gene of interest, or directly uploading a custom alignment generated with ClustalW (http://www.ebi.ac.uk/clustalw/) (62). This second option allows the user to define the set of paralogs or alternatively spliced transcripts. This “custom” ClustalW alignment is useful for profiling novel or poorly characterized genes, which do not have some (or any) of their paralogs in the RefSeq database.
AutoProbe and ProbeChecker
Autoprobe uses the multiple alignment of the input gene to its paralogs, generated by either of the two methods described above, to find gene-specific sequence intervals. AutoProbe generates multiple small and overlapping ‘probes” that span the length of the mRNA. The overlapping probes help circumvent issues with sequencing errors, regions of high similarity in paralogs and/or alternative splicing. By overlapping, while one probe may not “hybridize” 100% to one EST, another probe would hybridize by sliding past the error, include or exclude an alternative spliced region, and/or include a sequence more specific to the gene of interest and not a closely matched paralog. AutoProbe breaks the input sequence up into short regions, called windows, and selects the most gene-specific probe from each window, using a dissimilarity matrix compiled from the multiple sequence alignment. Such a matrix and the calculation are exemplified in Figure 3. The two parameters of probe length and window size can be adjusted by the user to improve the profile for specificity and/or sensitivity. Finally, a routine called ProbeChecker ensures specificity of the profiles by discarding probes that exactly match sequences to any of the paralogs in the alignment.
Figure 3.
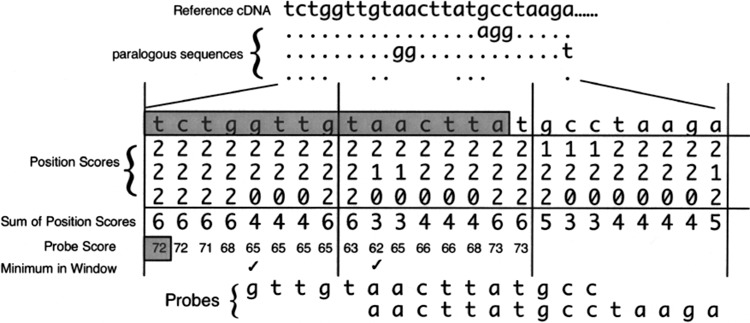
Illustration of the scoring matrix for AutoProbe. At the top is an example of a BLAST alignment where the matches to the top query sequence (reference cDNA) are denoted by dots, base changes noted by letters, and gaps noted as spaces for three paralogous sequences given below the reference cDNA. The alignment is converted into a matrix of position scores that assigns values for the number of matches, mismatches, and gaps in the multiple alignment. The cDNA sequence from a gene of interest is compared to its paralogs systematically, by dividing the gene into multiple segments called “windows.” Every possible probe within each window along the cDNA (5′ to 3′) is assessed for specificity by calculating a probe score that reflected its uniqueness relative to the paralogs. Below the alignment is the scoring system for AutoProbe with the sum of the scores at each position (“Sum of Position Scores”). The “Probe Score” is the total of all “Sum of Position Scores” for a probe that starts at that position and continues to the right for a definable probe size (15 bases shown here in shaded rectangle for the query sequence located above the matrix). The first “Probe Score” is depicted in the shaded box. The “Probe Score” changes as the probe window (shaded sequence) slides to the right. The lowest probe score within each window determines which probe is selected. For probes with the same low score, the first probe is chosen to represent that window. The minimum “Probe Score” in a definable window (eight bases here) is denoted by the check mark. The most gene-specific probes have the lowest scores. The selected probes for the first two windows are shown at the bottom, both of which correspond to the regions with the highest specificity to the reference cDNA sequence.
BackBLAST
A program called BackBLAST was used to determine whether a set of ESTs was truly derived from the gene of interest. This program queries each EST against the RefSeq database. As outlined in Figure 4, the ESTs whose best match in RefSeq is the input gene are considered true positives, while the others are considered false positives. However, because BackBLAST must query each EST against the Ref-Seq database, its runtime is prohibitively large. Thus, it was only used for validation purposes and is not part of the implementation available online.
Figure 4.
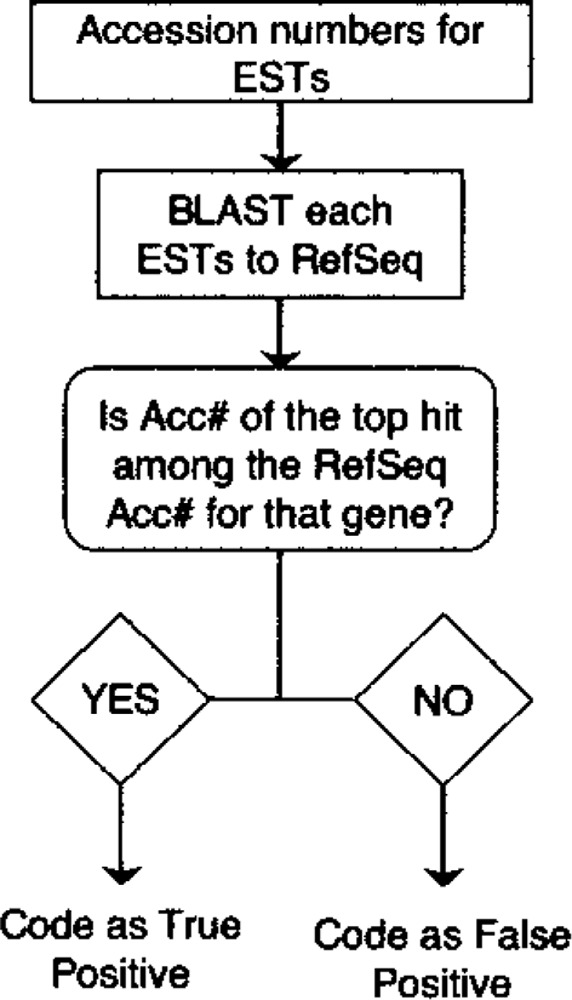
Flow chart for BackBLAST routine. Flowchart and decision matrix for BackBLAST algorithm is depicted. BackBLAST was used to confirm that ESTs were derived from the gene of interest (TPs). Formats are as described in Figure 1. BackBLAST program can sort through all the EST hits and determine if they represent the query or are false positives. It requires the list of EST accession numbers along with knowledge of which accession numbers in RefSeq correspond to the gene of interest.
Runtime and Resources Used
The bulk of VNB’s runtime is spent on querying dbEST with the set of gene-specific probes. When the number and length of the probes increase (by using a longer input sequence, smaller window size, or greater probe length), the runtime, which is typically 3-30 min, increases considerably. VNB is completely automated and it interfaces with all of the tools/resources that it uses online (there is nothing installed locally) (see Supplementary Materials at http://www.bu.edu/aldolase/lab/software.html). As a consequence, VNB uses the latest versions of BLAST, RefSeq, and dbEST available at NCBI, as well as the latest Entrez, CGAP annotation, and version of ClustalW (36).
Northern Blots
Blots of total RNA from 14 mouse tissues (brain, heart, lung, liver, spleen, kidney, stomach, small intestine, skeletal muscle, skin, thymus, testis, uterus, placenta) were purchased from Seegene, Inc. (#1006-1-1302). Probes for the aldolase A gene (aldoA) (387 bp from 3′-untranslated region) and the glyceraldehyde-3-phosphate dehydrogenase gene (gapdh) (357 bp from 3′-untranslated region) were generated from PCR amplification of cDNA clones pFL (40) and EST (IMAGE ID 3513620), respectively. Forward (aldA_1221) and reverse primers (aldA_1587) for aldoA were as follows: 5′-CTTGACTTTCTCCTAT GGTCG-3′ and 5′-CCCTTAAATAGTTGTTTATTG-3′, respectively. Forward and reverse primers for gapdh were 5′-CTACACTGAGGACATGGTTGTC TCATGTGACTT-3′ and 5′-CAGCGAACTTTATTG ATGGTATTCAAGAGAGT-3′, respectively. Radio-labeling was done using a modified version of the procedure of Feinberg and Vogelstein (19). Briefly, a solution of 100–150 ng of probe DNA was denatured by boiling for 5 min. Reagents were added and the solution was incubated at 37°C for 2 h. The final concentrations in 20 μl were 125 mM HEPES, pH 6.6, 125 mM Tris-HCl, pH 8, 20 mM β-mercaptoethanol, 12.5 mM MgCl2, 50 mM each of dCTP, dGTP, and dTTP, 40 μg/ml BSA, 13.5 A/ml random octomers, 1 unit DNA polymerase I (Klenow fragment), and 60 μCi of [α-32P]dATP (1 mM) (3000 mCi/mmol). The reaction was stopped by fivefold dilution in 10 mM Tris-HCl, pH 8, 1 mM EDTA and the labeled DNA was purified from unincorporated dATP by gel filtration with BioGel P-6 DG (58). Specific radioactivity ranged from 107 to 109 cpm/μg. Prehybridization and hybridization reactions were at 42°C in 5× SSC, 10× Denhardts, 20 mM phosphate, pH 7, 7% SDS for 1 and 16 h, respectively. Washing of the blot was performed at 65°C in 0.5× SSC, 0.5% SDS. A phosphor-imager was used for quantitative tabulation of the hybridization results. The mRNA from aldoA and gapdh coelectrophoresed in these blots and the same blots were used for each probe after washing and checking that signals were at background before rehybridization.
Quantitative RT-PCR (qPCR)
Total RNA from eight mouse tissues (liver, spleen, skeletal muscle, kidney, brain, testis, lung, and salivary gland) was purchased from BD Biosciences-Clontech (Mouse—Multiple Tissue Total RNA Panel, #636644). Fragments from mRNA encoding aldolase A or GAPDH were amplified from these tissues following cDNA synthesis by reverse transcriptase (Superscript II) using oligo-dT priming of RNA (0.14 μg/μl) as described by the manufacturer (Invitrogen). PCR, using the same primers used for Northern blot probes described above, was used to confirm cDNA synthesis and the specificity of the PCR reactions. Real-time PCR was performed in 384-well plates using an ABI 7300 instrument and PCR cocktail containing SYBR green from ABI according to the manufacturer’s procedures. Amplification of four 10-fold serial dilutions of the cDNA reactions was recorded by fluorescence changes during the denaturation cycles of PCR (15 s at 95°C, 30 s at 55°C, 70 s at 72°C for 40 cycles). The cycle threshold was recorded and plotted as a function of the dilution to generate a straight line with a slope that was related to the doubling efficiency (10−1/slope). The efficiency raised to the value of the intercept of the line at no dilution is a measure of the relative amount of cDNA for each gene in the tissue samples.
Analysis of Published Experimental Data
The experimentally determined expression levels were taken directly from quoted values in the cited reports or measured from relative intensities measured on a densitometer from zymograms or Northern blots displayed in the figures.
RESULTS
Testing VNB
Choosing a Representative Set of Genes
For testing the effectiveness of VNB, queries were used that belonged to three conserved superfamilies. The first, aldolase A, which belongs to a superfamily of aldolases (15), has two closely related isozyme genes. The closest isozyme, aldolase C, shares 85% overall sequence identity with the aldoA cDNA (55). Second, the cyp family is represented by cyp2d-9 (steroid 16-α-hydroxylase gene), which shares many regions of very high sequence identity with its paralogs (57). The closest gene family member (cyp2d-13) is 93% identical in cDNA sequence. The other paralogs include cyp2d-3, cyp2b (-9, -10, -13, -19, -21), cyp2c (-29, -38, -39, -44), cyp2g-1, and cyp2j (-3, -5, -6, -9, -11, -13). The cyp2 family is expressed at low levels and in only limited numbers of tissues (17,24). Lastly, BCL-xL, an antiapoptotic protein, belongs to a large family of proteins involved in apoptosis and shares a moderate sequence identity among its members including BCL2-associated athanogene protein (BAG) and BCL2-associated X protein (BAX). The closest family member of the gene family, bcl2, has 46% overall identity to the bcl-xl cDNA (1), but shares as much as 73% identity in their BH domains. The bcl2 family is ubiquitously expressed at moderate to low levels (23). These three genes were carefully selected to represent a cross section of genes in the genome based on their span in degree of sequence similarity, expression levels, and tissue distribution. For sequence similarity, these gene families have overall sequence identity ranging from 46% to 93%. They range from low levels to high levels of expression, and are expressed in a tissue-specific fashion; for example, cyp2d has a limited tissue distribution (17,24), whereas bcl-xl and aldoA are expressed ubiquitously.
Parameter Optimization
As discussed above, small window sizes generate larger numbers of probes and lengthen the run time of the program. Using smaller window sizes, sensitivity would increase and specificity would decrease. On the other hand, larger window sizes limit the number of probes, speeding up the program, and increasing specificity while curtailing sensitivity. To test this, window sizes (8–24 nucleotides) and probe sizes (16–30 nucleotides) were tested using the mouse dbEST database and cDNAs from the three members of each super-family described above.
Sensitivity was defined as TP/(TP + FN), where true positives (TP) were the total ESTs found that were derived from the gene of interest, and false negatives (FN) were the number of ESTs that the algorithm should have found. The sum (TP + FN) comprised the set of “true” entries in dbEST, which was generated by first combining the currently available lists of ESTs for each gene from UniGene, the UCSC Genome Browser, and VNB. This combined list then was separated into true positives (TPs) and false positives (FPs) by use of the BackBLAST algorithm (Fig. 4). This list of true positives was set by definition as the standard for the comparison of specificity and sensitivity. This standard set of TPs was critical for both the optimization of VNB parameters and the comparison of VNB output to those of Genome Browser at UCSC and UniGene (see below).
Specificity was defined as TN/(TN + FP), where true negatives (TN) were the number of ESTs in dbEST that were not derived from the gene of interest; in other words, the bulk of dbEST. False positives (FP) were the number of ESTs found by an algorithm that were not derived from the gene of interest [i.e., all ESTs found that were not in the standard set of TPs (TP + FN) defined using BackBLAST]. The dbEST for mouse included 4,334,000 EST sequences at the time of the study.
In general, the maximum number of ESTs specific for each query (aldoA, cyp2d-9, and bcl-xl) was obtained with the smaller window and probe sizes (Fig. 5A, C, E, respectively). As expected, this simply meant the larger number of smaller probes increased the chance of finding ESTs in the database (high sensitivity). For specificity (Fig. 5B, D, F), the number of false positives increased as the window size decreased [reflected in a smaller specificity value; TN/ (TN + FP)], but only for probe sizes ≤20. In general, increasing specificity correlated with increasing probe length, while increasing sensitivity was associated with decreasing probe length. Remarkably, the smallest probe and window size that yielded the highest specificity, while retaining maximal sensitivity, was the same for all three gene families: a probe length of 20 nt and a window size of 8 nt.
Figure 5.
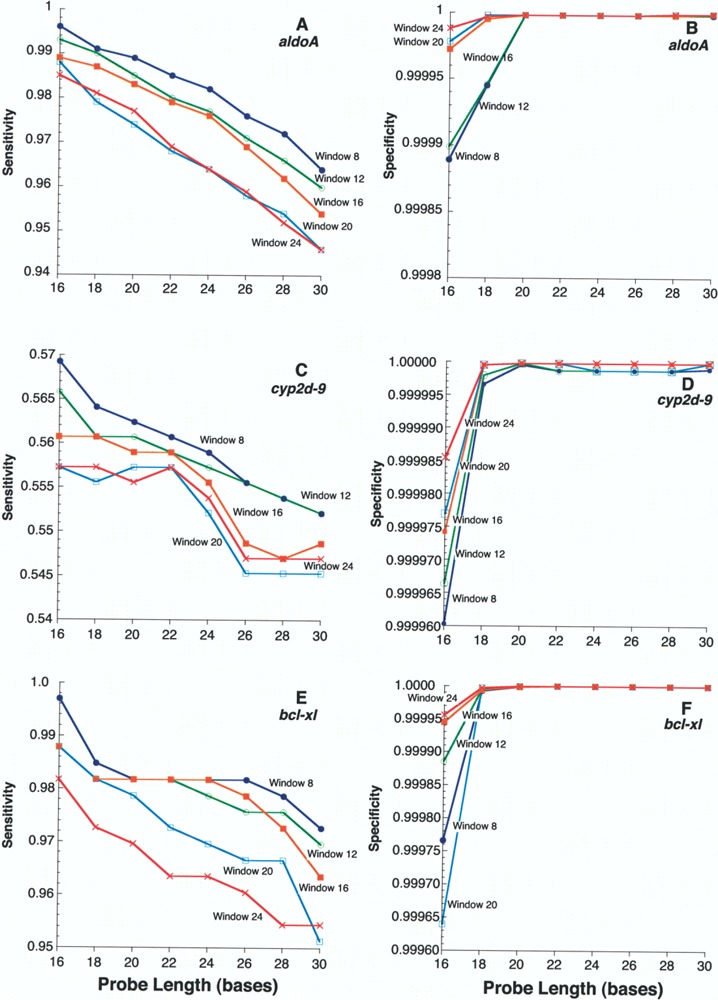
Sensitivity and specificity assessments for window size and probe size for expression of mouse aldoA, cyp2d-9, and bcl-xL. Sensitivity [TP/(TP + FN)] was plotted for these three genes as indicated for each of (A), (C), and (E) according to probe length using window sizes 8 (filled circles), 12 (open circles), 16 (filled squares), 20 (open squares), and 24 (Xs) nt for mouse aldoA (A), cyp2d-9 (C), and bcl-xL (E). Queries for mouse genes were: aldoA [GenBank:NM007438], cyp2d-9 [GenBank:NM01006], and bcl-xL [GenBank:NM009743]. Specificity [TN/(TN + FP)] was plotted for these three genes as indicated for each of (B), (D), and (F) according to probe length using window sizes from 8 to 24 nt for aldoA (B), cyp2d-9 (D), and bcl-xL (F). A drop in specificity of 0.00001 corresponded to approximately 50 false-positive ESTs. In brief, TP is defined as an EST hit in dbEST derived from the gene of interest; FN is defined as a gene-specific EST not identified by the algorithm; FP is an EST hit derived from another gene; TN is an EST hit obtained by the algorithm that was not gene specific. Further details can be found in the text.
VNB Versus Other EST Collections
The sensitivity and specificity of all “gene-specific” ESTs derived from VNB, UniGene (41) at NCBI, and the Genome Browser at UCSC (29) were compared. For the purpose of this comparison, the TP + FN set was used (defined by BackBLAST, described above). Each of the three EST collections was then evaluated for sensitivity and specificity toward a member of each of the gene families, aldo, cyp, and bcl-2 (Fig. 6). The optimal window size and probe size (8 and 20) were used for generating the ESTs from VNB. In terms of sensitivity, VNB was superior to the other methods for aldoA and bcl-xL with virtually all ESTs identified by VNB (Fig. 6A). For example, 98.7% of all ESTs were identified for aldoA and bcl-xL using VNB compared to an average of 87.2% of the ESTs for UniGene and UCSC Genome Browser. For cyp2d-9, the sensitivity was relatively low regardless of the method, with UniGene being slightly more sensitive than the other methods. The high degree of similarity among the cyp family members was likely responsible for this low sensitivity, with no method able to identify all the ESTs determined for cyp2d-9. This was interesting and indicated that each program can identify cyp2d-9 ESTs that the others cannot.
Figure 6.
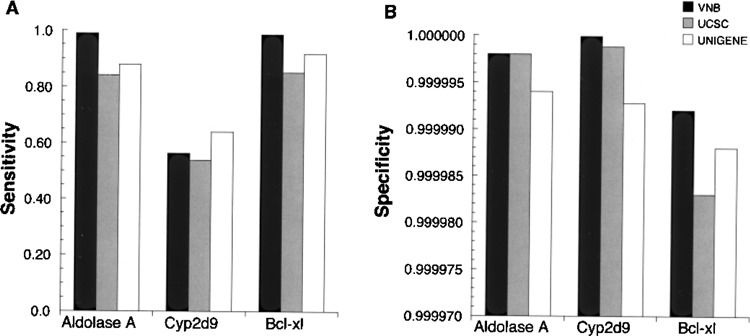
Sensitivity and specificity of gene indexed EST databases (UniGene and UCSC Genome Browser) compared to VNB algorithm. (A) Sensitivity [TP/(TP + FN)] values were plotted with the results from VNB (using optimal parameters of probes size = 20 nt and window size = 8 nt) (solid), UCSC Genome Server (gray), and UniGene (unfilled) using the queries for mouse aldoA [GenBank:NM007438], cyp2d-9 [GenBank:NM010006], and bcl-xL [GenBank:NM009743]. (B) Specificity [TN/(TN + FP)] plotted as in (A).
The three collections were compared for specificity (Fig. 6B). This parameter, which reflects the false-positive rate, is often more important than sensitivity for many expression-profiling purposes where false positives can be critically misleading. Here VNB was as effective, or more effective, than either UniGene or the UCSC Genome Browser for all three gene families. For example, for cyp2d-9, the difference in specificity between results from VNB and UCSC Genome Browser corresponded to six more FP in the UCSC list; and the difference for bcl-xL was over 50 FP. In summary, VNB was the most specific program for all three genes, and it was more sensitive than UniGene or UCSC Genome Browser for all but cyp2d-9.
Biological Validation: VNB Versus Experimental Measurements of Gene Expression
Qualitative and quantitative expression profiles were constructed for aldoA, actin, and gapdh using VNB with a window size of 8 and a probe size of 20. The qualitative profiles were compared to literature values. The quantitative profiles were compared to two different experimental assays.
Qualitative Comparison
The expression of different isoforms in specific tissues represents a valid test of qualitative expression. For example, α-actin has two isoforms; while only the skeletal form is found in skeletal muscle, both skeletal and smooth-muscle isoforms are found in the heart (25). Moreover, determination of the relative amounts of each isoform in tissues where more than one form is present represents a semiquantitative analysis. This kind of analysis was performed using VNB for mouse skeletal and smooth-muscle α-actin. The numbers of skeletal and smooth-muscle α-actin ESTs were normalized to the total number of α-actin ESTs in each tissue and compared with published experimental values (25) (Fig. 7A). The VNB-determined expression profile for actin easily reflected the experimental expression pattern. There was no smooth-muscle α-actin expression identified in skeletal muscle, while in heart both the skeletal and heart isoforms were found at the same ratios as the experimental pattern.
Figure 7.
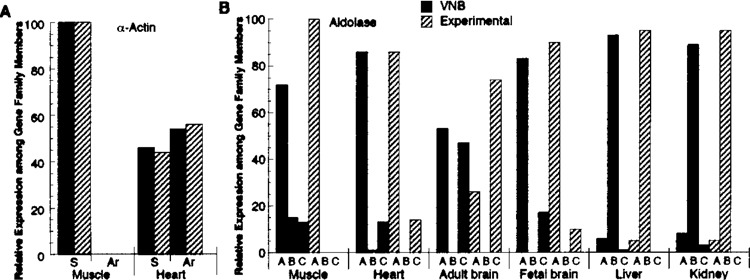
Validity of qualitative expression profiles from VNB. (A) VNB-generated expression (solid bar) of genes for mouse skeletal α-actin (acta1) (S) and smooth-muscle (aorta) α-actin (acta2) (Ar) in skeletal muscle and heart plotted as a percentage of the total for each isoform in a tissue. This was plotted similarly to experimentally determined expression (cross-hatched bars) of α-actin from the same tissues (25), which was quantified as described in Materials and Methods. (B) VNB-generated expression (solid) for mouse aldoA, aldoB, and aldoC denoted by letters. The number of ESTs for each aldolase found in muscle, heart, adult brain, fetal brain, liver, and kidney were normalized to the total aldolase ESTs in each tissue. The VNB-generated profiles used default probe size (20) and window size (8). The experimentally determined expression (cross-hatched bars) of the aldolase isozymes was estimated from data in Lebherz and Rutter (37). Queries for mouse genes were: acta1 [GenBank:NM009606], acta2 [GenBank:NM007392], aldoA [GenBank:NM007438], aldoB [GenBank: NM144903], and aldoC [GenBank:NM009657].
This analysis was expanded to the family of the aldolase isozymes. Each aldolase isozyme is selectively expressed in different tissues; aldolase A in the muscle, aldolase B in the liver, and aldolase C in the brain (46). To determine whether VNB recapitulated these experimental results, the expression profile of the mouse aldolase isozymes (A, B, and C) was determined for each isozyme in several well-characterized tissues: muscle, heart, adult brain, fetal brain, liver, and kidney. The positive ESTs for each isozyme were tallied and normalized to the total aldolase ESTs in each tissue (Fig. 7B). The VNB pattern reflected the published experimentally determined expression pattern (37) with the exception of muscle where VNB data suggest that a minor amount of aldolases B and C was expressed. Similar results were obtained for actin using data from UniGene except that false positives for smooth-muscle actin were identified in skeletal muscle and slightly higher than experimental values for smooth-muscle were identified in heart. In addition, UniGene failed to detect the experimentally determined low levels of aldolase C in heart, as well as the VNB-determined low levels in skeletal muscle and kidney (data shown in Supplementary Materials at http://www.bu.edu/aldolase/lab/software.html).
Quantitative Comparison
The qualitative/semi-quantitative VNB data shown in Figure 7 matched published experimental data and prompted a direct test of whether VNB could quantitatively determine gene expression (e.g., express as a percentage of all transcripts in a cell/tissue). First, the effect of excluding transcript-altered libraries was assessed. Expression profiles exclusively from unmanipulated libraries and exclusively from manipulated libraries were compared. Expression profiles for aldoA from unmanipulated libraries (defined in CGAP as “nonnormalized”) and from manipulated libraries (defined here as all libraries minus nonnormalized libraries) were compared (Fig. 8) using library information from 27 tissues extracted from the CGAP database (35). Absolute expression levels (as opposed to relative expression levels) of mouse aldoA for each tissue were calculated by VNB by dividing the number of aldoA ESTs by the total number of ESTs from libraries of each category. For most tissues, there were clear differences in aldoA expression levels derived from unmanipulated libraries versus those that had been manipulated. The expression level for aldoA was underestimated in most cases when manipulated libraries were used (Fig. 8, gray bars). This likely reflects the removal of many of the redundant aldoA cDNAs in these manipulated libraries. However, there were four “tissues” (liver, embryonic tissues, head & neck, and eye) where expression levels were comparable, and three “tissues” (pancreas, bone marrow, and thyroid) that had significantly higher (<30% difference) levels in the unmanipulated libraries. In both cases, this may be due to ESTs that were from predominantly “nonnormalized” libraries and/or from libraries in which the manipulation was not effective. In summary, the ability of VNB to use the library annotation information at CGAP and distinguish expression profiles derived from nonnormalized or normalized libraries indicated the potential for quantitative gene expression profiles from dbEST.
Figure 8.
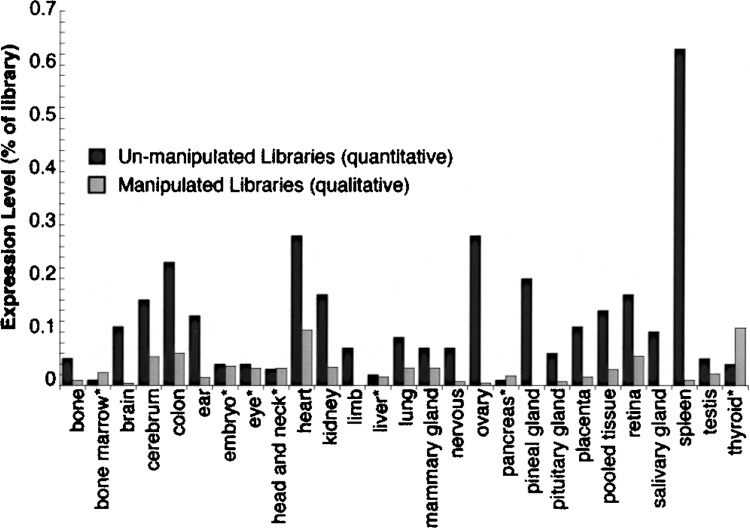
Comparison of libraries in dbEST for quantitative expression levels. VNB-generated expression profiles for mouse aldolase A from nonnormalized/unmanipulated (quantitative) libraries (solid bars), and from normalized/manipulated (qualitative) libraries (gray bars), are plotted for 27 tissues. Details are available in Materials and Methods. In brief, absolute expression levels (#EST hits for aldolase A/#ESTs in libraries from that tissue) were from values gleaned from CGAP (35) using EST library IDs as described in the text. Tissues with (*) denote those for which expression levels were either comparable or normalization resulted in higher aldoA expression.
Most quantitative gene expression assays are not absolute (e.g., five transcripts per cell or ∼0.005%), but generally are calculated relative to an assumed invariant endogenous control. Typically, ubiquitous “housekeeping” genes such as those for GAPDH or a ribosomal protein are used for reference. To compare VNB’s quantitative profiles with such experimental approaches, the ratio of aldoA to gapdh expression was calculated using only “quantitative” mouse libraries (defined in CGAP as “nonnormalized”). Experimental determination of the expression levels of mouse aldoA and gapdh were then determined using Northern blots and qPCR methods. The three methods were compared as shown in Figure 9. Of the seven tissues common to all three experimental techniques (liver, kidney, brain, spleen, testis, skeletal muscle, and lung), skeletal muscle and lung tissues could not be compared because the ESTs found were not from quantitative libraries. The ratio of aldoA/gapdh EST hits in quantitative libraries for liver, kidney, brain, spleen, and testis were 10:94, 58:92, 193: 230, 6:9, and 7:3, respectively. Notably, for both spleen and testis, quantitative EST libraries were small, containing few ESTs, so the calculated errors were relatively large. Each of the three techniques, VNB and the two experimental methods, reflected the same relative expression levels within experimental error and validated the value of both VNB (using the annotation from CGAP) and dbEST for quantitative gene expression profiling.
Figure 9.
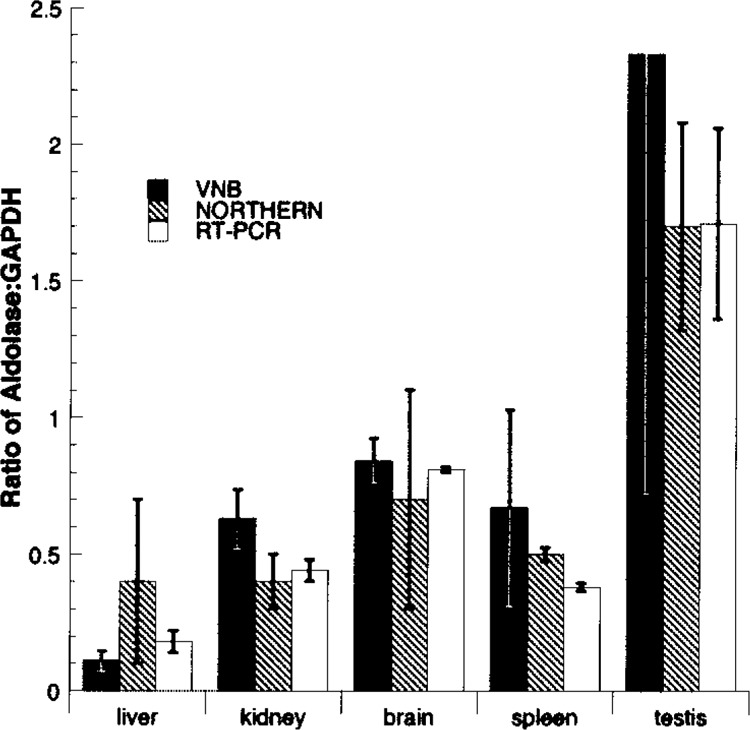
Demonstration of quantitative capacity of VNB. VNB-generated expression profiles for mouse aldoA and gapdh [GenBank: NM008084] were compiled using optimal parameters and quantitative libraries as described in Figure 6 and the ratio plotted (black bars). Ratio of aldoA/gapdh EST hits for liver, kidney, brain, spleen, and testis were 10:94, 58:92, 193:230, 6:9, and 7:3, respectively. Errors were calculated assuming a binomial distribution (p = 0.05). Data from Northern blots (cross-hatched bars) and qPCR (white bars) were determined from replicates of the same tissues as described in Materials and Methods.
DISCUSSION
Advantages of VNB
Characterizing transcriptomes using EST libraries is well established (6,12,43,44,54,56). Web-based EST analysis tools (pipelines), such as UniGene, CGAP, TIGR indexes, Bodymap, ECgene, Tissue-Info, ASePCR, and STACK (33–35,47,49,50,59,66), have made EST expression profiling simple and widespread. These pipelines, and others with more specialized purposes [GeneNest (26), Exquest (13), and Gene2EST (22)], depend on EST assembly programs [d2 cluster (49), CLOBB (45), Phrap (18), BLAT (30), CAP3 (28), MegaBLAST (70), etc.]. These assembly programs rely on many pair-wise comparisons that result in clusters of related ESTs. However, the number of pair-wise comparisons needed for a large database precludes regenerating such EST clusters/assemblies whenever new information is added. VNB, on the other hand, does not use clustering programs and thus can use the most recent publicly available data to generate expression profiles for each query in real time. Computing expression profiles in real time is particularly useful for profiling novel or poorly characterized genes. In addition, unlike a preindexed database, which only offers a single profile per gene, the user can generate multiple profiles of varying specificity and sensitivity for the same gene.
In addition, preindexed databases often contain inaccuracies due to the misidentification or failure to distinguish among paralogs or alternative transcripts. As much as 1.5–3% of ESTs are incorrectly incorporated into the wrong cluster (21,65) and this inaccuracy is even greater (30%) for ESTs derived from 5′-UTRs (39), leading to many false positives and false negatives in each cluster. One of the major problems causing inaccurate assembly is the high sequence error rate. Although not as significant as in early ESTs, these cDNAs remain in the archival database and they are still being generated (47). VNB minimizes inaccuracies in the produced profile by requiring exact matches between the selected probes and the ESTs (reducing false positives), while using many overlapping probes along the entire input sequence (reducing false negatives). The effectiveness of overlapping probes is exemplified by loss of sensitivity (increasing number of false negatives) when probe length decreases relative to window size (see Fig. 5).
Another advantage of VNB is the ability to use a custom alignment generated by ClustalW from a manually selected set of paralogs. An alignment generated using the RefSeq database may not include a complete set of known paralogs. Many alternatively spliced, poorly characterized, or novel mRNAs are not found in RefSeq. When many of the paralogs are not present in RefSeq, the known paralogs can be aligned manually with ClustalW. This ClustalW alignment can then be used as input to VNB to generate a better profile. The ability to input a custom alignment was critical to generating VNB-derived gene expression profiles for triose kinase, which was not available in UniGene or RefSeq at the time (20).
VNB has the advantage of balancing sensitivity and specificity by use of optimizable parameters. While the optimal window and probe size parameters were nearly the same for aldo, bcl2, and cyp2 gene families, despite differences in overall sequence conservation, this may not be the case for all queries. For example, smaller window and probe sizes might be more effective for an expression profile for very rare transcripts. VNB identified more P450-specific ESTs with smaller probe and window sizes (see Fig. 5) (although the false positives increased as well). Using longer probes reduced false positives, as VNB identified no false positives with probe lengths greater than 25, although sensitivity was affected. The ability to set the window size and probe length parameters separately allows the user to change the sensitivity and specificity of the produced profile. However, the choice of parameters also affects performance. Increasing the number and length of the probes, by decreasing window size and increasing probe length, respectively, will increase the runtime.
Quantification of Gene Expression From dbEST
The accurate annotation of library information at CGAP is critical to the accuracy of expression profiles generated by VNB. CGAP lists EST library information, which includes its tissue of origin (normal, cancerous, or cell line), its construction information (whether it has been “normalized”), and the number of ESTs that it contains. To generate the quantitative expression profile, VNB only uses ESTs from libraries annotated as “nonnormalized,” whereas all ESTs are used to generate the qualitative profile. CGAP correctly identified the “nonnormalized” libraries, as demonstrated by VNB’s quantitative expression profiles match experimental results (see Fig. 9). In addition, whether or not profiles are from normalized libraries clearly influences the expression profile. Much higher expression levels were seen in profiles derived from “nonnormalized” EST libraries, perhaps because many ESTs were discarded during normalization (see Fig. 8).
This ability to attain quantitative expression values brings into question how many ESTs are required to obtain reliable expression data. Profiles from VNB show accurate expression levels for tissues that have as few as 10 EST “hits.” For example, Figure 9 shows that reliable expression was obtained for both aldoA and gapdh in liver, kidney, and brain. Moreover, accurate profiles are generated even for small libraries or those with low expression levels (e.g., as few as 3–9 EST hits from spleen and testis), even though these expression levels are less statistically significant.
Other Pipelines
Other algorithms have been developed for gene expression profiling using dbEST. DigiNorthern uses BLAST and appears to perform a validation test similar to the BackBLAST routine described here, which certainly improved specificity (64). GEPIS simply uses BLAST to search the entire input sequence against dbEST (68). They validate their results by comparison with qPCR data, and only use nonmanipulated EST libraries in generating the profile. Clearly, this would have lower specificity and sensitivity than VNB. TissueInfo uses MegaBLAST and is focused on finding expression patterns in given tissues, rather than given genes (59). It acknowledges the problems with annotation and attempts to resolve this, but in the process much of the poorly annotated data is lost. In addition, the use of default 100 bp queries with 95% identity is the likely reason for the lower success rate this algorithm has with genes of high identity with different tissue specificities (59). Another powerful program, ExQuest does pair-wise comparison among ESTs using MegaBLAST (13). However, the queries are restricted to sequences in RefSeq and it defaults to the use of an 88% identity as a cutoff when comparing two ESTs, although this can be modified when needed. The claim that profiles from normalized libraries are no different from those from unmanipulated libraries is in contrast to the report here (see Fig 8). The GBA server is another tool that does in silico gene expression profiling (67). It identifies coexpressed genes by utilizing UniGene EST clusters to generate and statistically compare expression profiles.
All of the above-mentioned tools generate gene expression profiles using dbEST. However, most do not compare the specificity or sensitivity of the algorithm to any standards, nor do they compare the output to direct experimental measurements, although some do compare results to literature values. Moreover, most of these tools do not address issues of construction of EST libraries in generating their profiles and none have shown that quantitative profiles can result from the data in dbEST. VNB addressed most of these issues.
The algorithm (VNB) introduced here is an attractive alternative for generating gene expression profiles from dbEST. It uses a completely different approach from EST clustering used by most other pipelines. Compared to clustering programs, VNB has increased sensitivity and specificity and generates profiles in real time using the latest data in dbEST. Moreover, one unique aspect is its quantitative accuracy, which has been validated experimentally. The program has adjustable parameters, thus allowing accurate mining of EST data for both qualitative and quantitative output by optimizing the tradeoff between sensitivity and specificity. In summary, VNB generates quantitative expression profiles in real time from single-gene queries, and may be especially useful for studying novel or poorly characterized genes that may not be available in preconstructed gene indices and/or may require expert scientific input.
ACKNOWLEDGMENTS
The authors thank Sharona Washington and Artiom Grusdev for their technical assistance and Minita Holloway and Dr. David Waxman for helpful discussions on the cyp gene family. The authors also thank Peter Haverty and Martin Frith for early assistance with the algorithm. Support is gratefully acknowledged from the National Institutes of Health (DK43521 to D.R.T., DK065089 to D.R.T., and R25-GM62463 supported K.V. and D.C. as part of a Summer Research Experiences for Undergraduates program); National Science Foundation IGERT (DGE-9870710 supported V.A.F.); BU Technology Transfer Award (to D.R.T. and V.A.F.).
REFERENCES
- 1. Adams J. M.; Cory S. The Bcl-2 protein family: Arbiters of cell survival. Science 281:1322–1326; 1998. [DOI] [PubMed] [Google Scholar]
- 2. Adams M. D.; Kelley J. M.; Gocayne J. D.; et al. Complementary DNA sequencing: Expressed sequence tags and human genome project. Science 252:1651–1656; 1991. [DOI] [PubMed] [Google Scholar]
- 3. Adams M. D.; Kerlavage A. R.; Fleischmann R. D.; Fuldner R. A.; Bult C. J.; Lee N. H.; Kirkness E. F.; Weinstock K. G. Initial assessment of human gene diversity and expression patterns based upon 83 million nucleotides of cDNA sequence. Nature 377:3–174; 1995. [PubMed] [Google Scholar]
- 4. Ahmed F. E. Molecular techniques for studying gene expression in carcinogenesis. J. Environ. Sci. Health. C. Environ. Carcinog. Ecotoxicol. Rev. 20:77–116; 2002. [DOI] [PubMed] [Google Scholar]
- 5. Altschul S. F.; Gish W.; Miller W.; Myers E. W.; Lipman D. J. Basic Local Alignment Sequence Tool (BLAST). J. Mol. Biol. 215:403–410; 1990. [DOI] [PubMed] [Google Scholar]
- 6. Audic S.; Claverie J. M. The significance of digital gene expression profiles. Genome Res. 7:986–995; 1997. [DOI] [PubMed] [Google Scholar]
- 7. Baranova A. V.; Lobashev A. V.; Ivanov D. V.; Krukovskaya L. L.; Yankovsky N. K.; Kozlov A. P. In silico screening for tumour-specific expressed sequences in human genome. FEBS Lett. 508:143–148; 2001. [DOI] [PubMed] [Google Scholar]
- 8. Barrett T.; Troup D. B.; Wilhite S. E.; et al. NCBI GEO: Mining tens of millions of expression profiles—database and tools update. Nucleic Acids Res. 35: D760–765; 2007. [DOI] [PMC free article] [PubMed] [Google Scholar]
- 9. Benson D. A.; Boguski M.; Lipman D. J.; Ostell J. GenBank. Nucleic Acids Res. 22:3441–3444; 1994. [DOI] [PMC free article] [PubMed] [Google Scholar]
- 10. Boguski M.; Lowe T.; Tolstoshev C. dbEST—database for “expressed sequence tags.” Nat. Genet. 4:332–333; 1993. [DOI] [PubMed] [Google Scholar]
- 11. Boguski M. S.; Schuler G. D. ESTablishing a human transcript map. Nat. Genet. 10:369–371; 1995. [DOI] [PubMed] [Google Scholar]
- 12. Brentani H.; Caballero O. L.; Camargo A. A. et al. The generation and utilization of a cancer-oriented representation of the human transcriptome by using expressed sequence tags. Proc. Natl. Acad. Sci. USA 100:13418–13423; 2003. [DOI] [PMC free article] [PubMed] [Google Scholar]
- 13. Brown A. C.; Kai K.; May M. E.; Brown D. C.; Roopenian D. C. ExQuest, a novel method for displaying quantitative gene expression from ESTs. Genomics 83:528–539; 2004. [DOI] [PubMed] [Google Scholar]
- 14. Burke J.; Davison D.; Hide W. d2_cluster: A validated method for clustering EST and full-length cDNAsequences. Genome Res. 9:1135–1142; 1999. [DOI] [PMC free article] [PubMed] [Google Scholar]
- 15. Choi K. H.; Lai V.; Foster C. E.; Morris A. J.; Tolan D. R.; Allen K. N. New superfamily members identified for Schiff-base enzymes based on verification of catalytically essential residues. Biochemistry 45:8546–8555; 2006. [DOI] [PubMed] [Google Scholar]
- 16. Demeter J.; Beauheim C.; Gollub J.; et al. The Stanford Microarray Database: Implementation of new analysis tools and open source release of software. Nucleic Acids Res. 35:D766–770; 2007. [DOI] [PMC free article] [PubMed] [Google Scholar]
- 17. Du L.; Hoffman S. M.; Keeney D. S. Epidermal CYP2 family cytochromes P450. Toxicol. Appl. Pharmacol. 195:278–287; 2004. [DOI] [PubMed] [Google Scholar]
- 18. Ewing B.; Green P. Base-calling of automated sequencer traces using phred. II. Error probabilities. Genome Res. 8:186–194; 1998. [PubMed] [Google Scholar]
- 19. Feinberg A. P.; Vogelstein B. A technique for radio-labelling DNA restriction endonuclease fragments to high specific activity. Anal. Biochem. 132:6–13; 1983. [DOI] [PubMed] [Google Scholar]
- 20. Funari V. A.; Herrera V. L. M.; Freeman D.; Tolan D. R. Genes required for fructose metabolism are expressed in Purkinje cells in the cerebellum. Mol. Brain Res. 142:115–122; 2005. [DOI] [PubMed] [Google Scholar]
- 21. Funari V. A.; Leyfer D.; Tolan D. R. Expression profiling using the expressed sequence tag (EST) database for comparative physiology and metabolism. In: Pandalai S. G., Ed. Recent research developments in comparative biochemistry & physiology. Kerala, India: Transworld Research Network; 2000:13–30. [Google Scholar]
- 22. Gemund C.; Ramu C.; Altenberg-Greulich B.; Gibson T. J. Gene2EST: A BLAST2 server for searching expressed sequence tag (EST) databases with eukaryotic gene-sized queries. Nucleic Acids Res. 29:1272–1277; 2001. [DOI] [PMC free article] [PubMed] [Google Scholar]
- 23. Gobe G.; Rubin M.; Williams G.; Sawczuk I.; Buttyan R. Apoptosis and expression of Bcl-2, Bcl-XL, and Bax in renal cell carcinomas. Cancer Invest. 20:324–332; 2002. [DOI] [PubMed] [Google Scholar]
- 24. Gonzalez F. J. Human cytochromes P450: Problems and prospects. Trends Pharmacol. Sci. 13:346–352; 1992. [DOI] [PubMed] [Google Scholar]
- 25. Gunning P.; Ponte P.; Blau H.; Kedes L. Alpha-skeletal and alpha-cardiac actin genes are coexpressed in adult human skeletal muscle and heart. Mol. Cell. Biol. 3:1985–1995; 1983. [DOI] [PMC free article] [PubMed] [Google Scholar]
- 26. Haas S. A.; Beissbarth T.; Rivals E.; Krause A.; Vingron M. GeneNest: Automated generation and visualization of gene indices. Trends Genet. 16:521–523; 2000. [DOI] [PubMed] [Google Scholar]
- 27. Hillier L.; Lennon G.; Becker M.; et al. Generation and analysis of 280,000 human expressed sequence tags. Genome Res. 6:807–828; 1996. [DOI] [PubMed] [Google Scholar]
- 28. Huang X.; Madan A. CAP3: A DNA sequence assembly program. Genome Res. 9:868–877; 1999. [DOI] [PMC free article] [PubMed] [Google Scholar]
- 29. Karolchik D.; Baertsch R.; Diekhans M.; et al. The UCSC genome browser database. Nucleic Acids Res. 31:51–54; 2003. [DOI] [PMC free article] [PubMed] [Google Scholar]
- 30. Kent W. J. BLAT—the BLAST-like alignment tool. Genome Res. 12:656–664; 2002. [DOI] [PMC free article] [PubMed] [Google Scholar]
- 31. Kent W. J.; Sugnet C. W.; Furey T. S.; Roskin K. M.; Pringle T. H.; Zahler A. M.; Haussler D. The human genome browser at UCSC. Genome Res. 12:996–1006; 2002. [DOI] [PMC free article] [PubMed] [Google Scholar]
- 32. Kilpinen S.; Autio R.; Ojala K.; et al. Systematic bio-informatic analysis of expression levels of 17,330 human genes across 9,783 samples from 175 types of healthy and pathological tissues. Genome Biol. 9: R139; 2008. [DOI] [PMC free article] [PubMed] [Google Scholar]
- 33. Kim N.; Lim D.; Lee S.; Kim H. ASePCR: Alternative splicing electronic RT-PCR in multiple tissues and organs. Nucleic Acids Res. 33:W681–685; 2005. [DOI] [PMC free article] [PubMed] [Google Scholar]
- 34. Kim N.; Shin S.; Lee S. ECgene: Genome-based EST clustering and gene modeling for alternative splicing. Genome Res. 15:566–576; 2005. [DOI] [PMC free article] [PubMed] [Google Scholar]
- 35. Krizman D. B.; Wagner L.; Lash A.; Strausberg R. L.; Emmert-Buck M. R. The Cancer Genome Anatomy Project: EST sequencing and the genetics of cancer progression. Neoplasia 1:101–106; 1999. [DOI] [PMC free article] [PubMed] [Google Scholar]
- 36. Larkin M. A.; Blackshields G.; Brown N. P.; et al. Clustal W and Clustal X version 2.0. Bioinformatics 23:2947–2948; 2007. [DOI] [PubMed] [Google Scholar]
- 37. Lebherz H. G.; Rutter W. J. Distribution of fructose diphosphate aldolase variants in biological systems. Biochemistry 8:109–121; 1969. [DOI] [PubMed] [Google Scholar]
- 38. Lein E. S.; Hawrylycz M. J.; Ao N.; et al. Genome-wide atlas of gene expression in the adult mouse brain. Nature 445:168–176; 2007. [DOI] [PubMed] [Google Scholar]
- 39. Liu D.; Graber J. H. Quantitative comparison of EST libraries requires compensation for systematic biases in cDNA generation. BMC Bioinformatics 7:77; 2006. [DOI] [PMC free article] [PubMed] [Google Scholar]
- 40. Mestek A.; Stauffer J.; Tolan D. R.; Ciejek-Baez E. Sequence of a mouse brain aldolase A cDNA. Nucleic Acids Res. 15:10595; 1987. [DOI] [PMC free article] [PubMed] [Google Scholar]
- 41. Miller G.; Fuchs R.; Lai E. IMAGE cDNA clones, UniGene clustering, and ACeDB: An integrated resource for expressed sequence information. Genome Res. 7:1027–1032; 1997. [DOI] [PMC free article] [PubMed] [Google Scholar]
- 42. Miller R. T.; Christoffels A. G.; Gopalakrishnan C.; Burke J.; Ptitsyn A. A.; Broveak T. R.; Hide W. A. A comprehensive approach to clustering of expressed human gene sequence: The sequence tag alignment and consensus knowledge base. Genome Res. 9:1143–1155; 1999. [DOI] [PMC free article] [PubMed] [Google Scholar]
- 43. Nagaraj S. H.; Gasser R. B.; Ranganathan S. A hitchhiker’s guide to expressed sequence tag (EST) analysis. Brief Bioinform 8:6–21; 2007. [DOI] [PubMed] [Google Scholar]
- 44. Okubo K.; Itoh K.; Fukushima A.; Yoshii J.; Matsubara K. Monitoring cell physiology by expression profiles and discovering cell type-specific genes by compiled expression profiles. Genomics 30:178–186; 1995. [DOI] [PubMed] [Google Scholar]
- 45. Parkinson J.; Guiliano D. B.; Blaxter M. Making sense of EST sequences by CLOBBing them. BMC Bioinformatics 3:31; 2002. [DOI] [PMC free article] [PubMed] [Google Scholar]
- 46. Penhoet E. E.; Rajkuman R.; Rutter W. J. Multiple forms of fructose diphosphate aldolase in mammalian tissues. Proc. Natl. Acad. Sci. USA 56:1275–1282; 1966. [DOI] [PMC free article] [PubMed] [Google Scholar]
- 47. Pertea G.; Huang X.; Liang F.; et al. TIGR Gene Indices clustering tools (TGICL): A software system for fast clustering of large EST datasets. Bioinformatics 19:651–652; 2003. [DOI] [PubMed] [Google Scholar]
- 48. Pruitt K. D.; Katz K. S.; Sicotte H.; Maglott D. R. Introducing RefSeq and LocusLink: Curated human genome resources at the NCBI. Trends Genet. 16:44–47; 2000. [DOI] [PubMed] [Google Scholar]
- 49. Ptitsyn A.; Hide W. CLU: A new algorithm for EST clustering. BMC Bioinformatics 6(Suppl. 2):S3; 2005. [DOI] [PMC free article] [PubMed] [Google Scholar]
- 50. Quackenbush J.; Cho J.; Lee D.; et al. The TIGR Gene Indices: Analysis of gene transcript sequences in highly sampled eukaryotic species. Nucleic Acids Res. 29:159–164; 2001. [DOI] [PMC free article] [PubMed] [Google Scholar]
- 51. Quackenbush J.; Liang F.; Holt I.; Pertea G.; Upton J. The TIGR gene indices: Reconstruction and representation of expressed gene sequences. Nucleic Acids Res. 28:141–145; 2000. [DOI] [PMC free article] [PubMed] [Google Scholar]
- 52. Rebhan M.; Chalifa-Caspi V.; Prilusky J.; Lancet D. GeneCards: Encyclopedia for genes, proteins and diseases. Bioinformatics 14:656–664; 1998. [DOI] [PubMed] [Google Scholar]
- 53. Rhodes D. R.; Kalyana-Sundaram S.; Mahavisno V.; et al. Oncomine 3.0: Genes, pathways, and networks in a collection of 18,000 cancer gene expression profiles. Neoplasia 9:166–180; 2007. [DOI] [PMC free article] [PubMed] [Google Scholar]
- 54. Romualdi C.; Bortoluzzi S.; D’Alessi F.; Danieli G. A. IDEG6: A web tool for detection of differentially expressed genes in multiple tag sampling experiments. Physiol. Genomics 12:159–162; 2003. [DOI] [PubMed] [Google Scholar]
- 55. Rottmann W. H.; Deselms K. R.; Niclas J.; Camerato T.; Holman P. S.; Green C. J.; Tolan D. R. The complete amino acid sequence of the human aldolase C isozyme derived from genomic clones. Biochimie 69:137–145; 1987. [DOI] [PubMed] [Google Scholar]
- 56. Ryo A.; Kondoh N.; Wakatsuki T.; Hada A.; Yamamoto N.; Yamamoto M. A method for analyzing the qualitative and quantitative aspects of gene expression: A transcriptional profile revealed for HeLa cells. Nucleic Acids Res. 26:2586–2592; 1998. [DOI] [PMC free article] [PubMed] [Google Scholar]
- 57. Sakamoto K.; Kirita S.; Baba T.; Nakamura Y.; Yamazoe Y.; Kato R.; Takanaka A.; Matsubara T. A new cytochrome P450 form belonging to the CYP2D in dog liver microsomes: Purification, cDNA cloning, and enzyme characterization. Arch. Biochem. Biophys. 319:372–382; 1995. [DOI] [PubMed] [Google Scholar]
- 58. Sambrook J.; Fritsch E. F.; Maniatis T. Molecular cloning: A laboratory manual. 2nd ed. New York: Cold Spring Harbor Laboratory Press; 1989. [Google Scholar]
- 59. Skrabanek L.; Campagne F. TissueInfo: high-throughput identification of tissue expression profiles and specificity. Nucleic Acids Res. 29:E102–102; 2001. [DOI] [PMC free article] [PubMed] [Google Scholar]
- 60. Sorek R.; Safer H. M. A novel algorithm for computational identification of contaminated EST libraries. Nucleic Acids Res. 31:1067–1074; 2003. [DOI] [PMC free article] [PubMed] [Google Scholar]
- 61. Su A. I.; Wiltshire T.; Batalov S.; et al. A gene atlas of the mouse and human protein-encoding transcriptomes. Proc. Natl. Acad. Sci. USA 101:6062–6067; 2004. [DOI] [PMC free article] [PubMed] [Google Scholar]
- 62. Thompson J. D.; Higgins D. G.; Gibson T. J. CLUSTAL W: Improving the sensitivity of progressive multiple sequence alignment through sequence weighting, position-specific gap penalties and weight matrix choice. Nucleic Acids Res. 22:4673–4680; 1994. [DOI] [PMC free article] [PubMed] [Google Scholar]
- 63. Torres T. T.; Metta M.; Ottenwalder B.; Schlotterer C. Gene expression profiling by massively parallel sequencing. Genome Res. 18:172–177; 2008. [DOI] [PMC free article] [PubMed] [Google Scholar]
- 64. Wang J.; Liang P. DigiNorthern, digital expression analysis of query genes based on ESTs. Bioinformatics 19:653–654; 2003. [DOI] [PubMed] [Google Scholar]
- 65. Wang J. P.; Lindsay B. G.; Leebens-Mack J.; Cui L.; Wall K.; Miller W. C.; dePamphilis C. W. EST clustering error evaluation and correction. Bioinformatics 20:2973–2984; 2004. [DOI] [PubMed] [Google Scholar]
- 66. Wheeler D. L.; Church D. M.; Lash A. E.; et al. Database resources of the National Center for Biotechnology Information. Nucleic Acids Res. 29:11–16; 2001. [DOI] [PMC free article] [PubMed] [Google Scholar]
- 67. Wu X.; Walker M. G.; Luo J.; Wei L. GBA server: EST-based digital gene expression profiling. Nucleic Acids Res. 33:W673–676; 2005. [DOI] [PMC free article] [PubMed] [Google Scholar]
- 68. Zhang Y.; Eberhard D. A.; Frantz G. D.; et al. GEPIS—quantitative gene expression profiling in normal and cancer tissues. Bioinformatics 20:2390–2398; 2004. [DOI] [PubMed] [Google Scholar]
- 69. Zhang Y.; Luoh S. M.; Hon L. S.; Baertsch R.; Wood W. I.; Zhang Z. GeneHub-GEPIS: Digital expression profiling for normal and cancer tissues based on an integrated gene database. Nucleic Acids Res. 35: W152–158; 2007. [DOI] [PMC free article] [PubMed] [Google Scholar]
- 70. Zhang Z.; Schwartz S.; Wagner L.; Miller W. A greedy algorithm for aligning DNA sequences. J. Comput. Biol. 7:203–214; 2000. [DOI] [PubMed] [Google Scholar]