

Abstract
T cell polarization toward and within the cellular interface with an APC is critical for effective T cell activation. The Rho family GTPase Cdc42 is a central regulator of cellular polarization. Using live-cell imaging, we characterized the spatiotemporal patterns of Cdc42 activity and their physiological regulation. Using three independent means of experimental manipulation of Cdc42 activity, we established that Cdc42 is a critical regulator of T cell actin dynamics, TCR clustering, and cell cycle entry. Using quantification of three-dimensional data, we could relate distinct spatiotemporal patterns of Cdc42 activity to specific elements of T cell activation. This result suggests that Cdc42 activity in specific locations at specific times is most critical for its function in T cell activation.
Tcells activate in a cellular interaction with APCs. The TCR is the central receptor regulating T cell activation and recognizes antigenic peptide presented by MHC on the surface of the APC (1). Costimulatory receptors enhance and complement the TCR (2). CD28 is an important costimulatory receptor that recognizes the ligands B7-1 and B7-2 on the APC surface. Polarization of the T cell toward the T cell/APC interface, resulting in the formation of an immunological synapse, enhances T cell activation (3, 4). In a mature immunological synapse, T cell actin dynamically accumulates at the interface, TCR/MHC couples accumulate at its center, and the microtubule organizing center (MTOC)3 orients toward it (5).
Cdc42 is a critical regulator of cellular polarization from yeast to man. Both upstream activators, such as Vav, and downstream effectors, such as the Wiskott-Aldrich Syndrome protein (WASP), are critical for T cell polarization and activation (5-7). Previous work showed that Cdc42 accumulates at the T cell/APC interface (8) and suggested that Cdc42 regulates T cell actin accumulation at the T cell/APC interface and reorientation of the MTOC toward it (9). However, a detailed analysis of the role of Cdc42 in regulating various aspects of T cell activation in primary T cells has been largely inaccessible for two reasons. First, Cdc42 is essential. Cdc42-deficiency results in embryonic lethality (10), and even overexpression of an active mutant interferes with cell survival (11). Second, as a suspected central regulator of T cell polarization, Cdc42 is likely to play multiple roles at different stages and intracellular locations in T cell activation. In this study, we have combined two recent approaches to cell signaling to study Cdc42 function during T cell activation. First, we have determined and quantified the spatiotemporal patterns of Cdc42 activity in live primary T cell/APC couples under various T cell activation conditions. Second, we have used a series of protein transduction (12) reagents to manipulate Cdc42 activity short-term and quantitatively. We could thus show that Cdc42 is a central regulator of T cell polarization with significant consequences for T cell activation. We have then combined both approaches to study how the spatiotemporal patterns of Cdc42 activity are related to various elements of T cell activation. Our data suggest that specific patterns of Cdc42 activity regulate distinct elements of T cell activation, thus accounting for multiple roles of Cdc42 during T cell activation.
Materials and Methods
Cells and reagents
In vitro-primed primary T cells from 5C.C7 (13) and Cbl-b-deficient 5C.C7 (14) TCR transgenic mice were used in all experiments and were generated as described previously (15). The use of these mice has been reviewed and approved by the University of Texas (UT) Southwestern Institutional Animal Care and Use Committee. As APCs, CH27 and I-Ek-GFP-transfected A20 B cell lymphoma cells (15) were used. Agonist peptide concentrations were adjusted by dilution into the null peptide moth cytochrome c (MCC) D93E/K99T/T102S (15). Costimulation blockade with Abs against ICAM-1 or B7-1/B7-2 was as described previously (16).
Imaging
The live-cell Cdc42 sensor consists of aas 230–289 of WASP, directly followed by enhanced GFP, and the last 14 aas of Cdc42 containing the CAAX box. A control sensor with a 100-fold reduced affinity for active Cdc42 contains three mutations, F244D, H246D, and H249D. I-Ek-GFP (15), actin-GFP, (16) and tubulin-GFP (16) were used as described. The Cdc42 sensor, actin-GFP, and tubulin-GFP were introduced into primary T cells by retroviral transduction using a Moloney murine leukemia virus-derived system as described (16). The microscopy system and image acquisition have been described in detail (16). Briefly, primary T cells and peptide-incubated APCs were allowed to interact at 37°C on the microscope stage. Every 20 s, a differential interference contrast (DIC) bright field image and 21 GFP images spaced 1 μm in z covering the entire cell were acquired. Staining with WASP GTPase-binding domain (GBD) was performed according to an established protocol (8), and images were acquired on a Deltavision deconvolution microscope with a ×60 magnification.
Image analysis
For all image analysis, we generated three-dimensional reconstructions of productive cell couples. Time points were 1 s, 3 s, 5 s, and ≥7 s after cell couple formation for TCR/MHC accumulation and every 20 s between 20 min before and 100 min after cell couple formation plus ≥5 s after cell couple formation for actin, MTOC, and Cdc42 sensor analysis. Time 0 was set to the first time point with a maximally spread T cell/APC interface. This results in a more reliable synchronization of single-cell data than using the often-ambiguous first membrane contact between T cell and APC that occurred 20–40 s before the maximal spreading of the interface. Analysis of MHC/TCR accumulation, early actin spreading, and MTOC reorientation was as percentage of cell couples fulfilling precisely defined fluorescence intensity and geometry criteria, as established (15, 16).
Cdc42 sensor accumulation and sustained actin accumulation were analyzed with accumulation and centrality indices, as defined in Results. Only cells with Cdc42 sensor fluorescence intensity at the T cell/APC interface of >40% above cellular fluorescence background were analyzed. In these cells, the percentage of total fluorescence translocated to the area of accumulation was determined in background-corrected top down projections of the three-dimensional data. We measured the total integrated fluorescence at the area of accumulation, subtracted the area of accumulation times the average cellular fluorescence intensity (to account for the amount of fluorescence that would have been in the area of accumulation without any Cdc42 enrichment), and we expressed the difference as fraction of the total integrated fluorescence of the T cell. To determine the area of accumulation as a percentage of the interface area, measurements were taken in DIC and three-dimensional fluorescence images. Unambiguous determination of the interface area is not possible in either image. As the best approximation, we measured the interface diameter in the DIC images and the diameter of the area of accumulation in the three-dimensional fluorescence images. Next, we assumed comparable geometry in both dimensions of the interface, as verified for the area of accumulation in the fluorescence images and seen for the entire interface in experiments with supported lipid bilayers as APC substitutes. We could then calculate the size of the area of accumulation relative to the interface area as the ratio of the square of the diameter of the area of accumulation to the square of the interface diameter. Comparing the accumulation and centrality indices to more traditional means of analysis, percentage of cell couples with accumulation in any pattern and percentage of cell couples with accumulation in a central pattern, respectively, we found that they were closely related (data not shown). Comparing the more traditional quantification to the indices-based one in the correlation analysis (see of Fig. 10), the major conclusions re-emerged. However, and in contrast to the indices-based quantification, in the analysis based on percentage of cell couples with a particular phenotype, stronger relations between patterns of Cdc42 accumulation and elements of T cell polarization, as identified by the slope of the regression curves, were not always the more reliable and vice versa, as they should be (data not shown). In addition, SEs of the correlation coefficients were larger than in the indices-based analysis (data not shown). The better internal consistency of the indices-based quantification suggests that Cdc42 accumulation analysis based on the accumulation and centrality indices is superior.
FIGURE 10.

Specific patterns of Cdc42 accumulation are related to distinct elements of T cell activation. In A, an example of a correlation analysis of one Cdc42 pattern, accumulation at the center of the T cell/APC interface in the second minute after cell couple formation (measured with the centrality index), vs one element of T cell activation, sustained actin accumulation (measured with the actin accumulation index) is shown. Data points for five conditions as indicated were plotted. Anti-B7 indicates 10 μg/ml anti-B7-1 and anti-B7-2 Abs. A linear regression curve was generated with its slope and correlation coefficient (shown) with SE. For each other pair-wise combination of one Cdc42 pattern with one element of T cell activation, a similar linear regression analysis was performed (data not shown). In B, the normalized (Materials and Methods) slopes are given; in C, the correlation coefficients, as listed. For correlation coefficients >0.5, all SEs were ≤0.08. Centrality and accumulation indices are abbreviated as “cen” and “acc,” respectively. Because no significant relations exists between IL-2 production and any pattern of Cdc42 activity, slopes of the correlation graphs are meaningless and not included in B. The relative slope and the correlation coefficient for the relation between the Cdc42 centrality index at 1 min and sustained actin dynamics are not visible. They are 0.264 and 0.18, respectively.
Correlation analyses were performed as described in Results. To be able to compare slopes of the regression curves of all four patterns of Cdc42 accumulation with one particular element of T cell activation, we multiplied each slope with the difference between the largest and smallest value of the corresponding quantitative measure of Cdc42 accumulation. The resulting numbers express how much the particular elements of T cell polarization change over the total observed range of changes of the Cdc42 pattern. The largest such product for an element of T cell activation was then set to one, and the ones from the other spatiotemporal patterns of Cdc42 activity were expressed as a fraction.
The significance of differences between experimental conditions in analyses based on percentage of cell couples with a particular phenotype was calculated using a two-sample proportion z test. In analyses based on accumulation and centrality indices, single-cell (fractions of sensor translocation to the interface) and single-cell (fractions of sensor translocation to the interface)/(area of accumulation as fraction of the interface area) were multiplied with the (fraction of cell couples above threshold) for the corresponding experimental condition, and the significant difference of such single-cell data for different experimental conditions was assessed using a Student’s t test.
Tat fusion proteins
The tat fusion protein of the WASP GBD contains the WASP GBD domain (aas 230–289) with the same N-terminal extension as the previously described tat WASP verprolin, cofilin homology, acidic (16). Constructs for the expression of tat fusion proteins of human Rho family GTPases and their dominant-negative (dn) and constitutively active (ca) mutants were a gift from Dr. S. Dowdy (University of California at San Diego, La Jolla, CA) (17). They were converted to the mouse sequences. All tat fusion proteins were expressed in Escherichia coli using the T7 expression system (Novagen) and purified under native conditions using immobilized metal affinity chromatography (Qiagen) and HiTrap SP Sepharose ion exchange chromatography (Amersham). Dose-dependent uptake into 100% of the primary 5C.C7 T cells was verified for each fusion protein with fluorescein-labeled versions by FACS and fluorescence microscopy (to verify homogeneous cytosolic distribution) (data not shown). Tat fusion proteins were used at the indicated concentrations as described previously (16). Briefly, the T cells were preincubated for 30 min at 37°C with the tat fusion reagent, and the reagent was present during the T cell/APC interactions at the same concentration. Dose responses were used to determine optimal tat fusion protein concentrations, as described in detail in another manuscript (I. Tskvitaria-Fuller, N. Mistry, and C. Wülfing, manuscript in preparation).
Signaling and effector functions
IL-2 secretion was determined as published previously (18). Cell cycle entry was assayed by FACS according to standard methods. Briefly, T cell/APC couples were dissociated with 0.5 mM EDTA, stained for the 5C.C7 TCR with fluorescein-conjugated anti-Vα11 (BD Pharmingen) and for apoptosis with 7-aminoactinomycin D, fixed with 0.5% paraformaldehyde, and DNA contents were measured by staining with Hoechst 33342 in 1% Tween 20. The total amount of active Cdc42 in a T cell was determined by precipitation of active Cdc42 from T cell lysates with a p21-activated kinase-1 GBD GST fusion protein coupled to agarose, according to instruction from the manufacturer (Chemicon International), followed by Western blotting with an anti-Cdc42 polyclonal Ab (Santa Cruz Biotechnology). T cells were stimulated with anti-CD3ε (2C11) and anti-CD28 Abs (both obtained from BD Pharmingen) at various concentrations as listed and separate cross-linking secondary Abs at 10 μg/ml for 5 min at 37°C before lysis.
Results
Active Cdc42 accumulates at the T cell/APC
To determine when and where Cdc42 is active during T cell activation, we designed a live-cell Cdc42 sensor. The GBD of WASP binds to GTP-bound Cdc42 with reasonable affinity (Kd ~ 100 nM) and high selectivity (19-21). To allow live cell detection of active Cdc42, we fused the GBD to GFP. To selectively monitor the vicinity of Cdc42, we added the Cdc42 CAAX box, which mediates prenylation. We then expressed the Cdc42 sensor in in vitro-primed, primary T cells by retroviral transduction. As a T cell model, we used 5C.C7 TCR transgenic T cells, where polarization has been extensively studied before (15, 16, 22-24). The 5C.C7 TCR recognizes the MCC 92–103 peptide presented by I-Ek (13). We first studied the interaction of Cdc42 sensor-transduced 5C.C7 T cells with CH27 B cell lymphoma APCs in the presence of 10 μM MCC, a “full stimulus.” Concomitant with interface formation, active Cdc42 accumulated at the T cell/APC interface (Fig. 1A) in 98% of the cell couples (n = 101). Enhanced accumulation at the center of the interface was observed in 65% of the cell couples. Interface accumulation of active Cdc42 dissipated over time. Only 25% of the cell couples showed accumulation of active Cdc42 5–15 min after interface formation in any pattern, only 3% at the center of the interface.
FIGURE 1.

Active Cdc42 accumulates at the T cell/APC interface immediately after its formation preferentially at its center. A, An interaction of a Cdc42 sensor-transduced 5C.C7 T cells with a CH27 B cell lymphoma APC in the presence of 10 μM MCC agonist peptide (full stimulus) is shown. In the top row of each panel, DIC images are shown; on the bottom matching, top down maximum projections of three-dimensional Cdc42 sensor fluorescence data. The Cdc42 sensor fluorescence intensity is displayed in a rainbow false color scale (increasing from blue to green, yellow, and red). T cell activation (time (t) = 0:00 min indicates the formation of a spread interface) induced immediate sensor accumulation at the T cell/APC interface, preferentially at its center. The images are individual frames.4 B, 5C.C7 T cells were activated by CH27 APCs and 10 μM MCC agonist peptide, fixed, and stained with a purified WASP GBD-GFP fusion protein. Two individual z planes of a deconvolved three-dimensional data stack of one APC (B) with four T cells (T) are shown in the same rainbow-colored scale as in A. Various degrees of the accumulation of active Cdc42 ranging from central to none can be seen. C, 5C.C7 T cells were activated by CH27 APCs and 10 μM MCC agonist peptide, and the relative amount of IL-2 production was quantified by intracellular cytokine staining. Conditions, as indicated, were buffer only (set to 100%), 5C.C7 T cell transduction with the Cdc42 sensor, and the presence of blocking B7 Abs (as a reference for a significant block in IL-2 production). Averages with SDs are shown for four independent experiments.
To quantify the amount and localization of Cdc42, we developed two new measures. To quantify the amount of active Cdc42 at the T cell/APC interface, we defined an “accumulation index.” For each cell couple, we first determined whether the fluorescence intensity of the Cdc42 sensor within the area of interface accumulation was ≥40% above the cellular fluorescence background. Such thresholding is required, because specific interface accumulation becomes difficult to distinguish from random intensity fluctuations below this threshold. When the interface intensity was above this threshold, the fraction of total fluorescence that was translocated to the interface was determined from our three-dimensional imaging data (Materials and Methods). The accumulation index was then defined as follows: accumulation index = fraction of cell couples above threshold × average fraction of sensor translocation interface. To measure how disperse Cdc42 activation was, we defined a centrality index. Again, cell couples were thresholded first. For cell couples above the threshold, we determined the area of accumulation as a percentage of the entire interface area (Materials and Methods). The only two patterns of Cdc42 sensor accumulation at the T cell/APC interface frequently observed were accumulation across the entire interface or accumulation at its center. A smaller area of accumulation thus represents more central accumulation. In addition, we took into account that more translocation of the Cdc42 sensor to a given area of accumulation constitutes a more intense accumulation. The centrality index was then defined as follows: centrality index = fraction of cell couples above threshold × average fraction of sensor translocation to the interface/area of accumulation as fraction of the interface area. These two indices generated similar but superior quantitative data compared with the widely used method to assess fluorescence accumulation, percentage of cell couples with accumulation above threshold in a particular pattern, as discussed in Materials and Methods. In the presence of a full T cell stimulus (CH27 APC with 10 μM MCC peptide), both indices reach maximal values within 20 min after the formation of a tight T cell/APC interface (Figs. 2 and 3). They slowly declined thereafter, the centrality index more rapidly than the accumulation index (Figs. 1 and 3). These data suggest that localized Cdc42 activation peaks during the initial establishment of a T cell/APC couple and that Cdc42 activity at the center of the T cell/APC interface is more prevalent during this peak of Cdc42 activation.
FIGURE 2.

A control sensor accumulates at the drastically reduced levels. A, Two interactions of a control Cdc42 sensor-transduced 5C.C7 T cell with a CH27 B cell lymphoma APC each in the presence of 10 μM MCC agonist peptide (full stimulus) are shown similar to Fig. 1A. Predominant internal localization in the vicinity of the MTOC is visible in both. In the top part of the figure, control sensor accumulation >40% above fluorescence background at the cell membrane, not the entire cell, is shown at the 1-s time point. The images are individual frames.4 B, Accumulation and centrality indices, as indicated, are given for the control sensor in comparison to the wild-type sensor at time points relative to cell couple formation. Analysis criteria for control sensor accumulation have been relaxed. Any T cell with control sensor accumulation at the T cell/APC interface >40% above fluorescence background at the cell membrane, not the entire cell, was included in the analysis to illustrate the minimal remaining interface accumulation. Wild-type Cdc42 sensor data are the same as in Fig. 3A. For the control sensor, 32 cell couples from two independent experiments were analyzed. All differences at all time points are significant (p < 0.001, Student’s t test).
FIGURE 3.

Interface accumulation of active Cdc42 is regulated by the TCR and CD28. A, Cdc42 sensor-transduced 5C.C7 T cells were activated by CH27 APCs in the presence of MCC agonist peptide. Accumulation (on the left) and centrality indices (on the right), as indicated, are given at the noted time points relative to the formation of a tight T cell/APC interface. The conditions were 10 μM MCC agonist peptide (full stimulus), 10 μM MCC with 10 μg/ml anti-B7-1 and anti-B7-2 Abs (anti-B7, B7 blockade), a 1/100 dilution of MCC into the null peptide MCC D93E/K99T/T102S (10 μM total concentration) (0.1 μM MCC, low agonist peptide), a combination of 0.1 μM MCC, anti-B7, and 10 μg/ml an anti-ICAM Ab (limiting), and 10 μM MCC with ⅓ μM WASP GBD or with 100/350 nM Cdc42dn. Twenty-six to 107 cell couples (on average 48) from at least three independent experiments were analyzed per condition. Only 12 cell couples could be analyzed under limiting conditions, because T cell activation was rare. Cdc42 sensor data with a full T cell stimulus are the same as in Fig. 2B. B, The data from A are pooled so that the 0, 20, and 40 s time points are listed as 1 min, and the 60, 80, and 100 s time points are listed as 2 min. p values (Student’s t test) vs 10 μM MCC are given at the right of each panel. n.s. indicates p > 0.05.
To establish specificity of the Cdc42 sensor, we generated a control sensor with 100-fold reduced affinity for Cdc42/GTP (A. Seth and M. K. Rosen, unpublished data) by making three-point mutations in the WASP GBD, F244D, H246D, and H249D. In T cells before APC contact, the vast majority of the control sensor was localized in the vicinity of the MTOC (Fig. 2A), as is the majority of endogenous Cdc42 (8). This contrasts with the predominant plasma membrane localization of the wild-type sensor. This disparate localization of the wild-type and control sensors before T cell activation suggests that wild-type sensor localization is dominated by binding of its GBD to a constitutive pool of active Cdc42 at the cell membrane. In response to a full stimulus (CH27 APCs with 10 μM MCC peptide), the control sensor accumulated at the T cell/APC interface only slightly above cellular background (Fig. 2A). The accumulation and centrality indices at all individual time points analyzed (Fig. 2B) were <9.5 and 22% of those of the wild-type sensor (p < 0.001), respectively. In no case was control sensor interface accumulation more intense than the internal accumulation in the vicinity of the MTOC. Such minimal control sensor accumulation is consistent with the residual affinity of the mutated WASP GBD for active Cdc42. The distinct behaviors of the wild-type and control sensors before and after T cell/APC couple formation thus indicate that the former reports specifically on active Cdc42. As a further control, we used a purified GBD-GFP fusion protein to stain fixed cell couples. Active Cdc42 accumulated in the same patterns as seen with the live-cell biosensor (Fig. 1B), confirming our live cell data and previous data (8, 25). Furthermore, we tested whether the Cdc42 sensor interfered with T cell activation at the expression level achieved by retroviral transduction. As assayed by IL-2 secretion, it did not (Fig. 1C). In summary, we designed a live-cell imaging sensor for Cdc42 that specifically reports on active Cdc42 without interfering with T cell activation upon its retroviral expression in primary T cells. We found that active Cdc42 accumulates at the T cell/APC interface preferentially immediately after its formation and preferentially at its center.
Experimental strategy
Our working hypothesis for the following investigation of the role of Cdc42 in T cell activation is that specific spatial and temporal patterns of Cdc42 activity control distinct elements of T cell activation. As an ideal test for our hypothesis, we would block one specific spatial pattern of Cdc42 activity at a specific time while leaving all other spatiotemporal patterns undisturbed and assess the consequences for T cell activation. For example, one might desire to ablate Cdc42 activity at the center of the T cell/APC interface immediately after cell couple formation but somehow enable Cdc42 to remain active at the periphery of the interface during that time and in all locations thereafter. However, such precise perturbations are currently not feasible. As an alternative, we sought to test our hypothesis by making multiple perturbations of Cdc42 activity. Some would affect some spatiotemporal patterns of Cdc42 activity more than others. We can then apply the same perturbations to various elements of T cell activation. A collection of such perturbations could then be used to discover significant correlations between changes in specific spatiotemporal patterns of Cdc42 activity and distinct elements of T cell activation, a first step to causality.
In the next three sections, we will introduce the perturbations of Cdc42 activity and quantify their effects on the spatiotemporal patterns of Cdc42 activity (Figs. 3-5). In the subsequent four sections, we will quantify how central elements of T cell activation are affected by these perturbations (Figs. 6-9). This will both define the role of Cdc42 in regulating T cell polarization/activation and allow the discovery of quantitative relations between spatiotemporal patterns of Cdc42 activity and elements of T cell activation, as discussed in the last section (Fig. 10).
FIGURE 5.
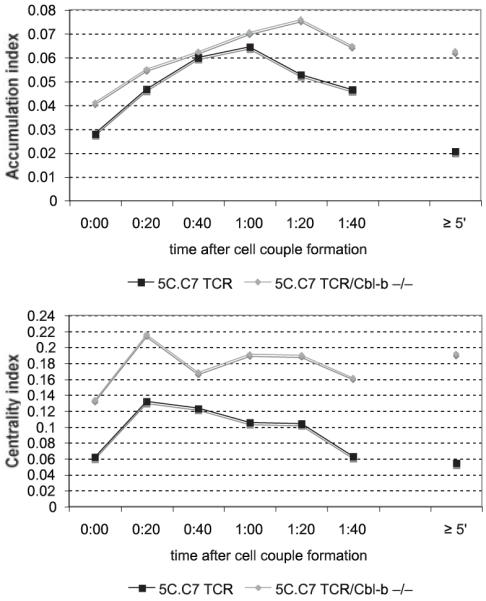
Cbl-b-deficiency enhances sustained Cdc42 activity. Cdc42 sensor-transduced T cells from Cbl-b-deficient 5C.C7 TCR transgenic mice and 5C.C7 control littermates were activated by CH27 APCs incubated with 10 μM MCC (full stimulus). Accumulation (top) and centrality (bottom) indices of are given as in Fig. 3A. Thirty-one and 28 cell couples, respectively, from at least two independent experiments were analyzed. Differences between Cbl-b-deficient and wild-type cells are significant (p < 0.05, Student’s t test) at 0:00 and ≥1:20 for the accumulation index and ≥1:00 for the centrality index, respectively.
FIGURE 6.

Cdc42 is less involved in the regulation of cell couple formation and MTOC reorientation. A, The percentage of 5C.C7 T cells forming cell couples upon contact with CH27 APCs in the presence of 10 μM MCC (full stimulus) is plotted under the indicated conditions. Averages from ≥2 independent experiments with SDs are given. *, Denotes statistical significance with p < 0.05. B, 5C.C7 T cells were activated by CH27 APCs and 10 μM MCC agonist peptide. The average interface diameter, as measured in DIC bright field images, for the indicated experimental conditions is plotted over time. Differences are not significant with the exception of the 0:00 time point, where the interface is significantly (0.02 < p < 0.05) smaller in the presence of 100 nM Cdc42, 1 μM WASP GBD, and 3 μM WASP GBD. C, Tubulin-GFP-transduced 5C.C7 T cells were activated by CH27 APCs and 10 μM MCC agonist peptide. The percentage of the total distance that the MTOC has traveled after cell couple formation from its initial position behind the nucleus to the center of the interface is plotted under the indicated conditions. On average, 22 cell couples from ≥2 independent experiments were analyzed per condition.
FIGURE 9.

Cdc42 regulates early actin accumulation. A, Actin-GFP-transduced 5C.C7 T cells were activated by CH27 APCs and 10 μM MCC agonist peptide (full stimulus). The percentage of T cells showing actin spreading within 100 s of cell couple formation, referred to as lamellopodial actin accumulation, is given under the conditions indicated with SEs. An asterisk indicates a significant (p = 0.001) difference in the percentage of cell couples vs buffer only (two-sample proportions z test). Twenty-four to 65 cell couples (on average 36) from at least two independent experiments were analyzed per condition. B, Early actin spreading in the presence of Cdc42ca is shown under the indicated conditions similar to A. Anti-B7 indicates 10 μg/ml anti-B7-1 and anti-B7-2 Abs. Twenty-three to 74 cell couples (on average 38) from at least two independent experiments were analyzed per condition. */**, Indicate a significant (p < 0.05/0.001, respectively) difference vs 10 μM MCC (two-sample proportions z test). Twenty-six to 69 cell couples (on average 44) from at least two independent experiments were analyzed per condition.
For our analysis of Cdc42 activity, we will distinguish two spatial and two temporal patterns. We will address whether Cdc42 is active over the entire T cell/APC interface or selectively at its center. The clustering of various receptors and signaling intermediates at the center of the T cell/APC interface has identified it as a region of special interest. We will analyze Cdc42 activity within the first and the second minute after tight cell couple formation. Within the first minute, distinct and dramatic morphologically changes occur, T cell actin spreads toward the edges of the interface (16), the uropod retracts (26), and a deep invagination forms at the center of the interface (K. Singleton, N. Parvaze, K. R. Dama, K. S. Chen, P. Jennings, B. Purtic, M. D. Sjaastad, C. Gilpin, M. M. Davis, and C. Wülfing, submitted for publication). In the subsequent ~4 min, proximal T cell signaling peaks. Our analysis of Cdc42 activity within the second minute after cell couple formation is meant to represent this phase. Subsequently, proximal T cell signaling declines while transcriptional regulation starts. Although Cdc42 activity within this third phase is still of interest, it is too small to be analyzable at the single cell level (Fig. 3).
Perturbing Cdc42: TCR and CD28 are required for Cdc42 activation
To understand the physiological regulation of Cdc42 activity, we studied decreased engagement of the TCR and CD28. In 5C.C7 T cells, TCR and CD28 both play critical roles in T cell polarization by regulating actin dynamics and TCR localization (15, 16). We decreased the strength of the signal through the TCR and CD28 by reducing the MCC agonist peptide concentration 100-fold to 0.1 μM (low agonist peptide), leading to a minimal TCR signal (18), and through blocking the CD28 ligands B7-1 and B7-2 (B7 blockade), respectively. Reducing the agonist peptide concentration significantly diminished the accumulation and centrality indices of active Cdc42 over the first minute after cell couple formation by 19% (p = 0.01) and 35% (p = 0.01), respectively (Fig. 3B). Over the second minute, the reductions in accumulation and centrality indices were even larger (31 and 51%, respectively; p < 0.001). B7 blockade did not affect the localization of active Cdc42 in the first minute but significantly diminished accumulation and centrality indices over the second minute by 36% (p < 0.001) and 31% (p = 0.05) (Fig. 3B). Blocking B7 and the LFA-1 ligand ICAM-1 in combination with 0.1 μM MCC agonist peptide (limiting) dramatically reduced accumulation of active Cdc42 at the T cell/APC interface within the first and second minute after cell couple formation (>60% reductions in the accumulation and >80% reductions in the centrality indices; p < 0.001), suggesting synergy between the TCR and costimulatory ligands. However, because the frequency of cell couple formation was also diminished (I. Tskvitaria-Fuller and C. Wülfing, data not shown), these data should be compared cautiously to the blockade of individual receptors. To avoid such complications, our subsequent investigations are limited to conditions of undisturbed cell couple formation.
To further validate the live-cell Cdc42 sensor and to corroborate regulation of Cdc42 activity by TCR and CD28, we examined the amount of active Cdc42 biochemically. We precipitated active Cdc42 from cell extracts with the GBD of the p21-activated kinase and quantified its amounts by Western blotting (Fig. 4). T cell activation by APC resulted in a prohibitive background of Cdc42 activity in the cell extracts. T cells were therefore activated with Abs. We used 10 μg/ml anti-CD3 plus 10 μg/ml anti-CD28 as a full stimulus, 10 μg/ml anti-CD3 in the absence of anti-CD28 to assess the role of CD28, and a 100-fold reduced concentration of anti-CD3 Abs, i.e., 0.1 μg/ml, in combination with 10 μg/ml anti-CD28 to assess TCR signaling. Similar to the live-cell sensor data, Cdc42 activation depended on both the TCR and CD28 (Fig. 4B). Absence of CD28 engagement reduced the amount of precipitated Cdc42 to 51 ± 25% of a full stimulus, a reduced TCR signal to 32 ± 22% (Fig. 4B).
FIGURE 4.

A biochemical determination of Cdc42 activity matches the imaging data. Cdc42 GTP was precipitated from 5C.C7 T cell extracts with the PAK GBD and quantified by Western blotting. In A, a representative blot is shown. Numbers below each band indicate experimental conditions, as listed on the right. Numbers above each band indicate measured band intensity. In B, the quantization of all experiments is given as the average amount of precipitated Cdc42 GTP ± SD relative to a full stimulus. The T cell activation conditions were as follows: 10 μg/ml anti-TCR plus 10 μg/ml anti-CD28 (full stimulus), 10 μg/ml anti-TCR only, 0.1 μg/ml anti-TCR plus 10 μg/ml anti-CD28 (low anti-TCR), 10 μg/ml anti-TCR plus 10 μg/ml anti-CD28 plus 100 nM Cdc42dn, and Cbl-b-deficient 5C.C7 T cells and littermate control wild-type 5C.C7 T cells with 10 μg/ml anti-TCR plus 10 μg/ml anti-CD28. Independent experiments (≥2) were performed per condition.
Perturbing Cdc42: Cbl-b suppresses sustained Cdc42 activation
Cbl-b is a negative regulator of the guanine nucleotide exchange factor (GEF) Vav (27, 28), an activator of Cdc42. To investigate the role of Cbl-b in the activation of Cdc42, we transduced primary T cells derived from Cbl-b-deficient, 5C.C7 TCR transgenic mice (14) with the Cdc42 sensor and activated them with a full stimulus (CH27 APCs plus 10 μM MCC peptide). In comparison to littermate controls, over the first minute after cell couple formation, the average Cdc42 centrality index was increased by 28% (p < 0.01). Over the second minute, both centrality and accumulation indices were enhanced by 97 and 59%, respectively (p < 0.001) (Fig. 5). At longer times (≥5 min) after cell couple formation, the Cdc42 centrality and accumulation indices were increased even more by 150 and 168% (p < 0.01), respectively. For reasons that could not be elucidated, 5C.C7 T cells that were obtained as littermate controls for the Cbl-b-deficient T cells showed less Cdc42 accumulation than those that were used for all other studies (compare Figs. 3A and 5). Interestingly, biochemical Cdc42.GTP pull-down data showed only a moderate increase (22% at 5 min after T cell activation) in overall Cdc42 activity in Cbl-b-deficient T cells (Fig. 4B). The more dramatic enhancement of local Cdc42 activity, as measured with the Cdc42 biosensor, vs global Cdc42 activity, as measured biochemically, suggests that Cbl-b predominantly suppresses the localized activation of Cdc42 at the T cell/APC interface. Cbl-b thus is a negative regulator of sustained activation of Cdc42 at the T cell/APC interface.
Perturbing Cdc42: direct manipulation of Cdc42 activity
To causally determine roles of Cdc42 in T cell polarization and activation, we needed to manipulate its activity directly. We had to take into account that Cdc42 is essential for cell survival (10, 11). Manipulation of Cdc42 activity thus should be short-term and as moderate as minimally required. Furthermore, to account for limitations in the specificity of individual reagents, multiple reagents with independent mechanisms of action were desirable. Here we used three reagents. To interfere with Cdc42 function, we used the dominant-negative (dn) N17 mutant of Cdc42 and the WASP GBD. As specificity controls for Cdc42dn, we used N17 Rac1 and N19 RhoA (17). To enhance Cdc42 function, we used the V12 ca mutant (17). Cdc42dn and the control reagents Rac1dn and RhoAdn function by blocking access of endogenous GTPases to GEFs (29). Because it is likely that Cdc42 and Rac1 share GEFs, some overlap between the effects of Cdc42dn and Rac1dn is expected. We found only moderate overlap, as described in another manuscript (I. Tskvitaria-Fuller, N. Mistry, and C. Wülfing, manuscript in preparation). The WASP GBD uses a mechanism of action that is distinct from Cdc42dn. It competes with endogenous effectors for access to active Cdc42. Cdc42ca provides increased levels of Cdc42 activity, because it is locked in the GTP-bound state. The localization of this activity is independent of the localization of Cdc42 GEFs. It is likely the same as the overall Cdc42 distribution. Cdc42ca thus likely provides increased Cdc42 activity more globally throughout the cell than activation of endogenous Cdc42 by receptor engagement.
As used, none of these reagents affected the frequency of cell couple formation and interface diameters (Fig. 6). All three reagents were introduced into cells by protein transduction, where addition of a 10-aa peptide from the HIV tat protein confers membrane-permeability (12). Fusion proteins were produced in E. coli. They were taken up by 100% of T cells within ≤30 min (data not shown). Taking advantage of the quantitative nature of protein transduction, we performed dose responses to determine the minimal reagent concentrations to achieve a saturated blockade of Cdc42 activity, as described in detail in another manuscript (I. Tskvitaria-Fuller, N, Mistry, and C. Wülfing, manuscript in preparation). Briefly, 100 nM and 350 nM Cdc42dn yielded indistinguishable phenotypes in blocking Cdc42 activation, as assayed by interface accumulation of the Cdc42 sensor. To allow a larger data set in the description of the effect of Cdc42dn on Cdc42 activation, these data were therefore pooled. For the analysis of the effect of Cdc42dn on various elements of T cell polarization, only the minimal concentration that showed saturated interference with Cdc42 sensor localization, i.e., 100 nM, was used to maximize specificity. Similarly, 1 and 3 μM WASP GBD yielded indistinguishable interference with Cdc42 sensor accumulation, allowing data pooling to describe the effect of WASP GBD on Cdc42 activation. However, because 3 μM was more potent than 1 μM WASP GBD in other assays, the higher concentration was used for the analysis of the effect of WASP GBD on various elements of T cell polarization.
To assess the spatiotemporal patterns of Cdc42 activity upon direct manipulation of its activity, we determined them in the presence of Cdc42dn and WASP GBD. In the presence of the full stimulus (CH27 APC plus 10 μM MCC peptide), both inhibitors blocked sensor recruitment to T cell/APC interface. 100/350 nM Cdc42dn reduced the accumulation index over the first and second minute after cell couple formation by 16% (p = 0.01) and 15% (p = 0.01), the centrality index by 24% (p = 0.02) and 17% (not significant), respectively (Fig. 3B). A total of ⅓ μM WASP GBD did not affect the accumulation index. It reduced the centrality index by 29% (p < 0.001) and 22% (p < 0.05) (Fig. 3B). Direct interference with Cdc42 activity using Cdc42dn and WASP GBD thus left substantial residual Cdc42 activity at the interface. However, so did B7 blockade and a low agonist peptide concentration (Fig. 3). In fact, the magnitude of the Cdc42dn/WASP GBD effects was comparable to those of reducing TCR ligand density or blocking CD28 engagement (Fig. 3). To explain this shared residual Cdc42 activity, we suggest that a substantial minimal level of Cdc42 activity is required to allow efficient cell couple formation. Lower levels of Cdc42 activity would not be detectable in T cell/APC couples, because they interfered with cell couple formation. This suggestion is supported by the observation that both limiting T cell stimulation (data not shown) and increased doses of Cdc42dn (Fig. 6A) interfered with cell couple formation. The observation that Cdc42 activity at the interface was reduced to comparable levels upon addition of Cdc42dn/WASP GBD and upon physiological reduction of the T cell stimulus establishes that Cdc42dn and WASP GBD reduce Cdc42 activity to close to the minimal level compatible with efficient cell couple formation. We call such interference “physiologically saturating” and will apply a similar analysis to the magnitude of the effects of Cdc42dn/WASP GBD on various elements of T cell polarization/activation below. To corroborate that direct interference with Cdc42 activation by 100 nM Cdc42dn was comparable to reduced TCR or CD28 engagement, we performed biochemical Cdc42.GTP pull-down assays. Adding 100 nM Cdc42dn to a full stimulus reduced Cdc42 GTP loading to 54 ± 28%, comparable to lack of CD28 engagement (51 ± 25%) or a reduced TCR stimulus (32 ± 21%) (Fig. 4B).
In summary, we have established three independent, quantitative reagents to manipulate Cdc42 activity in live primary T cells, Cdc42dn, WASP GBD, and Cdc42ca. Because of their distinct mechanisms of action, effects seen with a majority of the three reagents can confidently be assigned to Cdc42. In addition, we have quantified the effects of the inhibitory reagents on the accumulation of the Cdc42 sensor at the T cell/APC interface and compared these effects to those of a reduced TCR signal and costimulation blockade. This comparison established concentrations of Cdc42dn and WASP GBD that are physiologically saturating with respect to interference with Cdc42 activity. Using these concentrations, we will determine the role of Cdc42 in T cell polarization and activation in the next three sections. In addition, we have now completed the analysis of the spatiotemporal patterns of Cdc42 activity under various perturbations, as required for the final analysis of relations between patterns of Cdc42 activity and elements of T cell activation.
Cdc42-dependent elements of T cell activation: sustained actin accumulation
Actin dynamics mediate T cell polarization. Sustained actin accumulation at the T cell/APC interface (≥5 s after interface formation) is an important part of these dynamics (16). We assayed it using actin-GFP (16). For a more rigorous quantitative analysis of sustained actin accumulation, we defined an actin accumulation index analogous to the Cdc42 sensor accumulation index. We first assessed the sensitivity of sustained actin accumulation to direct interference with Cdc42 activity. In the presence of a full T cell stimulus (CH27 APC with 10 μM MCC peptide), 100 nM Cdc42dn significantly reduced the actin accumulation index by 54% (p < 0.001), and 3 μM WASP GBD reduced it by 32% (p < 0.001) (Fig. 7). The extent of these reductions was half to two-thirds of those seen with the low agonist peptide concentration (0.1 μM MCC) (72% reduction; p < 0.001) or B7 blockade (74% reduction; p < 0.001). The comparable reductions in sustained actin accumulation upon addition of Cdc42dn/WASP GBD vs reduced TCR or CD28 engagement establish near physiological saturation of the effects of Cdc42dn/WASP GBD. This suggests that Cdc42 is a critical regulator of sustained actin accumulation. One hundred nanomolar Rac1dn (29% reduction; p < 0.01) or 100 nM RhoAdn (4% reduction, not significant) showed significantly smaller reductions of the actin accumulation index than 100 nM Cdc42dn (p < 0.05 vs 100 nM Cdc42dn), establishing some specificity among these three Rho GTPases.
FIGURE 7.

Cdc42 regulates sustained actin accumulation. Actin-GFP-transduced 5C.C7 T cells were activated by CH27 APCs and MCC agonist peptide. The actin accumulation index for sustained (≥5 min after cell couple formation) actin accumulation is given under the conditions indicated. Anti-B7 indicates 10 μg/ml anti-B7-1 and anti-B7-2 Abs. */**, Indicate statistical significance vs 10 μM MCC with p < 0.01/0.001, respectively. †/††, Indicate statistical significance with p < 0.01/0.001 vs 0.1 μM MCC or 10 μM MCC/anti-B7, respectively (Student’s t test). Twenty to 74 cell couples (on average 35) from at least two independent experiments were analyzed per condition.
Next, we investigated whether additional Cdc42 activity could enhance sustained actin accumulation. Addition of 1 μM Cdc42ca to a full T cell stimulus did not increase the actin accumulation index but significantly decreased it by 27% (p = 0.001) (Fig. 7). To account for this reduction, we suggest that Cdc42-mediated enhancement of actin accumulation was already maximal at the full T cell stimulus. Further active Cdc42, in particular dispersed throughout the cell as for Cdc42ca, would then compete for Cdc42 effectors, reducing localized actin accumulation at the interface. However, in contrast to the inhibitory effect at a full T cell stimulus, Cdc42ca completely and in a dose-dependent manner restored sustained actin accumulation that was depressed in the presence of suboptimal stimuli (reduced TCR or CD28 engagement) (Fig. 7). To gain insight into how Cdc42 regulates sustained actin dynamics, we used mutants of Cdc42ca deficient in the interaction with Cdc42/Rac-interactive binding domain-containing effectors, such as WASP and Pak (Y40C) (30), deficient in the interaction with RhoGDI (R66A) (31), and with phospholipase D (S124A) (32). The Y40C mutation moderately and the S124A mutation significantly (p = 0.002) inhibited the ability of 1 μM Cdc42ca to restore sustained actin accumulation during B7 blockade (Fig. 7). This suggests a potentially complex mechanism of Cdc42ca regulation of actin dynamics involving multiple, at least partially redundant effectors. In summary, Cdc42 was required for sustained actin accumulation at the T cell/APC interface, consistent with prior data (9). Its ca mutant could fully compensate for reduced TCR and CD28 signals.
Cdc42-dependent elements of T cell activation: central TCR clustering
Another critical element of T cell polarization is the clustering of receptors, among them the TCR and CD28, at the center of the T cell/APC interface. In 5C.C7 T cells such clustering is required for efficient IL-2 secretion (18). We therefore assessed the sensitivity of central TCR accumulation to interference with Cdc42 activity. In the presence of a full T cell stimulus (A20/I-Ek-GFP APC with10 μM MCC peptide), 100 nM Cdc42dn and 3 μM WASP GBD significantly (p < 0.005) interfered with central TCR clustering (Fig. 8A). Only 28 and 22% of treated T cell/APC couples, respectively, clustered the TCR at the center of the T cell/APC interface, as opposed to 68% upon addition of buffer only. Similar reductions in central TCR accumulation were observed upon reduced TCR or CD28 engagement (low agonist peptide or B7 blockade) (15). This physiological saturation of the effect of direct interference with Cdc42 suggests that Cdc42 is a critical regulator of central TCR clustering.
FIGURE 8.
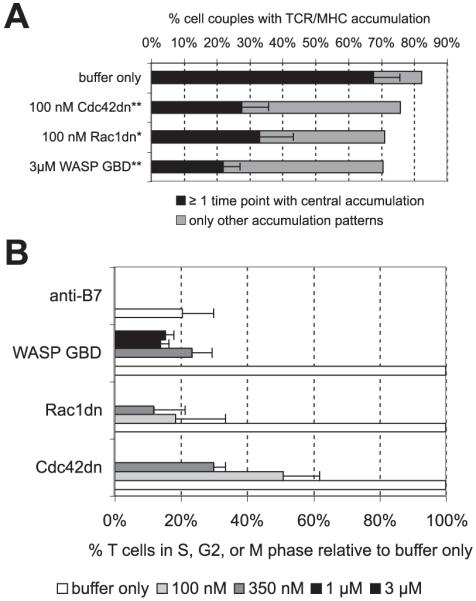
Cdc42 is required for central TCR accumulation and contributes to cell cycle entry. A, 5C.C7 T cells were activated with I-Ek-GFP-transfected A20 APCs and 10 μM MCC agonist peptide (full stimulus). The percentage of cell couples with central accumulation of TCR/MHC at at least one of four time points analyzed (1, 3, 5, and 7 min) (with SEs) or with only other patterns is given under the indicated conditions. */**, Indicate a significant (p < 0.05/0.005) difference in the percentage of cell couples showing central TCR/MHC accumulation vs buffer only (two-sample proportions z test). Twenty-one to 68 cell couples (on average 39) from at least three independent experiments were analyzed per condition. B, 5C.C7 T cells were activated by CH27 APCs and 10 μM MCC agonist peptide. The percentage of 5C.C7 T cells in cell cycle under the indicated conditions is given relative to the percentage at buffer only. Concentrations of added reagents are listed separately at the bottom. Anti-B7 indicates 10 μg/ml anti-B7-1 and anti-B7-2 Abs. Averages from ≥2 independent experiments with SDs are given.
Cdc42-dependent elements of T cell activation: cell cycle entry and IL-2 production
Next, we investigated the role of Cdc42 in T cell cycle entry. T cell cycle entry has previously been shown to depend on sustained actin accumulation (16). Both Cdc42dn and WASP GBD blocked entry of 5C.C7 T cells into the cell cycle, as determined by Hoechst staining (Fig. 8B). In the presence of a full T cell stimulus (CH27 APC with 10 μM MCC peptide), 100 nM Cdc42dn reduced the percentage of T cells in the cell cycle to 51 ± 11% of buffer only, 3 μM WASP GBD to 16 ± 3%, comparable to a B7 blockade (reduction to 21 ± 10%). In parallel, 3 μM WASP GBD reduced the percentage of T cells secreting IL-2 to 71 ± 5% of buffer only, comparable with a B7 blockade (59 ± 20% of control). Next, we asked whether additional active Cdc42 could enhance IL-2 secretion. Addition of 1 μM Cdc42ca did not change IL-2 secretion in the presence of a full T cell stimulus and could not compensate for reduced IL-2 secretion during B7 blockade (data not shown). This suggests a more limited involvement of Cdc42 in the regulation of IL-2 secretion as opposed to sustained actin accumulation. In summary, Cdc42 was required for cell cycle entry and contributed to IL-2 production.
Cdc42-dependent elements of T cell activation: early actin accumulation
Within the first minute of T cell/APC couple formation, actin spreads to the edges of the interface (16). The concomitant clearing of actin at the center of the interface is likely related to a specific T cell invagination event at the center at the T cell/APC interface that we speculate serves to reset the T cell signaling machinery (K. Singleton, N. Parvaze, K. R. Dama, K. S. Chen, P. Jennings, B. Purtic, M. D. Sjaastad, C. Gilpin, M. M. Davis, and C. Wülfing, submitted for publication). We therefore assessed the sensitivity of early actin spreading to direct interference with Cdc42 activity. In the presence of a full T cell stimulus (CH27 APC with 10 μM MCC peptide), 100 nM Cdc42dn significantly (p = 0.001) reduced the percentage of cell couples showing early actin spreading from 74 to 36% (Fig. 9A). A total of 3 μM WASP GBD reduced the percentage moderately to 49% of cell couples. One hundred nanomolar Rac1dn and 100 nM RhoAdn allowed early actin spreading to occur in 64 and 63% of the cell couples, respectively (Fig. 9A), thus interfering significantly less than 100 nM Cdc42dn (p < 0.05 vs 100 nM Cdc42dn). These data establish Cdc42 as a specific regulator of early actin spreading. The reductions in early actin spreading by Cdc42dn/WASP GBD are comparable to those achieved by reductions in TCR signal strength (47% of cell couples with early actin spreading at 0.1 μM MCC; Fig. 9B). This physiological saturation of the effect of direct interference with Cdc42 suggests that Cdc42 is a critical regulator of early actin spreading.
Next, we asked whether additional active Cdc42 could enhance early actin spreading. Similar to the regulation of sustained actin dynamics, addition of 1 μM Cdc42ca to a full T cell stimulus reduced the percentage of T cell/APC couples with early actin spreading to 60% (p = 0.01) (Fig. 9B). However, in contrast to the effect on sustained actin accumulation, Cdc42ca could not restore diminished early actin spreading in the presence of reduced TCR engagement. At 0.1 μM MCC, 47% of the cell couples displayed early actin spreading, in the additional presence of 100 nM to 1 μM Cdc42 30–40% (Fig. 9B). In summary, Cdc42 was required for early actin spreading. However, in contrast to the regulation of sustained actin accumulation, a ca mutant of Cdc42 could not compensate for a reduced TCR signal.
Cdc42-dependent elements of T cell activation: cell couple formation and MTOC reorientation
We have established that Cdc42 is a central regulator of T cell actin dynamics. Reagents to interfere with Cdc42 activity thus might impede T cell couple formation. However, in the presence of a full T cell stimulus (CH27 APC with 10 μM MCC peptide), 100 nM Cdc42dn or 3 μM WASP GBD did not affect the frequency of T cell/APC couple formation, nor interface diameters (Fig. 6). Only upon addition of 1 μM Cdc42dn, the percentage of T cells in contact with an APC that form a tight cell couple was significantly (p < 0.05) reduced from 61% with buffer only to 27% (Fig. 6A).
The reorientation of the MTOC toward the T cell/APC interface is a critical element of T cell polarization. Cdc42 has been suggested to be required for it (9). However, we found only small effects of Cdc42dn on MTOC reorientation only at high concentrations. Cdc42dn did not significantly (p > 0.05) disturb the eventual localization of the MTOC behind the center of the interface. With a score of 1 indicating MTOC localization at the interface, 3 at the opposite side of the T cell, the final average MTOC position in the presence of a full T cell stimulus (CH27 APC with 10 μM MCC peptide) and 100 nM, 350 nM, and 1 μM Cdc42dn was 1.18, 1.23, and 1.33, as opposed to 1.02 upon addition of buffer only. However, Cdc42dn slowed MTOC reorientation moderately. Although at a full T cell stimulus, 80% of the MTOC translocation was complete within 80 s of cell couple formation, this percentage dropped to 20% upon addition of ≥350 nM Cdc42dn (Fig. 6C). For comparison, even under limiting T cell activation conditions, 50% of the MTOC reorientation was complete after 80 s (16).
In summary, interference with Cdc42 activation only moderately impeded cell couple formation and MTOC reorientation only at high concentrations of Cdc42dn. This is in sharp contrast to the sensitivity of actin dynamics and central TCR accumulation to interference with Cdc42. These data suggest that actin dynamics and central TCR accumulation, but not MTOC reorientation and cell coupling, are primary targets of Cdc42. Our final analysis of the relations between specific spatiotemporal patterns of Cdc42 activity with distinct elements of T cell polarization will therefore not include cell couple formation and MTOC reorientation.
Specific patterns of Cdc42 activity relate to distinct elements of T cell polarization
In the preceding sections, we have, first, quantified spatiotemporal patterns of Cdc42 activity and, second, elements of T cell activation that are dependent on Cdc42 under the same set of perturbations. These data provide an opportunity to relate patterns of Cdc42 activity to elements of T cell activation. Specific regulation of a particular element of T cell activation by a distinct pattern of Cdc42 activity should be evident in a tight correlation through the perturbations. We used five T cell activation conditions with varying degrees of Cdc42 activity, a full stimulus, B7 blockade, low agonist peptide, Cdc42dn, and WASP GBD. We used four patterns of Cdc42 accumulation, accumulation and centrality indices over the first and second minute after cell couple formation (Fig. 3). We used five Cdc42-dependent elements of T cell activation, sustained actin accumulation (Fig. 7), central TCR clustering (Fig. 8A), T cell cycle entry (Fig. 8B), IL-2 production (text), and early actin spreading (Fig. 9). To examine relations between these patterns of Cdc42 accumulation and these elements of T cell activation, we pair-wise plotted each of the four measures of Cdc42 accumulation against each of the five elements of T cell activation under the five T cell activation conditions (an example is shown in Fig. 10A). These 20 plots generated two types of information. The slopes of the regression curves measure how strongly changes in a particular Cdc42 pattern are related to a distinct element of T cell activation (Fig. 10B). Large slopes, i.e., strong relations, indicate that the respective element of T cell activation is sensitive to the corresponding spatiotemporal pattern of Cdc42 activity. In addition, correlation coefficients with their SEs measure the reliability of a relation (Fig. 10C). As an important indication of the internal consistency of our data, whenever a distinct pattern of Cdc42 activity was strongly related to an element of T cell activation (as identified through the largest slopes; Fig. 10B) the two correlation partners were also most reliably related (as identified through the largest correlation coefficients; Fig. 10C).
This analysis established that specific patterns of Cdc42 activity were linked to distinct elements of T cell activation. Specifically, sustained actin accumulation was most closely related to the Cdc42 accumulation and centrality indices over the second minute after T cell/APC couple formation (r2 = 0.78 ± 0.01 for the accumulation index, r2 = 0.81 ± 0.01 for the centrality index). Early actin spreading was most closely related to the Cdc42 centrality index over the first minute after cell couple formation (r2 = 0.76 ± 0.08). Central TCR accumulation was consistently related to the Cdc42 centrality index (r2 = 0.53 ± 0.07 for the centrality index at 1 min, r2 = 0.51 ± 0.07 for the centrality index at 2 min). T cell cycle entry was most closely related to the Cdc42 centrality index at 2 min (r2 = 0.58 ± 0.02). No pattern was strongly related to IL-2 secretion, consistent with the comparatively smaller effects of direct manipulation of Cdc42 activity. In general, changes in Cdc42 centrality rather than accumulation were related to particularly large changes in T cell activation, suggesting that Cdc42 activity at the center of the T cell/APC is its most important pattern.
Discussion
In this study, we have addressed the role of Cdc42 in T cell activation. Previous work using transfection of Cdc42dn into T cell hybridoma cells suggested that Cdc42 is required for actin accumulation at the T cell/APC interface and reorientation of the MTOC toward it (9). We largely confirm these findings here. However, MTOC reorientation was substantially less sensitive to interference with Cdc42 activation in our study. We found only moderately slowed but no blocked MTOC reorientation. We suggest that considering the nature of the T cells used can reconcile the data. With primary T cells in the presence of a high concentration of Cdc42dn (1 μM), MTOC reorientation was slowed and cell couple formation was reduced (Fig. 6). This suggests that a primary T cell, rather than forming a cell couple with grossly defective polarization, does not form a cell couple at all. A relaxed requirement for cell couple formation of the 2B4 hybridoma cells likely allows the observation not only of slowed but also of blocked MTOC reorientation. Other than this study, an important role for Cdc42 in the regulation of T cell activation was deduced by studying its activators, in particular Vav, and its effectors, in particular WASP. The function of the Rho family GEF Vav (as recently reviewed in Ref. 33) was mostly analyzed using Vav-deficient mice. Clear defects in cytoskeletal regulation emerged: integrin-mediated T cell spreading was impaired; actin recruitment in capping experiments was less efficient, Cdc42 activation in the SLP-76/WASP/Vav complex was reduced; MTOC reorientation and TCR clustering might be diminished (33). However, Vav is a multifunctional protein, and it is not clear whether such defects in cytoskeletal regulation are caused through diminished Cdc42 activation or through reductions in calcium signaling, dynamin 2 activation, or ezrin/radixin/moesin protein dephosphorylation (33). A principal function of the Cdc42 effector WASP (as reviewed in Ref. 34) is its ability to directly activate the Arp2/3 complex through its C-terminal verprolin, cofilin homology, acidic domain. Similar to Vav-deficient cells, WASP-deficient T cells show reduced actin recruitment in capping experiments (35). The segregation of talin and protein kinase C-θ in the immunological synapse was less efficient at reduced agonist peptide concentrations (6). However, it is unclear how much of T cell actin regulation is mediated by WASP, because recently described T cells deficient in the WASP homologue WAVE2 have more drastic phenotypes (36, 37). From a methodological point of view, it is unclear to which extent T cells deficient in Vav or WASP have adapted to these deficiencies by more heavily relying on alternate pathways of cytoskeletal regulation.
Previous data thus provide strong suggestions that Cdc42 should be a critical regulator of T cell polarization/activation. We have confirmed this. However, it was unclear to which extent various elements of T cell activation depend on Cdc42 and how Cdc42 could regulate multiple elements of T cell activation simultaneously. Using quantitative analysis of the effects of interference with Cdc42 activity, we have shown that direct interference with Cdc42 activity was as potent as B7 blockade or only limiting TCR engagement in the regulation of sustained actin accumulation, central TCR clustering, T cell cycle entry, and early actin spreading. This suggests that signaling networks linking the TCR and CD28 to these elements of T cell activation all contain Cdc42 as a non-redundant, central member. Furthermore, in sustained actin accumulation, Cdc42ca could by itself fully compensate for reduced TCR or CD28 engagement. This suggests that Cdc42 is a sufficient member of this particular signaling network. Using quantitative relations between patterns of Cdc42 activity and elements of T cell activation, we provide first support for the hypothesis that Cdc42 can regulate multiple elements of T cell activation simultaneously by selectively using distinct spatiotemporal patterns of its activity. Specifically, the most influential pattern of Cdc42 activity was activation at the center of the T cell/APC interface, as mediated by the TCR and CD28 and inhibited by Cbl-b. Such Cdc42 activity was related to hallmarks of the mature immunological synapse, central TCR accumulation, and sustained actin accumulation, as well as to T cell cycle entry. Together with previous work that has linked sustained actin accumulation and central TCR clustering to T cell cycle entry and IL-2 secretion in the same experimental system (16, 18), these data suggest that Cdc42 might use localized regulation of actin and receptor patterning to affect downstream T cell activation. Cdc42 activity spread over the interface ≥1 s after its formation was related to sustained actin accumulation, too, as possibly required for maintaining a dynamic cellular interface. Central Cdc42 accumulation within 1 s of cell couple formation was also related to actin spreading to the edge of the forming interface with concomitant clearing of the center. We suggest that this allows a specific T cell invagination event that we speculate serves to reset TCR signaling upon interface formation (K. Singleton, N. Parvaze, K. R. Dama, K. S. Chen, P. Jennings, B. Purtic, M. D. Sjaastad, C. Gilpin, M. M. Davis, and C. Wülfing, submitted for publication). We have thus demonstrated that Cdc42 is a critical regulator of multiple elements of T cell polarization and activation. Notably, specific localization at specific times seems most critical in its regulation of multiple structural and functional elements of the immunological synapse.
Supplementary Material
Acknowledgments
We thank L. Hynan (UT Southwestern, Dallas, TX) for statistical advice, H. Qin (Columbia University, New York, NY) for providing Cbl-b-deficient 5C.C7 and matching 5C.C7 lymph node suspensions, A. Mobley (UT Southwestern, Dallas, TX) for high-speed cell sorting; and S. Dowdy (University of California, San Diego, CA) for plasmids for the expression of tat-tagged mutants of Rho GTPases.
Footnotes
This work was supported by grants from the National Institutes of Health (CA90436 to C.W. and GM56322 to M.K.R.) and the Welch Foundation (I-1544 to M.K.R).
- MTOC
- microtubule organizing center
- WASP
- Wiskott-Aldrich syndrome protein
- MCC
- moth cytochrome c
- DIC
- differential interference contrast
- GBD
- GTPase-binding domain
- dn
- dominant negative
- ca
- constitutively active
- GEF
- guanine nucleotide exchange factor
The online version of this article contains supplemental material.
Disclosures
The authors have no financial conflict of interest.
References
- 1.Krogsgaard M, Davis MM. How T cells ‘see’ antigen. Nat. Immunol. 2005;6:239–245. doi: 10.1038/ni1173. [DOI] [PubMed] [Google Scholar]
- 2.Sprent J. Presidential address to the American Association of Immunologists: stimulating naive T cells. J. Immunol. 1999;163:4629–4636. [PubMed] [Google Scholar]
- 3.Kupfer A, Kupfer H. Imaging immune cell interactions and functions: SMACs and the immunological synapse. Semin. Immunol. 2003;15:295–300. doi: 10.1016/j.smim.2003.09.001. [DOI] [PubMed] [Google Scholar]
- 4.Dustin ML. Coordination of T cell activation and migration through formation of the immunological synapse. Ann. NY Acad. Sci. 2003;987:51–59. doi: 10.1111/j.1749-6632.2003.tb06032.x. [DOI] [PubMed] [Google Scholar]
- 5.Krawczyk C, Penninger JM. Molecular motors involved in T cell receptor clusterings. J. Leukocyte Biol. 2001;69:317–330. [PubMed] [Google Scholar]
- 6.Cannon JL, Burkhardt JK. Differential roles for Wiskott-Aldrich syndrome protein in immune synapse formation and IL-2 production. J. Immunol. 2004;173:1658–1662. doi: 10.4049/jimmunol.173.3.1658. [DOI] [PubMed] [Google Scholar]
- 7.McGavin MK, Badour K, Hardy LA, Kubiseski TJ, Zhang J, Siminovitch KA. The intersectin 2 adaptor links Wiskott Aldrich Syndrome protein (WASp)-mediated actin polymerization to T cell antigen receptor endocytosis. J. Exp. Med. 2001;194:1777–1787. doi: 10.1084/jem.194.12.1777. [DOI] [PMC free article] [PubMed] [Google Scholar]
- 8.Cannon JL, Labno CM, Bosco G, Seth A, McGavin MH, Siminovitch KA, Rosen MK, Burkhardt JK. Wasp recruitment to the T cell:APC contact site occurs independently of Cdc42 activation. Immunity. 2001;15:249–259. doi: 10.1016/s1074-7613(01)00178-9. [DOI] [PubMed] [Google Scholar]
- 9.Stowers L, Yelon D, Berg LJ, Chant J. Regulation of the polarization of T cells toward antigen-presenting cells by Ras-related GTPase CDC42. Proc. Natl. Acad. Sci. USA. 1995;92:5027–5031. doi: 10.1073/pnas.92.11.5027. [DOI] [PMC free article] [PubMed] [Google Scholar]
- 10.Chen F, Ma L, Parrini MC, Mao X, Lopez M, Wu C, Marks PW, Davidson L, Kwiatkowski DJ, Kirchhausen T, et al. Cdc42 is required for PIP2-induced actin polymerization and early development but not for cell viability. Curr. Biol. 2000;10:758–765. doi: 10.1016/s0960-9822(00)00571-6. [DOI] [PubMed] [Google Scholar]
- 11.Lin R, Cerione RA, Manor D. Specific contributions of the small GTPases Rho, Rac, and Cdc42 to Dbl transformation. J. Biol. Chem. 1999;274:23633–23641. doi: 10.1074/jbc.274.33.23633. [DOI] [PubMed] [Google Scholar]
- 12.Wadia JS, Dowdy SF. Protein transduction technology. Curr. Opin. Biotechnol. 2002;13:52–56. doi: 10.1016/s0958-1669(02)00284-7. [DOI] [PubMed] [Google Scholar]
- 13.Seder RA, Paul WE, Davis MM, Fazekas de St. Groth. B. The presence of interleukin 4 during in vitro priming determines the lymphokine-producing potential of CD4+ T cells from T cell receptor transgenic mice. J. Exp. Med. 1992;176:1091–1098. doi: 10.1084/jem.176.4.1091. [DOI] [PMC free article] [PubMed] [Google Scholar]
- 14.Naramura M, Kole HK, Hu RJ, Gu H. Altered thymic positive selection and intracellular signals in Cbl-deficient mice. Proc. Natl. Acad. Sci. USA. 1998;95:15547–15552. doi: 10.1073/pnas.95.26.15547. [DOI] [PMC free article] [PubMed] [Google Scholar]
- 15.Wülfing C, Sumen C, Sjaastad MD, Wu LC, Dustin ML, Davis MM. Costimulation and endogenous MHC ligands contribute to T cell recognition. Nat. Immunol. 2002;3:42–47. doi: 10.1038/ni741. [DOI] [PubMed] [Google Scholar]
- 16.Tskvitaria-Fuller I, Rozelle AL, Yin HL, Wulfing C. Regulation of sustained actin dynamics by the TCR and costimulation as a mechanism of receptor localization. J. Immunol. 2003;171:2287–2295. doi: 10.4049/jimmunol.171.5.2287. [DOI] [PubMed] [Google Scholar]
- 17.Soga N, Namba N, McAllister S, Cornelius L, Teitelbaum SL, Dowdy SF, Kawamura J, Hruska KA. Rho family GTPases regulate VEGFstimulated endothelial cell motility. Exp. Cell Res. 2001;269:73–87. doi: 10.1006/excr.2001.5295. [DOI] [PubMed] [Google Scholar]
- 18.Purtic B, Pitcher LA, van Oers NS, Wülfing C. T cell receptor (TCR) clustering in the immunological synapse integrates TCR and costimulatory signaling in selected T cells. Proc. Natl. Acad. Sci. USA. 2005;102:2904–2909. doi: 10.1073/pnas.0406867102. [DOI] [PMC free article] [PubMed] [Google Scholar]
- 19.Abdul-Manan N, Aghazadeh B, Liu GA, Majumdar A, Ouerfelli O, Siminovitch KA, Rosen MK. Structure of Cdc42 in complex with the GTPase-binding domain of the “Wiskott-Aldrich syndrome” protein. Nature. 1999;399:379–383. doi: 10.1038/20726. [DOI] [PubMed] [Google Scholar]
- 20.Rudolph MG, Bayer P, Abo A, Kuhlmann J, Vetter IR, Wittinghofer A. The Cdc42/Rac interactive binding region motif of the Wiskott Aldrich syndrome protein (WASP) is necessary but not sufficient for tight binding to Cdc42 and structure formation. J. Biol. Chem. 1998;273:18067–18076. doi: 10.1074/jbc.273.29.18067. [DOI] [PubMed] [Google Scholar]
- 21.Symons M, Derry JM, Karlak B, Jiang S, Lemahieu V, McCormick F, Francke U, Abo A. Wiskott-Aldrich syndrome protein, a novel effector for the GTPase CDC42Hs, is implicated in actin polymerization. Cell. 1996;84:723–734. doi: 10.1016/s0092-8674(00)81050-8. [DOI] [PubMed] [Google Scholar]
- 22.Wülfing C, Bauch A, Crabtree GR, Davis MM. The vav exchange factor is an essential regulator in actin-dependent receptor translocation to the lymphocyte-antigen-presenting cell interface. Proc. Natl. Acad. Sci. USA. 2000;97:10150–10155. doi: 10.1073/pnas.97.18.10150. [DOI] [PMC free article] [PubMed] [Google Scholar]
- 23.Wülfing C, Davis MM. A receptor/cytoskeletal movement triggered by costimulation during T cell activation. Science. 1998;282:2266–2270. doi: 10.1126/science.282.5397.2266. [DOI] [PubMed] [Google Scholar]
- 24.Wülfing C, Sjaastad MD, Davis MM. Visualizing the dynamics of T cell activation: ICAM-1 migrates rapidly to the T cell:B cell interface and acts to sustain calcium levels. Proc. Natl. Acad. Sci. USA. 1998;95:6302–6307. doi: 10.1073/pnas.95.11.6302. [DOI] [PMC free article] [PubMed] [Google Scholar]
- 25.Labno CM, Lewis CM, You D, Leung DW, Takesono A, Kamberos N, Seth A, Finkelstein LD, Rosen MK, Schwartzberg PL, Burkhardt JK. Itk functions to control actin polymerization at the immune synapse through localized activation of Cdc42 and WASP. Curr. Biol. 2003;13:1619–1624. doi: 10.1016/j.cub.2003.08.005. [DOI] [PMC free article] [PubMed] [Google Scholar]
- 26.Montoya MC, Sancho D, Vicente-Manzanares M, Sanchez-Madrid F. Cell adhesion and polarity during immune interactions. Immunol. Rev. 2002;186:68–82. doi: 10.1034/j.1600-065x.2002.18607.x. [DOI] [PubMed] [Google Scholar]
- 27.Bachmaier K, Krawczyk C, Kozieradzki I, Kong YY, Sasaki T, Oliveira-dos-Santos A, Mariathasan S, Bouchard D, Wakeham A, Itie A, et al. Negative regulation of lymphocyte activation and autoimmunity by the molecular adaptor Cbl-b. Nature. 2000;403:211–216. doi: 10.1038/35003228. [DOI] [PubMed] [Google Scholar]
- 28.Chiang YJ, Kole HK, Brown K, Naramura M, Fukuhara S, Hu RJ, Jang IK, Gutkind JS, Shevach E, Gu H. Cbl-b regulates the CD28 dependence of T-cell activation. Nature. 2000;403:216–220. doi: 10.1038/35003235. [DOI] [PubMed] [Google Scholar]
- 29.Rossman KL, Der CJ, Sondek J. GEF means go: turning on RHO GTPases with guanine nucleotide-exchange factors. Nat. Rev. Mol. Cell Biol. 2005;6:167–180. doi: 10.1038/nrm1587. [DOI] [PubMed] [Google Scholar]
- 30.Lamarche N, Tapon N, Stowers L, Burbelo PD, Aspenstrom P, Bridges T, Chant J, Hall A. Rac and Cdc42 induce actin polymerization and G1 cell cycle progression independently of p65PAK and the JNK/SAPK MAP kinase cascade. Cell. 1996;87:519–529. doi: 10.1016/s0092-8674(00)81371-9. [DOI] [PubMed] [Google Scholar]
- 31.Lin Q, Fuji RN, Yang W, Cerione RA. RhoGDI is required for Cdc42-mediated cellular transformation. Curr. Biol. 2003;13:1469–1479. doi: 10.1016/s0960-9822(03)00613-4. [DOI] [PubMed] [Google Scholar]
- 32.Fang Y, Park IH, Wu AL, Du G, Huang P, Frohman MA, Walker SJ, Brown HA, Chen J. PLD1 regulates mTOR signaling and mediates Cdc42 activation of S6K1. Curr. Biol. 2003;13:2037–2044. doi: 10.1016/j.cub.2003.11.021. [DOI] [PubMed] [Google Scholar]
- 33.Tybulewicz VL. Vav-family proteins in T-cell signalling. Curr. Opin. Immunol. 2005;17:267–274. doi: 10.1016/j.coi.2005.04.003. [DOI] [PubMed] [Google Scholar]
- 34.Badour K, Zhang J, Siminovitch KA. The Wiskott-Aldrich syndrome protein: forging the link between actin and cell activation. Immunol. Rev. 2003;192:98–112. doi: 10.1034/j.1600-065x.2003.00031.x. [DOI] [PubMed] [Google Scholar]
- 35.Snapper SB, Rosen FS, Mizoguchi E, Cohen P, Khan W, Liu CH, Hagemann TL, Kwan SP, Ferrini R, Davidson L, et al. Wiskott-Aldrich syndrome protein-deficient mice reveal a role for WASP in T but not B cell activation. Immunity. 1998;9:81–91. doi: 10.1016/s1074-7613(00)80590-7. [DOI] [PubMed] [Google Scholar]
- 36.Nolz JC, Gomez TS, Zhu P, Li S, Medeiros RB, Shimizu Y, Burkhardt JK, Freedman BD, Billadeau DD. The WAVE2 complex regulates actin cytoskeletal reorganization and CRAC-mediated calcium entry during T cell activation. Curr. Biol. 2006;16:24–34. doi: 10.1016/j.cub.2005.11.036. [DOI] [PMC free article] [PubMed] [Google Scholar]
- 37.Zipfel PA, Bunnell SC, Witherow DS, Gu JJ, Chislock EM, Ring C, Pendergast AM. Role for the Abi/wave protein complex in T cell receptor-mediated proliferation and cytoskeletal remodeling. Curr. Biol. 2006;16:35–46. doi: 10.1016/j.cub.2005.12.024. [DOI] [PubMed] [Google Scholar]
Associated Data
This section collects any data citations, data availability statements, or supplementary materials included in this article.