

Abstract
The abundance of β-catenin, which plays a critical role in oncogenesis, is tightly controlled by proteasomal pathways. Its aberrant accumulation is associated with the overactivation of its oncogenic signaling and tumorigenesis in cancers, including thyroid cancer. Our previous studies have suggested that β-catenin abundance could also be regulated at the transcriptional level by thyroid hormone (T3) and thyroid hormone receptor β (TRβ). By using hypothyroid mice supplemented or not with T3, we showed that T3 significantly repressed Ctnnb1 expression in vivo in the thyroid. By using two human cell lines, i.e., the thyroid HTori and the cervical cancer HeLa cell lines, each stably expressing TRβ, we observed that T3 induced the down-regulation of CTNNB1 transcript levels. Luciferase reporter assays with various constructs harboring 5′ deletion of the CTNNB1 promoter or with mutated thyroid hormone response element (TRE) binding sites, and EMSAs showed that this transrepression was mediated through an interaction between TRβ-retinoid X receptor β complexes and TREs located in the human CTNNB1 promoter between −807 and −772 and consisting of two hexamers separated by 14 nucleotides. The direct regulation of CTNNB1 expression by TRβ was further confirmed by chromatin immunoprecipitation assays showing TRβ recruitment to the CTNNB1 promoter in thyroid cells. This is the first report demonstrating a direct repression of the β-catenin gene by liganded TRβ through interaction with negative TREs located in CTNNB1 promoter. Importantly, this study uncovers a new molecular mechanism whereby liganded TRβ acts as a tumor suppressor via inhibition of the expression of a potent tumor promoter, the CTNNB1 gene.
TRβ exerts a direct repression of the β-catenin gene via TREs located in the promoter.
Thyroid hormone receptors (TRs) mediate the genomic actions of the thyroid hormone T3. TRs are ligand-dependent transcription factors derived from two genes located on two different chromosomes, THRA and THRB. The THRB gene encodes three T3-binding TRβ isoforms, β1, β2, and β3 (1). The THRA gene encodes one T3-binding TRα1 and two splicing variants, i.e. α2 and α3, which have no T3-binding activity (2). The expression of TR isoforms is tissue dependent: the major TR isoform is TRβ1 in the liver, kidney, and the thyroid, whereas it is TRα1 in the brain, heart, and bone (for review, see3).
TRs bind to thyroid hormone response elements (TREs) of T3-responsive target genes. TREs generally comprise two hexameric half-sites that consist of a consensus sequence of (G/A)GGT(C/G/A)A. The half-site binding motif can be arranged as an everted repeat, a direct repeat, or as an inverted repeat (palindromic sequence). TRs bind to TREs not only as monomers and homodimers but also as heterodimers with other members of the receptor superfamily, such as the retinoid X receptor (RXR). Heterodimerization with RXR dramatically increases the binding of TRs to TREs, the responsiveness of TRs to T3, and the transcriptional activation (4). Thus, heterodimerization provides an important means to modulate the function of TRs.
β-Catenin, a structural component of cell adhesion complexes, interacts with the transmembrane protein E-cadherin to regulate actin filament assembly and cell adhesion (5). In addition, β-catenin functions as a coactivator for a family of transcription factors known as T-cell factor/lymphoid enhancer factor. After increased cellular levels and nuclear accumulation, β-catenin-T-cell factor complexes bind to the promoters of downstream target genes involved in cell proliferation, survival, and migration (6). We have found recently that β-catenin was aberrantly increased in the thyroid tumor of the ThrbPV/PV mouse that spontaneously develops follicular thyroid carcinoma similarly to human thyroid cancer (7). The ThrbPV/PV mouse harbors a targeted knock-in mutation (denoted as TRβPV) in the Thrb gene. The TRβPV mutant, which was identified in a patient (PV) with resistance to thyroid hormone, has completely lost T3 binding and exhibits potent dominant-negative activity (8,9). We have shown recently that β-catenin accumulation was associated with the constitutive activation of β-catenin oncogenic pathway contributing to thyroid carcinogenesis of ThrbPV/PV mice (7). We identified one mechanism by which β-catenin aberrantly accumulates via nongenomic actions of TRβ. The physical interaction of β-catenin with TRβ, which was favored in the unliganded state, prevented β-catenin from proteasome-mediated degradation. The TRβPV mutant, which has lost T3 binding, constitutively bound to β-catenin to block the proteasomal degradation of β-catenin, thereby leading to sustained activation of β-catenin-mediated downstream target gene expression to promote thyroid cancer progression of ThrbPV/PV mice.
However, we also observed previously a dramatic increase in β-catenin gene (hereafter named as Ctnnb1) expression in the thyroid tumors of ThrbPV/PV mice compared with wild-type siblings (10). These findings suggested that the TRβPV mutant could act at the transcriptional level to aberrantly activate Ctnnb1 gene expression. Given that the TRβPV mutant displays dominant-negative activity, we further reasoned that the liganded TRβ should thus repress Ctnnb1 gene expression. In the present study, we evaluated this possibility with cell-based, in vitro and in vivo approaches. By using mice experimentally rendered hypothyroid and treated or not with T3, we showed that T3 significantly repressed Ctnnb1 expression in vivo in the thyroid. By using two human cell lines, i.e. the thyroid HTori and the cervical cancer HeLa cell lines both stably expressing TRβ1, we observed that T3 induced the down-regulation of CTNNB1 at the transcript level. We further showed that this transrepression was mediated through an interaction between the TRβ-RXRβ complex and TREs located in the proximal promoter between −807 and −772 consisting of atypical motifs, i.e. two hexamers separated by 14 nucleotides. This work provides the first demonstration of a direct repression of the β-catenin gene by TRβ1 and further supports that TRβ1 can negatively regulate a target gene via direct binding with TREs.
Materials and Methods
Mouse strains and cell lines
All aspects of the care and handling of animals used in this study were approved by the National Cancer Institute Animal Care and Use Committee. Human TRβ1 cDNA was cloned into pFH-IRESneo plasmid (a generous gift from R. G. Roeder, Rockefeller University, New York, NY) (11) to obtain Flag-hemagglutinin-tagged (FH)-TRβ1 cells. The establishment of HeLa cells stably expressing FH-TRβ1 (HeLa-FH-TRβ) and control cells (HeLa-FH) was reported previously (12). HTori cells were transfected with FH-TRβ1 (HTori-FH-TRβ) or the empty vector (HTori-FH) and selected with 400 μg/ml G418 (Invitrogen, Carlsbad, CA) for 2 wk as described previously (12). G418-resistant colonies expressing FH-tagged proteins were expanded for subsequent experiments. The expression of TRβ1 protein was verified by Western blot analysis using anti-Flag (Sigma-Aldrich, St. Louis, MO) and anti-TRβ1 C4 antibodies (13).
Samples from mice with experimental manipulation of the thyroid hormone levels previously described by Zavacki et al. (14) were used in this study. Briefly, wild-type mice were rendered hypothyroid by the addition of 0.1% methimazole (MMI) and 1% NaClO4 (Sigma-Aldrich) in their drinking water for 20 d, as described previously (14). Some animals from this group were injected ip with 5 μg T3 per mouse for 5 d on d 16–20 of MMI/NaClO4 treatment. Mice were killed 24 h after their last T3 injection by exsanguinations under anesthesia on d 21. Control groups (euthyroid mice) received no treatment. Serum T3 and T4 levels were measured in hypothyroid, euthyroid, and T3-injected hypothyroid mice, as described previously (14). T3 levels were 0.25 ± 0.06 ng/ml in hypothyroid mice, 0.63 ± 0.05 ng/ml in control mice, and 0.53 ± 0.06 ng/ml in T3-injected hypothyroid mice. T4 levels were below the detectable limits of the assay (<0.05 μg/dl) in hypothyroid and T3-injected hypothyroid mice, whereas they were 1.5 ± 0.35 μg/dl in control mice (14).
RNA extraction and real-time RT-PCR
HeLa-FH-TRβ and HeLa-FH cells were grown in six-well plates at a density of 2 × 10⁵ cells per well. They were cultured in charcoal-stripped (T3-depleted, denoted as Td serum) medium for 48 h and then in media containing T3 (100 nm) for the indicated times. HTori-FH and HTori-TRβ cells were grown in 100-mm dishes at a density of 1 × 10⁶ cells per well with Td medium for 48 h before treatment of T3 (100 nm) for 24 h. Total RNA from cells and thyroids was isolated using TRIzol (Invitrogen) as indicated by the protocol of the manufacturer. To determine the effect of T3 on the expression of β-catenin mRNA, real-time RT-PCR was performed using a QuantiTect SYBR green RT-PCR kit from Qiagen (Valencia, CA) following the instructions of the manufacturer. Primers were as followed: for human CTNNB1, forward, 5′-TGCAGTTCGCCTTCACTATG-3′; reverse, 5′-ACTAGTCGTGGAATGGCACC-3′; for the endogenous control gene human glyceraldehyde-3-phosphate dehydrogenase (GAPDH), forward, 5′-ACATCATCCCTGCATCCACT-3′; reverse, 5′-GTCCTCAGTGTAGCCCAAG-3′; mouse Ctnnb1, forward, 5′-AGCCGAGATGGCCCAGAAT-3′; reverse, 5′-AAGGGCAAGGTTTCGAATCAA-3′; for the endogenous control gene mouse 18S, forward, 5′-ACCGCAGCTAGGAATAATGGA-3′; and reverse, 5′-CAAATGCTTTCGCTCTGGTC-3′.
Reporter assay
The CTNNB1 promoter (−2760 to +27) cloned into pGL3b (CNNTB1-pGL3b) was generously provided by Dr. R. H. Dashwood (Corvallis, OR) (15). Serial deletions of the promoter were prepared by amplification of CNNTB1-pGL3b by PCR using 500 nm of each primer and REDExtract-N-Amp PCR ReadyMix (R4775-1.2ML; Sigma-Aldrich). The following forward primers were used: −916 CNNTB1-pGL3b, 5′- ctaaggtaccCCTAATTGACAGCGCTCTGGAGC-3′; −721 CNNTB1-pGL3b, 5′-ctaaggtaccCTTTGGGGGTGCTGTGAG-3′; −426 CNNTB1-pGL3b, 5′-ctaaggtaccAGTCCTGCAGCTGCTCTCC-3′; −303 CNNTB1-pGL3b, 5′-ctaaggtaccAGACCACAGCGCCCTCAC-3′; −193 CNNTB1-pGL3b, 5′-ctaaggtaccGCTCAGACGGCAGCAGAC-3′; and −105 CNNTB1-pGL3b, 5′-ctaaggtaccGCTCCGCGCTGCGCCGGT-3′. The following reverse primer was used: 5′-GCGACTCGATCTCGAGACGCTGCTGCCACAGACCGAGAGGCTTAAAAT-3′. Thermocycling was performed beginning with one cycle of denaturation at 94 C for 10 min, followed by elongation for 35 cycles (94 C for 30 sec, 55 C for 30 sec, 72 C for 30–60 sec) and ending with a single cycle at 72 C for 5 min. The purified PCR products were digested with KpnI and XhoI restriction enzymes and cloned into pGL3b vector.
Mutagenesis was performed as described in the QuikChange II XL site-directed kit manual (catalog no. 200521; Stratagene, La Jolla, CA). The sequences of the forward and reverse primers were mutTRE-A forward, 5′GTTCTACGGAGAGACCACAGCCTTCGTGAGTGGGGACAGAAGG 3′; mutTRE-A reverse, 5′CCGAGCCGCCTTCTGTCCCCACTCACGAAGGCTGTGGTCTCT 3′; mutTRE-C forward, 5′GTTCTACGGAGAGTTCACAGCCTTCGTGAGTGGGGGTAGAAGG 3′; and mutTRE-C reverse, 5′CCGAGCCGCCTTCTACCCCCACTCACGAAGGCTGTGAACTCT 3′. Reverse and forward primers were complementary in sequence-covered mutation sites. The mutagenesis reaction was performed in a 25 μl volume using 50 ng template DNA and 100 ng primers, and all other reagents were added following the QuickChange site-directed mutagenesis kit instructions. The cycling conditions were a 1 min initial denaturation at 95 C, 18 cycles with 50 sec denaturation at 95 C, 50 sec annealing at 60 C, and 10 min extension at 68 C, and a final extension of 15 min at 68 C. The product was treated with 10 U DpnI and incubated for 1 h at 37 C. Then, 2 μl DpnI-treated DNA was used for transformation of XL-10 Gold ultracompetent cells to select ampicillin-resistant colonies. The selected clones were verified by DNA sequencing.
HTori-FH and HTori-FH-TRβ cells were seeded at a density of 8 × 10⁴ in 12-well culture plates and preincubated for 24 h with Td medium. Cells were transfected using Lipofectamine2000 (Invitrogen) using the protocol of the manufacturer. Briefly, 0.1 μg/well reporter plasmids and 0.1 μg/well plasmid encoding β-galactosidase were incubated with Lipofectamine2000 at room temperature for 20 min and then added to cells cultured in 0.5 ml OptiMEM. After a 3-h incubation, the medium was replaced by fresh 10% Td-fetal bovine serum with or without T3 (100 nm). Cells were lysed 24 h later with 3× cell lysis buffer (BD Biosciences Pharmingen, San Diego, CA), and luciferase activity was measured using Victor 3 (PerkinElmer Life and Analytical Sciences, Waltham, MA). As an internal control, β-galactosidase activity was measured with a β-galactosidase assay kit (Agilent Technologies, Santa Clara, CA) following the protocol of the manufacturer. Luciferase values were standardized to the ratio of β-galactosidase activity to protein concentration.
EMSA
EMSAs were conducted by labeling oligonucleotides with DNA polymerase (Klenow fragment) in the presence of [α-32P]dCTP as described previously (16). Probes used in this experiment were as follows: F2, 5′-AAGGGGATCCTTATTGACCCCAGCTGAAATCAAGTTACG-3′; wild-type site 1 (S1), 5′-GTTCTACGGAGAGTTCACAGCCTTCGTGAGTGGGGACAGAAGGCGGCTCGG-3′; mutant 1 (m1) S1, 5′-GTTCTACGGAGAGACCACAGCCTTCGTGAGTGGGGACAGAAGGCGGCTCGG-3′; mutant 2 (m2) S1, 5′-GTTCTACGGAGAGTTCACAGGTTTCGTGAGTGGGGACAGAAGGCGGCTCGG-3′; mutant 3 (m3) S1, 5′-GTTCTACGGAGAGTTCACAGCCTTCGTGAGTGGGGGTAGAAGGCGGCTCGG-3′; mutant 4 (m4) S1, 5′-GTTCTACGGAGAGACCACAGGTTTCGTGAGTGGGGGTAGAAGG CGGCTCGG-3′; mutant 5 (m5) S1, 5′-GTTCTACGGAGAGACCACAGGTTTCGTGAGTGGGGACAGAAGGCGGCTCGG-3′; and mutant 6 (m6) S1, 5′-GTTCTACGGAGAGACCACAGCCTTCGTGAGTGGGGGTAGAAGGCGGCTCGG-3′. In vitro synthesized TRβ1 and RXRβ were incubated with [α-32P]dCTP-labeled probes in binding buffer [5 mm MgCl2, 20% glycerol, 2.5 mm EDTA, 2.5 mm dithiothreitol, 250 mm NaCl, and 50 mm Tris-HCl (pH 8.0)]. After incubation for 1 h at room temperature, the reaction mixture was loaded into a 5% polyacrylamide gel and electrophoresed for 2 h at a constant voltage of 250 V. The gel was dried and autoradiographed.
Chromatin immunoprecipitation assay
The chromatin immunoprecipitation (ChIP) assay was performed using the commercially available ChIP-IT kit (Active Motif, Carlsbad, CA). In brief, HTori-FH and HTori-FH-TRβ cells were grown in 100-mm dishes in DMEM supplemented with 10% fetal bovine serum. After 24 h, proteins were cross-linked to DNA using formaldehyde for 10 min. The reaction was then quenched by incubation with 5 ml of 125 mm glycine for 5 min, after which samples were rinsed twice in ice-cold PBS containing protease inhibitors. Cells were scraped and spin down at 2000 × g for 5 min. The cell pellet was resuspended in 1 ml sonication buffer and then sonicated by five sets of 20-sec pulses (Misonix XL2000) and 30-sec rest on wet ice. Samples were precleared by incubation with protein G agarose for 1 h at 4 C and centrifuged at 2000 × g for 2 min. Samples were then incubated with mouse anti-IgG (negative control), anti-RNA Polymerase II (RNA Pol II) antibody (positive control), or mouse anti-Flag antibody overnight at 4 C. The samples were incubated with protein G agarose for 1 h and centrifuged at 2000 × g for 2 min. Elution of DNA-protein complexes was performed with a buffer containing 50 mm NaHCO3 and 1% SDS. Reverse cross-link of DNA-protein complexes was performed according to the protocol of the manufacturer, and free DNA was purified using spin columns. Conventional PCR and real-time PCR were performed with the TaKaRa ExTaq kit (Takara Bio, Madison, WI) and the QuantiTect SYBR green PCR kit (Qiagen), respectively, with the following gene-specific primers: S1 forward, 5′-ACAGCGCTCTGGAGCTAATC-3′; and reverse, 5′-TGAATTTCGACCTGAATCACC-3′.
Statistical analysis
All statistical analyses were performed using StatView 5.0 (SAS Institute, Cary, NC). Statistical analysis was performed with the use of ANOVA, and P values of <0.05 were considered significant. All data are expressed as means ± ses of the means.
Results
Thyroid hormone negatively regulates β-catenin gene expression
Our previous quantitative RT-PCR studies indicated an approximately 4-fold increase in Ctnnb1 mRNA levels in the thyroid tumors of ThrbPV/PV mice compared with wild-type siblings (10). Because the TRβPV mutant is unable to bind T3 and displays dominant-negative activity, we hypothesized that T3 should normally suppress Ctnnb1 expression in wild-type thyroids. We, therefore, used a real-time RT-PCR approach to study the effect of the experimental manipulation of thyroid hormone levels on Ctnnb1 mRNA expression in the thyroids of wild-type mice (14). Indeed, in mice rendered hypothyroid with MMI and displaying lower T3 levels compared with untreated mice (euthyroid mice) (see Materials and Methods), there was a 2.3-fold increase of Ctnnb1 expression (Fig. 1A). Furthermore, in MMI-induced hypothyroid mice injected with T3, Ctnnb1 mRNAs returned to a level similar to that in euthyroid mice (Fig. 1A). These results support the notion that, in the thyroid, T3 negatively regulates the expression of the gene encoding β-catenin.
Figure 1.

T3 down-regulates the expression of CTNNB1 in the mouse thyroid and in human cell lines. A, Ctnnb1 mRNA levels in the thyroid of mice with altered thyroid hormone levels. Real-time RT-PCR studies of Ctnnb1 transcripts and the internal control ribosomal subunit 18S were performed on RNAs extracted from thyroids of wild-type euthyroid mice, mice rendered hypothyroid by an MMI treatment, and MMI-treated mice injected with T3 (MMI+T3), as indicated in Materials and Methods. The decrease in T3 levels in hypothyroid mice is accompanied by an approximately 2.3-fold increase in relative Ctnnb1 transcript levels compared with untreated (euthyroid) mice (P < 0.05). The administration of T3 to MMI-treated (hypothyroid) mice significantly decreases Ctnnb1 expression (P < 0.05). B, CTNNB1 mRNA levels in the human thyroid HTori cell line stably expressing TRβ1 (FH-TRβ) or harboring only the empty vector (FH). Cells were cultured in Td medium for 48 h, followed by treatment with (white bars) or without (black bars) T3 for 24 h, and RNAs were extracted. Real-time RT-PCR studies were performed to amplify CTNNB1 and the internal control GAPDH, as described in Materials and Methods. Relative CTNNB1 levels are not affected by T3 treatment in HTori-FH cells (NS, not significant), but they are significantly repressed in HTori-FH-TRβ cells (P < 0.05). C, CTNNB1 mRNA levels in the human cervical cancer HeLa cell line stably expressing TRβ1 (FH-TRβ) or harboring the empty vector (FH). Cells were cultured in Td medium for 48 h and then incubated with (white bars) or without (black bars) T3 for 24 h, and RNAs were extracted. Real-time RT-PCR studies were performed to amplify CTNNB1 and the internal control GAPDH, as described in Materials and Methods. Relative CTNNB1 levels are not affected by T3 treatment in HeLa-FH control cells (NS, not significant), but they are significantly repressed in HeLa-FH-TRβ cells (P < 0.05). D, Time-course study of CTNNB1 levels in HeLa-FH-TRβ cells after T3 treatment. HeLa-FH-TRβ cells were cultured in Td medium for 48 h and in media containing T3 (100 nm) for 0, 3, 6, 12, or 24 h as indicated. RT-PCR studies were performed to amplify CTNNB1 and the internal control GAPDH, as described in Materials and Methods. Liganded TRβ represses CTNNB1 expression as early as 3 h after T3 treatment (P < 0.05).
Because TRβ1 is the main TR isoform expressed in the thyroid, we then used the immortal human follicular thyroid HTori cell line (17) stably expressing TRβ1 (HTori-FH-TRβ cells) or harboring the empty vector (HTori-FH cells). Consistently, real-time RT-PCR studies showed that there was a significant decrease in CTNNB1 mRNA levels in HTori-FH-TRβ cells but not in HTori-FH cells treated with T3 for 24 h (Fig. 1B). The repression of CTNNB1 expression by liganded TRβ was also observed in the cervical cancer HeLa cell line stably expressing TRβ1 (HeLa-FH-TRβ) but not in the control HeLa-FH cells after 24 h of T3 treatment (Fig. 1C). Time-course studies in HeLa-FH-TRβ cells showed a significant decrease in CTNNB1 mRNA levels as soon as 3 h after T3 treatment (∼45% reduction) and further showed progressive decrease to reach approximately 80% reduction after 24 h (Fig. 1D). Overall, these data establish for the first time that CTNNB1 is negatively regulated by liganded TRβ in the mouse thyroid and human cell lines.
Liganded TRβ represses CTNNB1 promoter-luciferase reporter activity
Our in vivo and cell-based studies suggested that CTNNB1 could be a direct target gene of TRβ. To determine whether TRβ could directly regulate CTNNB1 transcription by binding to CTNNB1 promoter, we studied the reporter activity of an approximately 2.7 kb 5′-flanking region of the human CTNNB1 cloned into the pGL3basic vector. CTNNB1-luciferase gene activity was evaluated in HTori cells, in the presence or the absence of TRβ. The basal reporter gene activity, which was very low in HTori-FH cells, was induced by approximately 60-fold when TRβ was expressed in HTori cells cultured in Td medium (Fig. 2). Thus, unliganded TRβ potently increased CTNNB1 reporter activity. When HTori-FH-TRβ cells were cultured in the presence of T3 for 24 h, CTNNB1 reporter activity was repressed by approximately 2.5-fold compared with cells cultured in the Td medium (Fig. 2). In contrast, no change in CTNNB1 reporter activity could be observed in HTori-FH cells after T3 treatment (Fig. 2). Hence, these results are consistent with those of the real-time RT-PCR studies showing that liganded TRβ represses CTNNB1 expression. They further indicate that TRβ exerts this repression by binding to CTNNB1 promoter.
Figure 2.
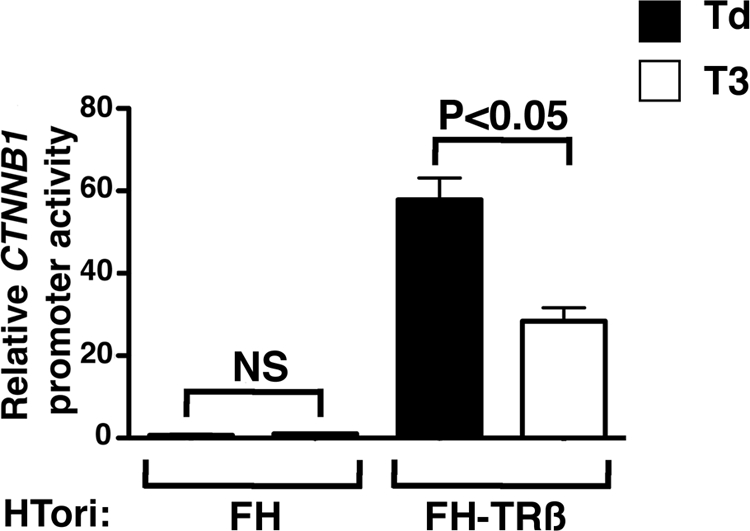
Liganded TRβ represses CTNNB1 promoter activity in HTori cells. The luciferase activity of an approximately 2.7 kb fragment of the 5′-flanking region of human CTNNB1 cloned into the pGL3-basic vector was evaluated in HTori-FH cells harboring the empty vector and in HTori-FH-TRβ stably expressing TRβ, as described in Materials and Methods. Cells were incubated with (white bars) or without (black bars) T3 for 24 h. CTNNB1 reporter activity is not altered by T3 treatment in HTori-FH control cells (NS, not significant) but is reduced by approximately 2.5-fold in HTori-FH-TRβ cells (P < 0.05).
Mapping of the TREs that interact with TRβ to mediate the repression of the proximal CTNNB1 promoter
In silico searches for TREs by computer-based sequence analysis using Transfac Professional 12.1 software showed six putative TREs located within 1 kb of the 5′-flanking region of CTNNB1, which were named S1–S6 (Fig. 3A). The possibility that one or several of these TREs located within 1 kb of the 5′-flanking region of CTNNB1 could be involved in the repression of CTNNB1 expression was supported by the approximately 2-fold repression of the reporter gene activity of a −916/+27 fragment of CTNNB1 promoter in HTori-FH-TRβ cells (Fig. 3B). To determine which of these TREs are involved in the T3/TRβ-induced repression of CTNNB1, we prepared serial 5′ deletion constructs of the −916/+27 CTNNB1 promoter (Fig. 3A). The deletion of the DNA sequence from −916 to −721 containing the S1 TRE (−721/+27 construct) completely abolished the T3/TRβ-induced repression of CTNNB1 reporter (P = 0.0016) (Fig. 3B), suggesting that S1 could function as a TRE to mediate the repression of the CTNNB1 promoter. Consistently, the deletion of longer DNA sequences containing S1 in addition to S2, S3, S4, S5, and S6 (−426/+27, −303/+27, −193/+27, −105/+27 constructs) (Fig. 3A) also resulted in the complete loss of T3/TRβ-induced repression of the reporter gene. No T3/TRβ-induced repression of the reporter gene was observed with the empty pGL3b vector (Fig. 3B). Altogether, these results indicate that S1 is the potential TRE of the CTNNB1 promoter mediating the T3/TRβ repression.
Figure 3.

The repression of CTNNB1 by liganded TRβ is mediated by cis-regulatory elements present in CTNNB1 promoter. A, In silico analyses of TREs in the human CTNNB1 promoter identified six potential binding sites, annotated S1–S6, that are located within 1 kb of the 5′-flanking region of CTNNB1. Shown are serial promoter deletion constructs used for the reporter assays. B, Reporter assays of the −916/+27 fragment and serial truncated constructs. Results are presented as the relative fold luciferase activity of cells treated with T3 for 24 h compared with cells without T3 treatment (Td medium), as indicated in Materials and Methods. The approximately 2-fold T3-induced repression of the −916/+27 CTNNB1 promoter fragment confirms the presence of negative cis-regulatory sequences in this promoter region. The serial deletions of the −916/+27 CTNNB1 promoter fragment indicate the presence of nTREs between −916 and −721 encompassing S1 TRE. NS, Not significant.
Identification of a TRE that binds TRβ-RXRβ heterodimers
Although S1 comprises two half hexameric site characteristics of TREs as indicated by computer-based analyses, these sites are not arranged as everted repeat, as direct repeat separated by a spacer of 4 bases (DR4), or as inverted repeat (palindromic sequence). Besides, they do not display the classical consensus sequence consisting of (G/A)GGT(C/G/A)A (Fig. 4A). However, the existence of atypical regulatory sequences has already been described for negative TREs (nTREs) (18,19,20). We therefore used EMSAs to determine whether this putative TRE was capable of binding TRβ in vitro. We synthesized radiolabeled double-stranded probes carrying S1 and used in vitro translated TRβ and RXRβ proteins. The F2 probe, an everted TRE, was used as a positive control. The F2 probe was bound by either TRβ homodimers or TRβ/RXRβ heterodimers, as reported previously (Fig. 4B, lanes 2 and 3). The S1 probe could bind TRβ when heterodimerized with RXRβ but not TRβ monomers or homodimers (Fig. 4B, lanes 2 and 3). S1 probe could not bind RXRβ when incubated without TRβ (data not shown).
Figure 4.

Identification by EMSAs and by transcriptional assays of a functional nTRE in the CTNNB1 promoter binding TRβ/RXRβ heterodimers. A, Oligonucleotide sequences of the control and mutated (m1S1–m6S1) probes used for studying TRβ binding capacity in vitro to the S1 of the human CTNNB1 promoter. Depicted are the three putative TREs and their orientation. In the mutant probes, two of six nucleotides within TRE-A to TRE-C hexameric half-sites were replaced by irrelevant nucleotides. B, Binding of TRβ to the site 1 in CTNNB1 promoter. EMSAs in which the everted TRE (F2 probe) positive control and the S1 control and mutant probes were incubated with reticulocyte lysate negative control (lane 1), in vitro translated TRβ (lane 2), or in vitro translated TRβ/RXRβ (lane 3). C, T3/TRβ-induced CTNNB1 reporter gene repression is abolished by mutations in the TRE-A (mutTRE-A) or TRE-C (mutTRE-C) hexameric site of S1. Two of six nucleotides within TRE-A and TRE-C sites were replaced by irrelevant nucleotides, as described in Materials and Methods. Luciferase gene reporter assays were performed with the wild-type (WT) or mutated −916/+27 constructs.
S1 displays three half TREs (annotated TRE-A, TRE-B, and TRE-C) (Fig. 4A). To further validate the capacity of S1 to bind TRβ/RXRβ and determine which TRE(s) is involved, we performed EMSAs with S1 probes in which two nucleotides of each TRE were mutated (Fig. 4A). The mutation of either TRE-A (m1S1) or TRE-C (m3S1), but not that of TRE-B (m2S1), totally abrogated TRβ/RXRβ binding (Fig. 4B). Consistent with these results, the mutations of either TRE-A or TRE-C in combination with mutations in the other sites (m4S1, m5S1, and m6S1) also resulted in the complete loss of TRβ/RXRβ binding (Fig. 4B). These results therefore suggest that S1 is composed of two hexameric sites, TRE-A and TRE-C, separated by 14 nucleotides.
To determine whether TRE-A and/or TRE-C are involved in the T3/TRβ-induced repression of CTNNB1 in cells, we performed additional luciferase reporter assays with −916/+27 CTNNB1 promoter constructs harboring wild-type or a mutated S1 site in either TRE-A or TRE-C, similar as in the m1S1 and m3S1 probes used for the EMSA (Fig. 4A). As shown in Fig. 4C, the approximately 2-fold T3/TRβ-induced repression of CTNNB1 promoter observed with the wild-type construct was totally lost when the construct displayed mutated S1 in either TRE-A or TRE-C. Altogether, these results indicate that two hexameric sites of S1, TRE-A and TRE-C, are involved in T3/TRβ-induced repression of CTNNB1.
ChIP analysis of TRβ recruitment to CTNNB1 promoter
To determine whether TRβ is recruited to the human CTNNB1 promoter in cells, we performed ChIP assays on HTori cells. The sonicated chromatin of HTori-FH and HTori-FH-TRβ cells was immunoprecipitated with an anti-Flag antibody to assess TRβ binding, with an anti-RNA Pol II antibody as positive controls, or with an irrelevant IgG as negative controls. PCR primers (S1 “forward/reverse”) were chosen to amplify the region of the endogenous CTNNB1 promoter containing the identified nTRE, S1 (Fig. 5A). Signal intensity of the IgG negative controls was used to define the threshold level of nonspecific reaction. The results of conventional PCR are shown in Fig. 5B. Comparison of the signal intensities of IgG negative controls samples with those of the RNA Pol II-immunoprecipitated samples confirmed the binding of the RNA Pol II to the proximal CTNNB1 promoter of HTori-FH and HTori-FH-TRβ cells (Fig. 5B, compare lanes 2, 3 with lanes 6, 7), consistent with CTNNB1 mRNA synthesis in these cells (Fig. 1B). Importantly, comparison of signal intensities between IgG controls and Flag-immunoprecipitated samples indicated that there was a significant binding of TRβ in the CTNNB1 promoter of HTori-FH-TRβ cells (Fig. 5B, compare lanes 6, 8). In contrast, no specific signal could be detected in HTori-FH cells, because band intensities for IgG controls and Flag-immunoprecipitated samples were similar (Fig. 5B, compare lanes 2 and 4), a result that is consistent with the lack of TRβ expression in these cells. To quantify the amount of the DNA precipitated by Flag, RNA Pol II, and IgG antibodies, we performed real-time PCR using the S1 forward and reverse primers (Fig. 5C). The amounts are expressed as percentages of the starting inputs. No specific amplification could be observed in the samples from HTori-FH and HTori-FH-TRβ cells incubated with the IgG antibody (∼0.3% of the starting inputs) (Fig. 5C). In contrast, approximately 4.5% of the DNA from HTori-FH and HTori-FH-TRβ cells was immunoprecipitated with the RNA Pol II antibody used as a positive control (Fig. 5C). Importantly, we found that approximately 4.5% of the DNA was immunoprecipitated with the anti-Flag antibody in HTori-FH-TRβ cells, with virtually no amplification in HTori-FH cells (Fig. 5C), in line with our conventional PCR results. Altogether, these results further support the data of the reporter assays and in vitro studies indicating the interaction of TRβ with S1 TRE in the promoter of CTNNB1.
Figure 5.

TRβ is recruited to the endogenous CTNNB1 promoter in HTori cells. A, Scheme showing the location of the primers encompassing the S1 site, used for the ChIP assays. S1F, Forward primer; S1R, reverse primer. B, ChIP assays were performed using control HTori-FH cells (lanes 1–4) and TRβ-expressing HTori-FH-TRβ cells (lanes 5–8) cultured in regular medium. Antibodies used in the ChIP were anti-RNA Pol II as positive controls (lanes 3 and 7), anti-Flag antibody to detect Flag-TRβ (lanes 4 and 8), as well as irrelevant IgG as negative controls (lanes 2 and 6). The chromatin immunoprecipitated and recovered DNA was used as a template for PCR amplification of the receptor-binding region in the promoter of CTNNB1. One percent of the chromatin solution (10 μl) was used for the input DNA as a control (lanes 1 and 5). C, Quantitative real-time PCR study of the DNA from HTori-FH and HTori-FH-TRβ cells immunoprecipitated with IgG, anti-RNA Pol II, or anti-Flag antibodies. The amount of the indicated products is illustrated as a percentage of that measured in the starting inputs.
Discussion
β-Catenin is the central mediator of the Wnt signaling pathway, which is critical for various cellular processes, including oncogenesis. Abnormal subcellular localization and aberrant accumulation of β-catenin have been reported for an array of cancers, including those of the thyroid in humans and in a mouse model of thyroid cancer (7). We have demonstrated previously in vivo that abnormal accumulation of β-catenin in the thyroid leads to the sustained activation of downstream target genes involved in cell proliferation, cell survival, and cell migration, to promote thyroid cancer. Proper regulation of the pool of cellular β-catenin is therefore critical to prevent β-catenin abnormal accumulation. Among the mechanisms involved in the control of β-catenin abundance through proteasomal-mediated degradation, we have previously identified a novel mode of action of TRβ through nongenomic mechanisms. Indeed, we found that β-catenin physically interacts with unliganded TRβ and TRβPV. In the presence of T3, β-catenin dissociates from TRβ/β-catenin complexes, but not from TRβPV/β-catenin complexes, to be degraded via adenomatous polyposis coli-independent proteasomal pathways (7).
In the present study, we demonstrate for the first time by in vivo and cell-based studies the existence of an additional molecular mechanism by which TRβ regulates β-catenin levels. Indeed, we show here that TRβ directly regulates the expression of the gene encoding β-catenin (CTNNB1). In mice rendered hypothyroid, we found that the decrease in serum thyroid hormone levels induced more than a 2-fold increase of Ctnnb1 transcripts in the thyroid. Consistently, when T3 was administered to hypothyroid mice, Ctnnb1 transcript levels returned to similar levels as those found in the thyroids of euthyroid mice. Because TRβ is the main TR isoform expressed in the thyroid, we hypothesized that the regulation of Ctnnb1 expression by T3 was mainly mediated by TRβ. Indeed, cell-based studies with two different human cell lines stably expressing TRβ confirmed that liganded TRβ significantly repressed CTNNB1 gene expression. These findings led us to test the possibility that TRβ directly controls the expression of CTNNB1. By reporter assays with an approximately 2.7 kb fragment of the 5′-flanking region of the human CTNNB1 promoter, we found that T3 significantly repressed the reporter activity. Our biochemical and cell-based studies, including EMSA and luciferase reporter assays, suggested that this transrepression was mediated through an interaction between the TRβ-RXRβ complex and a TRE (S1) (Fig. 4A), which was located between −807 and −772. Our data show that S1 consists of atypical motifs of two hexamers, separated by 14 nucleotides.
Given that liganded TRβ represses the gene encoding β-catenin in both humans and mice in the aforementioned cell lines or tissue, we reasoned that a common evolutionary conserved nTRE would exist in these two species. By computer-based analyses, we found a similar S1 located in the same region of the mouse promoter (Supplemental Fig. 1, published on The Endocrine Society’s Journals Online web site at http://endo.endojournals.org). Therefore, these data strongly support the fact that S1 probably plays an important role in the T3/TRβ repression of the β-catenin gene in both species.
The mechanisms underlying the positive regulation of genes by TRs have been extensively studied over the past decades. In contrast to positively regulated target genes, negatively regulated genes are activated in the absence of T3 and repressed by its presence. However, the mechanism(s) for negative transcriptional regulation by T3 is not well understood. nTREs are generally half-sites with a consensus AAGTAA sequence, but there are exceptions. This is the case for the TRH promoter displaying three TREs (S4–S6) with nonclassical motif (e.g. S4 sequence is TGACCT) (18). An atypical nTRE (AAGGCA) has also been reported in the Rous sarcoma virus promoter (19) and in the promoter of type 4 melanocortin receptor (Mc4fr) (ATTGGT) (20). These nTREs can bind to both TRα and TRβ isoforms (Mc4fr) but also selectively bind to either TRβ (S4 of the TRH promoter) or TRα (Rous sarcoma virus promoter) (18,19,20). Interestingly, Plateroti et al. (21) reported the existence of a positive regulation of Ctnnb1 expression by T3 in the developing mouse intestine. This effect was mediated through the binding of TRα to TREs located in Ctnnb1 intron 1. In our study, that the repression of CTNNB1 promoter was specifically mediated by TRβ and not by TRα was suggested by the observation that T3 significantly repressed CTNNB1 expression and promoter activity in cells expressing TRβ (Figs. 1C and 2) but not in those expressing TRα (Supplemental Fig. 2).
Importantly, no similar TREs as those observed in mouse Ctnnb1 intron 1 by Plateroti et al. were found in human CTNNB1 intron 1 (data not shown). Therefore, their study and ours support the idea that distinct regulatory elements exist in the β-catenin gene that may allow for differential regulation by T3 in an isoform-, tissue-, and species-specific manner. The mechanisms underlying the isoform-specific regulation of the β-catenin gene remains to be elucidated. However, it is reasonable to postulate that the nucleotide motif, the length and structure of the spacer between two half TREs, the orientation of the TREs as well as cell-specific coregulators may coordinately contribute to the regulatory role.
In conclusion, the present report uncovers a molecular mechanism whereby TRβ controls β-catenin abundance by acting at the transcript level. This mode of TRβ action involves TRβ binding to cis-regulatory elements located within β-catenin proximal promoter. Together with our previous findings showing that TRβ can also control β-catenin protein turnover (7), these data suggest that TRβ functions through both genomic and nongenomic mechanisms to regulate β-catenin abundance in the thyroid. However, the relative contribution of each mode of TRβ actions in the regulation of β-catenin is not clear at present and remains to be addressed. Because liganded TRβ suppresses β-catenin signaling and thereby can repress the expression of β-catenin target genes involved in cell proliferation and migration (7), these results provide important molecular basis to support the tumor suppressor action of liganded TRβ and to understand how unliganded TRβ mutants can underlie the pathogenesis of thyroid cancer.
Acknowledgments
We thank Dr. Hao Ying for assistance in the preparation of mice rendered hypothyroid by treatment with antithyroid drugs.
Footnotes
This research was supported by the Intramural Research Program of the Center for Cancer Research, National Cancer Institute, National Institutes of Health.
Disclosure Summary: The authors have nothing to disclose.
First Published Online September 15, 2010
Abbreviations: ChIP, Chromatin immunoprecipitation; CTNNB1, β-catenin gene; FH, Flag-hemagglutinin-tagged; GAPDH, glyceraldehyde 3-phosphate dehydrogenase; m1–m6, mutants 1-6; MMI, methimazole; nTRE, negative thyroid hormone response element; RNA Pol II, RNA Polymerase II; RXR, retinoid X receptor; S1–S6, sites 1-6; Td, T3-depleted; Thr, thyroid hormone receptor gene; TR, thyroid hormone receptor; TRE, thyroid hormone response element.
References
- Williams GR 2000 Cloning and characterization of two novel thyroid hormone receptor beta isoforms. Mol Cell Biol 20:8329–8342 [DOI] [PMC free article] [PubMed] [Google Scholar]
- Mitsuhashi T, Tennyson GE, Nikodem VM 1988 Alternative splicing generates messages encoding rat c-erbA proteins that do not bind thyroid hormone. Proc Natl Acad Sci U S A 85:5804–5808 [DOI] [PMC free article] [PubMed] [Google Scholar]
- Cheng SY, Leonard JL, Davis PJ 2010 Molecular aspects of thyroid hormone actions. Endocr Rev 31:139–170 [DOI] [PMC free article] [PubMed] [Google Scholar]
- Zhang XK, Kahl M 1993 Regulation of retinoid and thyroid hormone action through homodimeric and heterodimeric receptors. Trends Endocrinol Metab 4:156–162 [DOI] [PubMed] [Google Scholar]
- Gottardi CJ, Gumbiner BM 2001 Adhesion signaling: how β-catenin interacts with its partners. Curr Biol 11:R792–R794 [DOI] [PubMed] [Google Scholar]
- Moon RT, Bowerman B, Boutros M, Perrimon N 2002 The promise and perils of Wnt signaling through β-catenin. Science 296:1644–1646 [DOI] [PubMed] [Google Scholar]
- Guigon CJ, Zhao L, Lu C, Willingham MC, Cheng SY 2008 Regulation of β-catenin by a novel nongenomic action of thyroid hormone β receptor. Mol Cell Biol 28:4598–4608 [DOI] [PMC free article] [PubMed] [Google Scholar]
- Meier CA, Dickstein BM, Ashizawa K, McClaskey JH, Muchmore P, Ransom SC, Menke JB, Hao EH, Usala SJ, Bercu BB 1992 Variable transcriptional activity and ligand binding of mutant β 1 3,5,3′-triiodothyronine receptors from four families with generalized resistance to thyroid hormone. Mol Endocrinol 6:248–258 [DOI] [PubMed] [Google Scholar]
- Parrilla R, Mixson AJ, McPherson JA, McClaskey JH, Weintraub BD 1991 Characterization of seven novel mutations of the c-erbA β gene in unrelated kindreds with generalized thyroid hormone resistance. Evidence for two “hot spot” regions of the ligand binding domain. J Clin Invest 88:2123–2130 [DOI] [PMC free article] [PubMed] [Google Scholar]
- Ying H, Suzuki H, Furumoto H, Walker R, Meltzer P, Willingham MC, Cheng SY 2003 Alterations in genomic profiles during tumor progression in a mouse model of follicular thyroid carcinoma. Carcinogenesis 24:1467–1479 [DOI] [PubMed] [Google Scholar]
- Martinez E, Palhan VB, Tjernberg A, Lymar ES, Gamper AM, Kundu TK, Chait BT, Roeder RG 2001 Human STAGA complex is a chromatin-acetylating transcription coactivator that interacts with pre-mRNA splicing and DNA damage-binding factors in vivo. Mol Cell Biol 21:6782–6795 [DOI] [PMC free article] [PubMed] [Google Scholar]
- Ying H, Furuya F, Zhao L, Araki O, West BL, Hanover JA, Willingham MC, Cheng SY 2006 Aberrant accumulation of PTTG1 induced by a mutated thyroid hormone beta receptor inhibits mitotic progression. J Clin Invest 116:2972–2984 [DOI] [PMC free article] [PubMed] [Google Scholar]
- Bhat MK, McPhie P, Cheng SY 1995 Interaction of thyroid hormone nuclear receptor with antibody: characterization of the thyroid hormone binding site. Biochem Biophys Res Commun 210:464–471 [DOI] [PubMed] [Google Scholar]
- Zavacki AM, Ying H, Christoffolete MA, Aerts G, So E, Harney JW, Cheng SY, Larsen PR, Bianco AC 2005 Type 1 iodothyronine deiodinase is a sensitive marker of peripheral thyroid status in the mouse. Endocrinology 146:1568–1575 [DOI] [PubMed] [Google Scholar]
- Li Q, Dashwood WM, Zhong X, Al-Fageeh M, Dashwood RH 2004 Cloning of the rat β-catenin gene (Ctnnb1) promoter and its functional analysis compared with the Catnb and CTNNB1 promoters. Genomics 83:231–242 [DOI] [PubMed] [Google Scholar]
- O'Shea PJ, Guigon CJ, Williams GR, Cheng SY 2007 Regulation of fibroblast growth factor receptor-1 (FGFR1) by thyroid hormone: identification of a thyroid hormone response element in the murine Fgfr1 promoter. Endocrinology 148:5966–5976 [DOI] [PubMed] [Google Scholar]
- Lemoine NR, Mayall ES, Jones T, Sheer D, McDermid S, Kendall-Taylor P, Wynford-Thomas D 1989 Characterisation of human thyroid epithelial cells immortalised in vitro by simian virus 40 DNA transfection. Br J Cancer 60:897–903 [DOI] [PMC free article] [PubMed] [Google Scholar]
- Hollenberg AN, Monden T, Wondisford FE 1995 Ligand-independent and -dependent functions of thyroid hormone receptor isoforms depend upon their distinct amino termini. J Biol Chem 270:14274–14280 [DOI] [PubMed] [Google Scholar]
- Saatcioglu F, Deng T, Karin M 1993 A novel cis element mediating ligand-independent activation by c-ErbA: implications for hormonal regulation. Cell 75:1095–1105 [DOI] [PubMed] [Google Scholar]
- Decherf S, Seugnet I, Kouidhi S, Lopez-Juarez A, Clerget-Froidevaux MS, Demeneix BA 2010 Thyroid hormone exerts negative feedback on hypothalamic type 4 melanocortin receptor expression. Proc Natl Acad Sci U S A 107:4471–4476 [DOI] [PMC free article] [PubMed] [Google Scholar]
- Plateroti M, Kress E, Mori JI, Samarut J 2006 Thyroid hormone receptor α1 directly controls transcription of the β-catenin gene in intestinal epithelial cells. Mol Cell Biol 26:3204–3214 [DOI] [PMC free article] [PubMed] [Google Scholar]