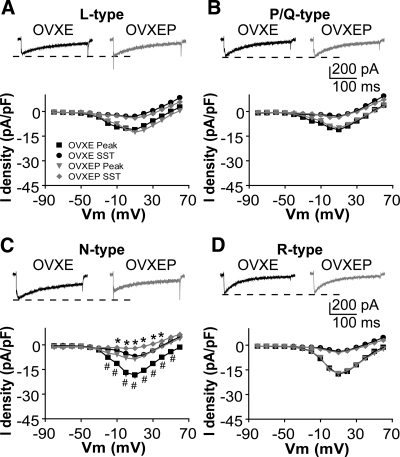
Figure 2.
P treatment inhibits specifically N-type currents. A–D, Representative ICa of each subtype of HVA in response to a step from −90 to +10 mV (top) and average I-V plot for that subtype (below). The notch on the rising phase of the current in B and C is due to pressure artifact from application of SNX-482; amplitude is not affected by this artifact, and this cell was most representative of mean current amplitude and density. *, P < 0.05 SST; #, P < 0.01 peak OVXEP vs. OVXE.

