

Abstract
Alcohol consumption during pregnancy causes Fetal Alcohol Spectrum Disorder (FASD), which includes a range of developmental deficits. Fetal alcohol syndrome (FAS) is the most severe form of FASD and can be diagnosed with pathognomonic facial features (smooth philtrum, short palpebral fissure, and thin upper vermilion). However, many children with developmental damage due to prenatal alcohol exposure exhibit no, or only a subset, of the above features, making diagnosis difficult. This study explored novel analyses to quantify the effect of a known dose of alcohol on specific facial measurements in sub-strains C57BL/B6J (B6J) and C57BL/6NHsd (B6N) mice. Mouse dams were provided alcohol (Alc) consisting of 4.8% (v/v) alcohol in a liquid diet for 16 days pre-pregnancy, chow and water diet during mating, and the alcohol liquid diet reinstated on gestational days 7(E7) to E17. Treatment controls included a pair-fed (PF) group given matched volumes of an alcohol-free liquid diet made isocalorically, and a group given ad lib access to lab chow and water (Chow). Maternal diet intake (Alc and PF), blood alcohol concentrations (BACs), embryo weights, and 15 morphometric facial measurements for E17 embryos were analyzed. B6N dams drank more alcohol during pregnancy and generated higher BAC than B6J dams. Both the Alc and PF treatments induced significant reductions in embryo weights relative to Chow in both sub-strains. Alcohol treatments produced significant changes, relative to controls, in four of the 15 facial measures for the B6N sub-strain, but only in two measures for the B6J sub-strain. Discriminant analysis demonstrated successful classification of the B6N alcohol-exposed versus non-alcohol exposed embryos with high sensitivity (86%), and specificity (80%), and overall classification (total correct 83%), while, B6J mice yielded sensitivity of 80%, specificity 78%, and overall correct classification in 79%. In addition, B6N mice showed significantly more effects of pair feeding on these facial measures than did B6J, suggesting that the B6N sub-strain may be more vulnerable to nutritional stress during pregnancy. Overall, these data indicate that B6N and B6J mice were both vulnerable to alcohol but show differences in the severity and location of alcohol-induced dysmorphic facial features and may parallel findings from human studies comparing different ethnic groups. Furthermore these findings suggest that discriminant analysis may be useful in predicting alcohol exposure in either mouse sub-strain.
Keywords: facial development, genetic variance, morphometrics, anthropometry, diagnosis, craniofacial, translational study
Introduction
Excessive alcohol consumption during pregnancy may cause many adverse developmental effects in the conceptus that are now recognized as a spectrum of cognitive, behavioral, and structural abnormalities termed Fetal Alcohol Spectrum Disorders (FASD; Barr and Streissguth, 2001; Goodlett et al., 2005; Hoyme et al., 2005; Sokol et al., 2003). Effective clinical diagnosis of FAS/FASD depends, in part, on a distinct set of abnormal facial features (smooth philtrum, short palpebral fissures, and thin upper vermilion) (Astley, 2006; Bertrand et al., 2005; Jones and Smith, 1973; Loock et al., 2005). Optimal clinical management requires early diagnosis, since early intervention improves outcome and facial dysmorphology becomes less distinct with age (Streissguth et al., 1991). Many FASD patients demonstrate only a small subset of dysmorphic features, with varying degrees of expression, and to date clinical diagnosis of cases with less obvious dysmorphology is not reliable (Hoyme et al., 2005). Additional complications in diagnosis of FASD arise from differences in facial dysmorphology that vary as a function of ethnicity (Moore et al., 2007).
Over the last several years published diagnostic guidelines for FAS/FASD have included; Institute of Medicine (IOM) guidelines (Stratton et al.,1996), FASD 4-Digit Diagnostic Code (Astley and Clarren, 2000), Center for Disease Control and prevention (CDC) guidelines (Prevention, 2004), Hoyme FASD guidelines (Hoyme et al., 2005), and Canadian FASD guidelines (Chudley et al., 2005). All require distinct criteria for alterations in growth, facial dysmorphology, and central nervous system abnormalities. Diagnosis of facial dysmorphology in these guidelines, encompass all or a partial set of distinct facial features; including a smooth philtrum, short palpebral fissure, and thin upper vermilion. In addition, a flat mid-face is a dysmorphic criteria in the IOM guidelines. Current diagnostic methods for human facial features in FAS/FASD use direct clinical observation (Jones and Smith, 1973), scored assessment of two dimensional photographs (Astley, 2001; Astley, 2002), or craniofacial anthropometry (or other morphometric techniques) combined with multivariate analysis to assess sets of distinct facial alterations that may be used to classify FASD over a wide age range (Moore et al., 2001, 2002, 2007).
Although each method is generally suited for diagnosing fullblown FAS when the cardinal facial features are evident, facial anthropometry has been shown to have advantages for identifying FASD in cases with less obvious or minimal clinical facial features (Ferrario et al., 1998; Hurwitz et al., 1999; Moore et al., 2001). Variations in facial phenotypes across ethnic groups also complicate the diagnosis of FAS. For example, a recent study using facial anthropomorphometry to classify FAS and control cases using discriminant analysis of 16 different facial measures in 4 different groups (North American Caucasian, African-American, Finnish Causian, Cape Coloured of South Africa, not matched for age) found that FAS and control cases could be classified with relatively high sensitivity and specificity in each group, but the discriminant analysis relied on different, unique combinations of measures for each group to achieve the best results (Moore et al., 2007). This earlier study suggested ethnic variation but, due to a wide variation in the ethnic population in terms of age and demographic features, may not account for all differences seen in discriminant analysis. These findings suggest that the particular features of facial structure that provide the most reliable diagnostic discrimination of facial dysmorphology may vary with ethnicity, genotype, age, nutrition, behavior and/or varied combinations of these factors. Relatively little is known about the contribution of these factors or developmental differences to variations in the expression of alcohol-induced facial dysmorphology, and animal studies offer a model to identify how these factors modify or regulate the effects of prenatal alcohol exposure on craniofacial morphogenesis.
Facial dysmorphology results from alcohol exposure during critical periods of embryonic development, and studies using chick, rat and mouse models of prenatal alcohol exposure demonstrate a strong connection between the emergent facial dysmorphology and the induction of apoptosis and altered migration of neural crest cells (Cartwright and Smith, 1995; Chen et al., 2000; Sulik, 2005; Sulik et al., 1986). Recent studies using mouse models of FASD, with controlled dose and timing of alcohol exposure, have demonstrated distinctive structural alterations in head and face development (Goodlett and Horn, 2001; Ogawa et al., 2005; Zhou et al., 2003). Studies using C57BL/6 (B6) mice demonstrate some distinct facial dysmorphology that parallels human dysmorphology (Johnson 1998, Sulik, 1984; Swayze, 1997), and it has been suggested that craniofacial dysmorphology correlates with CNS abnormalities (Parnell et al., 2006; Parnell et al., 2009). Mouse models provide a means to study how alcohol exposure alters morphogenetic processes to produce a specific set of abnormal facial features, and to assess the extent to which the altered development of the face is associated with alterations in CNS structure and function. Mouse models in FASD facial dysmorphology provide the crucial experimental capability of controlling and manipulating the dose and developmental timing of the alcohol exposure, thereby allowing for dose-effect analyses and differences associated with the developmental stage of exposure. Information from mouse studies can then inform efforts to improve clinical diagnosis of FASD when the phenotype is only partially expressed, by developing quantitative means to identify patterns of facial and CNS abnormalities that may be translated to apply to clinical diagnosis in a quick and cost-effective manner.
Although several strains of mice have been assessed for teratogenic effects from alcohol, the C57BL/6 strain will drink ethanol with high avidity, and ethanol exposure in B6 mice under varied conditions alters craniofacial features defining an FAS phenotype. (Khisti et al., 2006; Ogawa et al., 2005; Sulik, 2005), including alterations in brain, body and behavior. To investigate how similar doses of alcohol can result in varied FASD facial dysnmophology, we controlled dose of alcohol exposure during a specified treatment period and examined two sub-strains of B6 mice, C57BL/6J (B6J, The Jackson Laboratories, Bar Harbor, Maine) and C57BL/6NHsd (B6N, Harlan Sprague Dawley, Indianapolis, IN) which derived from same ancester and separated over hundreds of generations. Previous studies have reported dysmorphic facial features for both sub-strains (Parnell et al., 2006; Sulik, 2005; Degitz et al., 2004; Ogawa et al., 2005). Our choice of these two sub-strains was further influenced by the known genetic/phenotypic differences reported by Harlen, Jackson Lab and other studies on comparative analysis in genotype and behavior (Green et. Al. 2008; Petkov et.al. 2004; Byrant et. al. 2008). Current Jackson Laboratory comparisons suggest metabolic, bone density, and body fat differences between C57BL/6J and C57BL/6N (http://phenome.jax.org/pubcgi/phenome/mpdcgi?rtn=views/twostrains_mpd&strains=7,138&diffmode=diff)(http://www.harlan.com/online_literature/rms__animal_models.hl). Expression differences in glucose metabolic genes (PFKL, PGK1, PKM2, NNT) also have been reported in 6BJ as compared to 6BN (Green et. Al. 2007; Petkov et.al. 2004). Most of all, the genetic difference on DNA sequence alone does not account for the whole spectrum of rich diversity. The environmental interaction influencing epigenetic marks could also be transmitted through generations without affecting DNA sequences. These inbred sub-strains, are likely to have accumulate epigenetic and other non-genetic differences, which might collaboratively contribute to the phenotypic difference as well as differential vulnerability. Furthermore, recent studies in our laboratory, and those of Sulik et. al. show distinguishalbe differences in embryo facial dysmorphology, developmental progression, embryo weights, and dam drinking behavior between these two sub-strains. For example, differences were seen in palpebral fissure and eye development as well as gross morphology (Green 2007). We evaluated the two sub-strains to determine whether they manifest differences in the patterns of facial dysmorphology. These studies assessed alcohol intake, embryo weights, and most of all the15 facial measurements derived directly from those used in previous studies of human FAS (Moore et al., 2007; Hoyme et al., 2005; Astley, 2001; Astley, 2002), using 2D linear anthropometric measurements on E17 embryos for both the B6J and B6N sub-strains.
Materials and Methods
Subjects
Inbred B6N and B6J were used in the study. Adult (26 ± 2 weeks old) nulliparous female and male breeders of the B6N inbred strain (obtained from Harlan Sprague Dawley Indianapolis, Indiana), or the B6J inbred strain (obtained from Jackson Laboratory, Bar Harbor Maine) were treated as described below in parallel experiments. All mice were used in accordance with NIH and Indiana University Animal Care and Use guidelines (IACUC) and due care was exercised to assure minimal pain and discomfort. All research was conducted in accordance with all local, state, national, and international standards for Animal Care and Use. The mice were acclimated to a reverse light/dark cycle (lights on 10:00pm to 10:00am) for one week before treatment began. Animals not on liquid diet treatment (see below) were given ad libitum chow and water.
Treatment Groups and Liquid Diet Administration
Our experimental paradigm consisted of three treatment groups designated as Alcohol, Pair-Fed (PF), and Chow. All Alcohol treatments used alcohol concentrations of 4.8% v/v in liquid diet [Purina Micro-stabilized Alcohol Diet (PMI), Purina Mills Inc., Richmond, Indiana] as per suppliers’ instructions with 5% w/v sucrose. Pair-Fed diets used the PMI diet mixture with equal caloric maltose dextran (MD) (Isocaloric diets) as a substitute for alcohol calories, and the volume of liquid diet intake was restricted to that of a matched dam from the alcohol group throughout all treatments. All liquid diets were formulated at 1cal/ml and were administered using a 35ml drinking tube (Dyets Inc, NY). Chow treatment was ad libitum chow and water diet through pre- and pregnancy periods. Pre-pregnancy alcohol started with 2.4% v/v liquid diet for two days then 14 days 4.8% v/v alcohol; Pair-Fed dams were given volumes of isocaloric diet matched to the respective alcohol-consuming dam. Animals were then placed on chow/water diets during alcohol withdrawal period of 4 days and during the subsequent mating period. For timed pregnancies, 2 females were placed with one male for a 2-hour period beginning at the start of the dark cycle (10:00am to 12:00 noon). Dams were checked for sperm plugs at the end of two hours and determined pregnant at detection of sperm plug (embryonic day 0 E0). All animals were mated daily over a period of no more than 3 weeks, at which time all animals were on ad libitum chow and water diets, until plugs were detected. If no plug was found within this time frame, animals were eliminated from the study. At embryonic day 7 (E7) pregnant dams were placed on Chow, 4.8% v/v Alcohol, or PF as indicated above through the end of E16.
Liquid Diet and Alcohol Intake
All PF and Alcohol treated dams were weighed and total volume (in ml), of a 4.8% v/v liquid diet were recorded at 10am daily during both pre- and pregnancy periods. Drinking measures (in g/kg) were obtained by converting the volume of 4.8% v/v alcohol liquid diet, consumed each day, to grams of alcohol consumed then value divided by the dam’s body weight (kg). The volume of liquid diet consumed by each group (Alcohol or PF) is also reported as ml/kg ± SEM per day. Statistical analyses were performed using analysis of variance (ANOVA).
Embryo Isolation
Under deep CO2 euthanasia, embryos were harvested from dams at E17 (10am–12 noon) by removal from the embryonic sack. Each embryo was immersion-fixed in 20 ml of 4% paraformaldyhyde/PBS and stored at 4°C in fixative overnight.
Embryo Weight
Each embryo was weighed on a Sartorius R160P analytical scale, followed by toe clip marking to maintain embryo identification between all images and facial measurements. Differences in weight between treatments were tested using an ANOVA within each line. Variability due to litter effect was accounted for by employing litter ID as a covariate nested within treatment.
Blood alcohol Concentrations
A committed set of treated dams (N=8 for each sub-strain) were used to collect tail vein blood for blood alcohol concentration analysis. Samples were collect during pre-pregnancy treatment on days 3 and 7 and during pregnancy treatment on days 3 (E7) and day 10 (E17). Blood samples were collected at two time intervals on each collection day at 2 hrs and 4hr into the dark cycle (12 and 2pm). Blood samples (15 ul ) were collected in heparinized tubes. and plasma was collected through centrifugation and stored at −80°C prior to analysis with Gas Chromatograph ( GC, Agilent Technologies; model 6890 ). Each sample was analyzed in duplicate.
Facial Morphometrics
2D Image Acquisition and Measurement
All 2D images were acquired using a SPOT Insight color digital camera 3.2.0 (Diagnostic Instruments, Inc.) and run by SPOT Advanced version 4.6 software. The camera was attached to a Leica MZFLIII Stereomicroscope. The SPOT camera was calibrated to focal length, resulting in defined sensor pixel to real distance conversions. Focal length, 1.25×10 (ratio of 169:1000μm) was used for all sample measurements. To attain proper consistency in lateral angles, embryo sample were hold on Plexiglas head in a fixed position place and placed on a rotating dual step motor system (Model MD-2, Arrick Robotics, Tyler TX). Five pictures were taken of each sample including: 1) a fixed 10° tilt to the frontal view, defined by Frankfort horizontal, 2) a top view to acquire bitragal measurement. 3) full frontal view defined as 0° (nose forward defined as the line from the nasion through the middle of the nose pad centered between the developing nasal cavities), (4 and 5) left lateral 70°, right lateral −70°, using dual step motor. A total of 15 morphometric measurements were defined (Figure 3). The facial morphometric measurements were performed using a computation vector after calibration with known metrics. The shortest distance between the two reference points was acquired. Linear facial measurements (depicted in fig. 3) were taken for each sub-strain and included width, height, and depth measurements analogous to those obtained in human studies. The muti-angle 2-D analysis of facial images has previously been demonstrated to predict the control and alcohol-treated mice in the same treatment paradigm (Fang et al., 2009).
Figure 3.
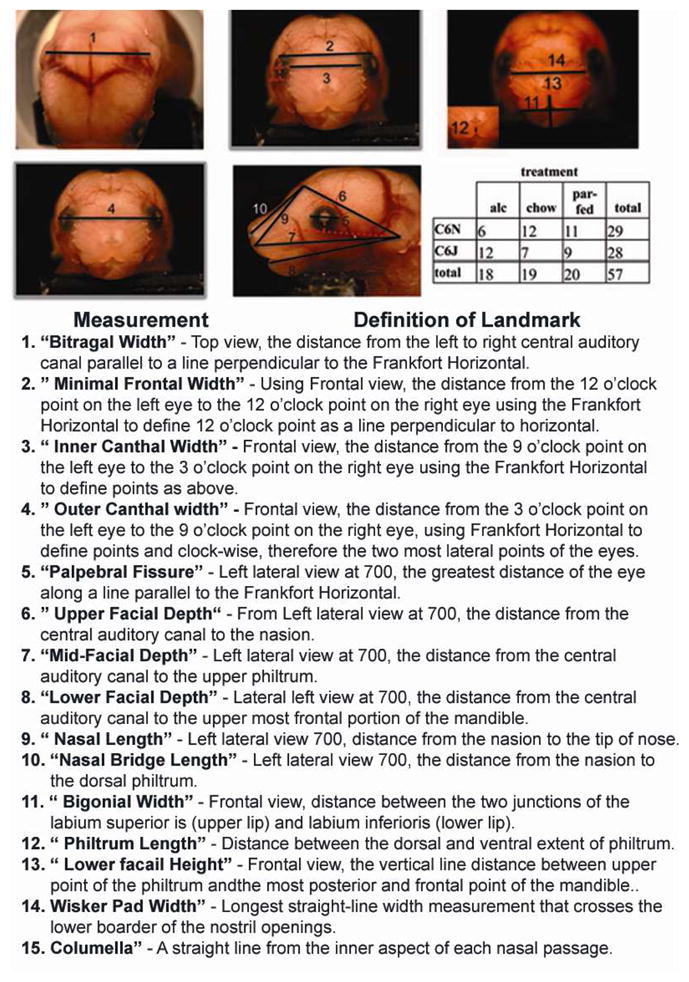
E17 embryos depicting 15 measurement landmarks used for 2D analysis. Distinct definitions for landmark selects are described in methods table 1. N= B6N; alc 6, chow 12, PF 11 and B6J: alc 12, chow 7, PF 9. Calibration scale is at 1000μm.
For translational study, the mouse embryological analogue of facial anthropometry previously studied for FAS diagnosis (Moore et al., 2007) was adopted. For this purpose, the 15 facial measurements were matched with measurements in human studies. Because of the obvious differences in facial morphology and the fact that our test subjects were embryos, some of the measurements e.g. whisker pad, nasal length, nasal bridge length, columella, could only approximate features found in humans. Only the left side of all bilateral measurements was used in the analyses (to avoid bias by camera capture through a single lens pathway on microscopic). Facial measurement outliers deviating more than three standard deviations as a result of measurement error within each treatment for each sub-strain were excluded. In addition, measurements due to overdeveloped embryos (plugs missed at E0 and detected at E1) and those showing deformation from embryo isolation were excluded. The Frankfort Horizontal (FH) was used as reference line to position five measurements, minimal frontal width, outer canthal width, inner canthal width, and palpebral fissure length. FH on mouse was defined as the line that connects the lowest point in the outer lower margin of the bony orbit, and the center of the auditory canal. To define nasion, we used the line created for inner canthal width and determined a center point, as nasion. Statistical analysis is presented below.
Maternal Variables and Embryo Weights
All analyses were performed using SAS software (v. 9.1.3, Cary, NC). Daily maternal alcohol intake (measured in g/kg) and volume (measured in ml/kg) were analyzed separately for the pre-pregnancy and pregnancy period using repeated measures analysis of variance (ANOVA) models with sub-strain (B6N or B6J) as a grouping factor and day as the repeated measure. In addition, maternal weight gain, defined as the difference in dam weight from E7 to E17 was analyzed using an ANOVA with strain and treatment as between group factors. Since the alcohol and PF groups were matched only within sub-strain, differences in embryo weights due to treatment effects (alcohol, PF, chow) were tested separately within each strain using an ANOVA. Variability due to litter effects was accounted for by employing litter as a nested effect within treatment for all ANOVA models. Comparisons between treatments were performed as post-hoc tests using the Tukey-Kramer correction for multiple testing within each strain. The potential for the pair feeding procedures to affect the two strains differently was tested with a second ANOVA model using a two-way factorial ANOVA with the control (non-alcohol) treatments (Chow or PF) and sub-strain (B6N or B6J) as between-group factors.
Analysis of Facial Measurements
The 15 lineal facial measurements obtained in the E17 embryos were grouped according to the three dimensions, facial widths, depths, and lengths. To minimize the number of tests performed, a multivariate ANOVA (MANOVA) was first performed to test for an overall effect of treatment (p<0.05 from Hotelling’s T2 test) within each sub-strain, using the vector of all 15 facial measurements as the dependent variable. Given the significant effect of treatment, univariate ANOVAs were performed for each measure (litter nested within treatment) with the alpha level adjusted to 0.0033 (=0.05/15). For any measure meeting the adjusted alpha level on the univariate test, the pair-wise comparisons among the three treatment groups within the measure were performed using the Tukey-Kramer procedure, which adjusted for the three pair-wise comparisons. The mean ± sem and p-values from this analysis for the two sub-strains are shown in Tables 1 and 2 respectively. A total of 15 tests were performed within each sub-strain, therefore a Bonferroni corrected alpha = 0.0033 was used as the treatment significance threshold of each facial measurement univariate ANOVA. Pairwise differences between treatments were examined in facial measurements with a treatment p-value less than this threshold utilizing a Tukey-Kramer correction for multiple testing. Differences in measurements between sub-strains for the non-alcohol treated animals were tested using an individual analysis of variance (ANOVA) model with with sub-strain (B6N or B6J) as the independent variable. A corrected alpha of 0.05/15=0.0033 was used for each ANOVA.
Table 1.
Facial morphometric measures. Mean and standard error for 15 facial measurements.
| B6N | Alcohol | Pair-fed | Chow | |||
|---|---|---|---|---|---|---|
| Measurement | Mean | Error | Mean | Error | Mean | Error |
| minimal frontal | 4122 | 60 | 4117 | 61 | 4448 | 57 |
| bitragal | 5571 | 42 | 5348 | 43 | 5670 | 41 |
| bigonial | 2930 | 25 | 2773 | 24 | 2904 | 23 |
| inner canthal | 3355 | 32 | 3333 | 33 | 3522 | 31 |
| outer canthal | 5160 | 51 | 5027 | 52 | 5342 | 49 |
| ^ palpebral fissure | 1411 | 15 | 1456 | 15 | 1520 | 15 |
| whisker pad | 3503 | 36 | 3343 | 37 | 3589 | 35 |
| columella | 411 | 11 | 465 | 11 | 418 | 13 |
| ^ upper face | 5105 | 36 | 5226 | 36 | 5282 | 34 |
| ^ mid face | 6945 | 46 | 7142 | 44 | 7239 | 41 |
| ^ lower face | 6367 | 57 | 6453 | 58 | 6495 | 54 |
| nasal length | 2589 | 30 | 2768 | 28 | 2846 | 27 |
| nasal bridge length | 2351 | 28 | 2463 | 26 | 2549 | 25 |
| philtrum | 444 | 11 | 429 | 11 | 420 | 10 |
| lower facial height | 1517 | 34 | 1486 | 35 | 1512 | 33 |
| B6J | Alcohol | Pair-fed | Chow | |||
|---|---|---|---|---|---|---|
| Measurement | Mean | Error | Mean | Error | Mean | Error |
| minimal frontal | 4441 | 59 | 4338 | 61 | 4447 | 74 |
| bitragal | 5606 | 31 | 5643 | 33 | 5723 | 39 |
| bigonial | 2951 | 70 | 2940 | 70 | 2908 | 84 |
| inner canthal | 3447 | 63 | 3537 | 65 | 3616 | 79 |
| outer canthal | 5214 | 64 | 5326 | 66 | 5443 | 80 |
| ^ palpebral fissure | 1415 | 19 | 1471 | 20 | 1501 | 24 |
| whisker pad | 3435 | 20 | 3494 | 21 | 3632 | 25 |
| columella | 425 | 17 | 423 | 18 | 404 | 22 |
| ^ upper face | 5041 | 76 | 5395 | 78 | 5377 | 106 |
| ^ mid face | 6824 | 75 | 7383 | 78 | 7262 | 93 |
| ^ lower face | 6164 | 96 | 6635 | 102 | 6446 | 119 |
| nasal length | 2791 | 39 | 2966 | 40 | 2955 | 55 |
| nasal bridge length | 2447 | 39 | 2602 | 40 | 2622 | 54 |
| philtrum | 534 | 17 | 452 | 17 | 494 | 21 |
| lower facial height | 2312 | 46 | 2089 | 46 | 2199 | 56 |
Measurements values are reported in micrometers.
denotes left side measurement only
Table 2.
Facial morphometric analysis. P-value of significant treatment main effects (within sub-strain) for each facial measure is indicated. For the paired comparisons, (using Tukey-Kramer procedures) comparisons were made for Alc to Chow, PF to Chow, and Chow to PF groups: Bolded-typed values under columns denote that the overall treatment p-value < the corrected Bonferonni alpha = 0.0033. An asterisk (*) denotes that the Tukey-Kramer pair-wise comparison was significant (p<0.05). Gray-shaded areas are measurements with significant difference between both control groups and alcohol-exposed group.
| Measure | B6N | B6J | |||||||
|---|---|---|---|---|---|---|---|---|---|
| Univariate | Univariate | ||||||||
| p value (α =0.0036) | Alc-Chow | Alc-PF | Chow-PF | p value (α =0.0036) | Alc-Chow | Alc-PF | Chow-PF | ||
| Width | minimal frontal | 0.0001* | 0.001* | 1.00 | 0.001* | 0.30 | |||
| bitragal | 0.0001* | 0.22 | 0.001* | 0.0001* | 0.07 | ||||
| bigonial | 0.0001* | 0.71 | 0.0001* | 0.001* | 0.92 | ||||
| inner canthal | 0.0001* | 0.0001* | 0.88 | 0.11 | 0.24 | ||||
| outer canthal | 0.0002* | 0.03* | 0.17 | 0.0001* | 0.09 | ||||
| ^ palpebral fissure | 0.0001* | 0.0001* | 0.09 | 0.009* | 0.02 | ||||
| whisker pad | 0.0001* | 0.21 | 0.008* | 0.0001* | 0.0001* | 0.0001* | 0.10 | 0.0001* | |
| columella | 0.0027* | 0.004* | 0.02* | 0.75 | |||||
| Depth | ^ upper face | 0.0019* | 0.002* | 0.03° | 0.20 | 0.0001* | 0.0001* | 0.0001* | 0.80 |
| ^ mid face | 0.0001* | 0.0001* | 0.008* | 0.25 | 0.0001* | 0.001* | 0.0001* | 0.58 | |
| ^ lower face | 0.28 | 0.004 | |||||||
| Height | nasal length | 0.0001* | 0.0001* | 0.0001* | 0.12 | 0.005* | |||
| nasal bridge | 0.0001* | 0.0001* | 0.012* | 0.05 | 0.008* | ||||
| philtrum | 0.20 | 0.12 | |||||||
| lower facial height | 0.80 | 0.002* | 0.12 | 0.001* | 0.35 | ||||
B6N: MANOVA (n=84); Hotelling’s Trace F(30,70)=3.7, p<0.0001; Univariate adjusted alpha = 0.0033; n’s=94–113 B6J: MANOVA (n=78); Hotelling’s Trace F(30,65)=4.9, p<0.0001; Univariate adjusted alpha = 0.0033; n’s=98–118
Measure taken on left side;
significant treatment effect, a=0.0033; *p<0.05, Tukey-Kramer;
p=0.05, Tukey-Kramer.
Gray shaded area represents measurements for both Alc-PF and Alc-Chow groups that show significant differences.
Discriminant Analysis
As indicated earlier, one of the goals of the study was to compare the results in this mouse model of FAS with the results of clinical anthropometry measurements (Moore et al., 2007). A similar discriminant analysis was used to identify which combination of facial measurements would best classify the embryos as being exposed in-utero to alcohol, compared to all embryos that were not exposed to alcohol. To examine effects in dysmorphology due to nutrition, a discriminant analysis was used to compare the PF animals to the Chow animals. Correct classification rates were compared between the two sub-strains using a z-test of proportions. To ensure the best possible model, forward, backward and stepwise models were employed. SAS inherently omitted individuals with missing data for any one measurement. Correct classification results are reported as sensitivity (% of alcohol exposed embryos correctly classified), specificity (% non-alcohol exposed (Chow or PF) embryos correctly classified), and overall correct classification (% all embryos correctly classified). Classification percentages were based on cross-validation results, in which one observation is omitted and the classification function was estimated based on the remaining n-1 observations. The data from the omitted observation was used in the estimated classification function and the resulting classification recorded. This was repeated for all observations. Results based on the backward models used fewer measurements, with only a slight loss of correct classifications; therefore, results from the backward models are reported below.
Results
Maternal Intake, BAC, and Weight
Daily alcohol intake (g/kg) for the two sub-strains is shown in Fig. 1A and 1B (pre- and during-pregnancy exposure), and the daily volume of liquid diet consumption (ml/kg) is shown in Fig. 1C and D. The 4.8% (v/v) alcohol was adopted to reflect a moderate chronic drinking paradigm in humans with consumption generating BAC at an average of 120 mg/dL (4.8%). It has been demonstrated that a liquid diet model with BAC at 80–150mg/dL cause gross retardation and head size reduction. The alcohol level of 4.8% was used to gain additional insight on dose effect on facial dysmorphology. Before pregnancy, the dams of both strains significantly increased their alcohol intake over the first week of exposure [main effect of day on g/kg intake, F(15, 3) = 16.6, p=0.02, and on volume, F(15,3) = 12.2., p=0.03]. However, there were no main or interactive effects of strain for g/kg alcohol intake or volume for the pre-pregnancy period (all p>0.08). BAC ( Fig 2a) demonstrated a higher significant blood alcohol in B6N compared to B6J in pre-pregnancy with all times examined ( averages, B6N 128 g/dl ± 8, B6J 63 mg/dl ± 6 mg/dl: p<0 .01) In the pregnancy period, the B6N dams drank more than the B6J dams [F(9,9) = 3.3, p=0.05 for g/kg alcohol intake; F(10,8) = 3.52, p=0.04 for volume], associated primarily with higher intakes during the first and last few days of exposure to the alcohol liquid diets during pregnancy (day x line interaction, g/kg F(9,9) = 3.15, p=0.05; volume F(9,9) = 3.48, p=0.04). All p-values are reported in Figure 1. BAC during pregnancy were considerably reduced in both sub-strains for our time periods of collection with B6N showing significant differences only after 4 hrs into the dark cycle ( averages in pregnancy period C6N 50 ± 5 mg/dl, C6J 21±6 mg/dl: Fig 2a). For maternal weight gain during pregnancy (E7-E17 weights), there were no significant effects of treatment on sub-strain (Fig 1). Total number of litters are; Nalc= 7, NPF= 11, NChow= 12 for B6J: and Nalc= 12, NPF= 9, NChow= 7 for B6N.
Figure 1.

Alcohol consumption for B6N and B6J animal groups. 1a and b. Alcohol consumption was recorded daily in both B6N and B6J, during pre-pregnancy 16 days (a) and post-pregnancy (b) E7-E17. Daily means -± SEM are reported in g/kg intake. N=30, B6N, and 45, B6J, pre-pregnancy, 15, B6N, 15, B6J, post pregnancy. Age of dams was 27 weeks prior to pre-pregnancy treatment. 1c and d. Daily means -± SEM of liquid diet volume consumed reported in ml/kg. Table (e) reflect differences in total g/kg intake both pre and post pregnancy. (*) Denotes significant difference. Table (f) reflects alcohol treated dam weights for each sub-strain reported as mean ± SEM.
Figure 2.
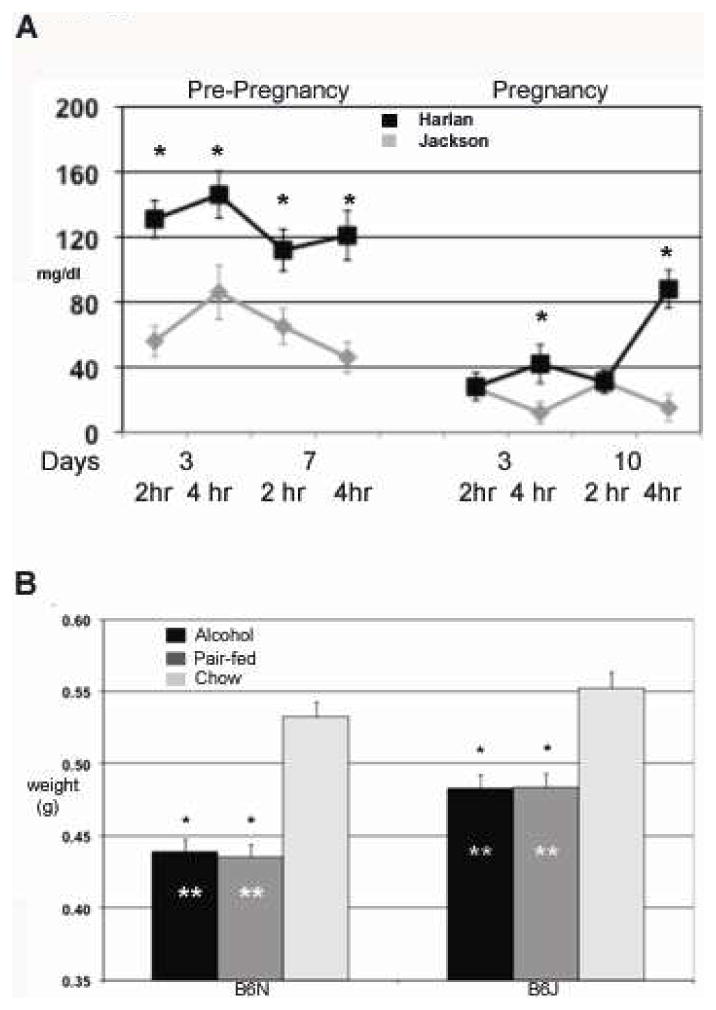
A. Chart of blood alcohol concentrations (mg/dl) analized using gas chromatography. Data is reported as MEAN ± SEM with an N=8 for each sun-strain. (*) Denotes significant differences between sub-strain using student t-test. B. Histogram of E17 embryo weights from all treatment groups. Average weights for all embryos are reported in grams ± SEM. (*) Denotes significant difference by (ANOVA) within treatment groups compared to chow. (**) Denotes difference between groups for designated treatment. N = 7,11,12 B6N, Alc, PF, Chow, 12,9,7 B6J, Alc, PF Chow.
Embryo Weights
There were significant treatment effects on weight within each sub-strain revealed for both the B6N and B6J mice [F(2,90)=67.5 and F(2,95)=19.8 respectively; both p<0.0001]. Post-hoc tests for each sub-strain demonstrated significant differences in embryo weights between Alcohol and Chow treatments and between the PF and Chow treatments (all comparisons p<0.0001). Alcohol and PF groups did not differ significantly from each other within either sub-strain (p>0.92). As seen in Fig. 2b, within each sub-strain the treatment effects were due to the lower weights of the embryos from the Alcohol and PF dams relative to those from the Chow dams. Moreover, the liquid diet procedure resulted in comparable embryo weights in the Alcohol and PF groups (within sub-strain) on E17. However, embryo weights differed in the two sub-strains in terms of the effects of consuming the control liquid diet. A two-way ANOVA of embryo weights using the Chow and PF groups and the two sub-strains confirmed a significant sub-strain X treatment interaction [F(1,122)=44.9 p<0.0001] as well as significant main effects of treatment [F(1,122)=49.3, p<0.0001] and sub-strain [F(1,122)=10.2, p=0.002]. The Chow group of the B6J sub-strain had higher body weights than the Chow group of the B6N sub-strain (p=0.0001). More importantly, the B6N PF mice (given control liquid diet) had greater reductions in embryo weights (relative to the respective Chow group) than did the B6J mice. Results are based on sample size: NAlc = 37, NPF = 44, NChow = 40 for B6N embryos; and NAlc = 54, NPF = 41, NChow = 28 for B7J embryos. Mean e+ SEM weight for the E17 embryos of the two sub-strains are shown in Fig. 2 (B6N, n=121; B6J, n=123).
2D Facial Measurements
The mean and standard errors for each of the 15 facial measurements across treatment groups for each sub-strain are shown in Table 1. The only difference between sub-strains for the chow treated animals was in philtrum length (p=0.002). The pair fed animals were different for most of the width measurements (minimal frontal, bitragal, bigonial, inner canthal, outer canthal, whisker pad, columella, all p<0.0001), upper facial depth (p=0.001) and nasal length (p=0.0005). Columella width was larger in the B6N mice but all other differences show larger B6J measurements. The MANOVA models, testing overall treatment effects, yielded significant treatment effects both for the B6N sub-strain (Hotelling’s Lawley-Trace = 2.67, F(30, 70)=3.67, p<0.0001) and the B6J strain (Hotelling’s Lawley-Trace = 3.86, (F30,65)=4.92, p<0.0001). In the B6N sub-strain, significant treatment effects were found for all facial measurements (all p<0.0019) except lower facial depth, philtrum length, and lower facial height (all p>0.20). As shown in Table 2, significant differences in the follow-up pair-wise comparisons were observed between the Alcohol and Chow (8 measurements), Alc and PF (8 measurements) and Chow and PF (7- measurements) (all p<0.03). However, four measures were identified in the B6N strain for which the Alcohol group differed significantly both from the PF and the Chow group—upper facial depth (both p<0.03), mid-facial depth (both p<0.008), nasal length (both p<0.0001), and nasal bridge (both p<0.01). In contrast, the B6J strain showed fewer measures with significant treatment effects (whisker pad, upper facial depth, mid-facial depth, and lower facial height, all p<0.002; see Table 2), and only two measures were identified in the B6J strain in which the Alcohol group differed significantly from both the PF and the Chow groups (upper facial depth, and mid-facial depth both p<0.0001). Thus, significant effects specific to alcohol treatment, (i.e., the Alcohol group differed from each respective control group), were identified for two measures of facial depths (upper facial depth; mid-facial depth) in both sub-strains, but only the B6N strain showed significant effects on two other facial height measures (nasal length; nasal bridge). The two strains showed markedly different patterns of facial alterations comparing the PF and Chow groups. In particular, the B6N sub-strain showed a significantly greater vulnerability to the pair feeding procedure (in terms of smaller facial measures) than did the B6J sub-strain. As shown in Table 1 and 2, the B6N PF group differed from the Chow group on 7 of the 8 width measures (all p<0.02), whereas the B6J PF group differed from its respective Chow control only on the whisker pad measure (p=0.0001). These changes in embryonic facial measures indicate that the PF feeding procedure had a greater impact on embryonic facial development in the B6N sub-strain than in the B6J sub-strain on E17. This was not simply due to any reduced caloric intake of the B6N PF dams relative to the B6J PF dams during pregnancy, because the B6N dams actually consumed larger volumes of liquid diet (on a ml/kg basis) than did the B6J dams [main effect of strain, F(10,8) = 3.52., p<0.05; strain X day interaction, F(9,9)=3.48, p<0.04]. Interestingly, comparisons between Chow groups (overall line effect across all measurements) demonstrated B6N Chow animals had overall significantly larger measurements for all width measures except palpebral fissure, as well as higher values for nasal length and upper face compared to C6J controls.
Discriminant Analysis of 2D Facial Measures
Discriminant analysis comparing PF to Chow animals in the B6N sub-strain demonstrated perfect identification of the PF treated animals (100% correct) and 92% of the Chow treated animals were correctly classified, using inner canthal, whisker pad, and lower facial depth in the classification function. A similar discriminant analysis model in the B6J sub-strain yielded slightly lower correct clasification rates of 85% for the Chow mice and 87% for the PF mice. Measurements in the final model included outer canthal, whisker pad, upper facial and mid facial depths. While the difference in correct classification of the Chow mice was significant different (p=0.02), there was no significant difference in the correct classification of Chow mice between the two sub-strains (p=0.18). Stepwise discriminant analysis (Table 3) was performed separately in each sub-strain using the 15 facial measurements, for which mice were identified either as alcohol exposed or non-alcohol exposed (combining Chow and PF mice). For the B6N sub-strain, classification of the alcohol-exposed embryos (n=28) and non-alcohol exposed embryos (n=74) had the highest sensitivity (86%), specificity (80%), and overall correct classification rate (83%) based on one width measurement (bigonial), one depth measurement (lower facial depth), and one height measurement (nasal length). In contrast, the discriminant function for the B6J mice produced the optimal classification of alcohol and non-alcohol exposed embryos using no width measurements, two depth measurements (upper facial, lower facial depth), and one height measurement (nasal bridge). The discriminant analysis for the B6J mice yielded slightly lower significant classification results (sensitivity = 80%, specificity = 78%, overall correct = 79%) than did the discriminant analysis for the B6N mice. The sensitivities between the two sub-strains were not significantly different (p=0.18), and the specificities were marginally different (p=0.06). Additional discriminant analysis comparing alcohol-treated embryos to the PF embryos, yielded similar discriminant functions but with higher correct classification values for both the B6N sub-strain (% overall correct = 90%) and the B6J sub-strain (% overall correct = 85%). Using variables from the final discriminant function (Table 3), in conjunction with measurement values, (Table 1) we show in Figure 4 the representative alcohol induced changes for each sub-strain. The sensitivities between the sub-strains were significantly different (p=0.02), while the specificity were marginally different (p=0.06).Comparison between Chow and PF were also examined for each sub-strain to determine the extent of dysmorphology associated with liquid diet. In B6N, classification of chow (N=34) and PF (n=38) was sensitivity (90%), specificity (85%), and overall correct classification rate (87%) based on 3 measurements; inner canthal and whisker pad widths and lower facial depth. Compared to B6N, classification of B6J required 8 measurement parameters to achieve sensitivity (92%), specificity (100%), and overall correct classification rate (96%) based on outer canthal and whisker pad widths, upper and mid facial depths, and all 4 height measurements (chow, n=19; PF, n=38).
Table 3.
Discriminant analysis was done with all 15 measurements for correct predictability. Analysis was performed using backward stepwise model for comparison. Discriminant analysis was performed using individual animal groups (B6N and B6J) with comparisons between Alc and Pair-Fed as well as between Alc to all-non-alcohol litters. Percentage of correct predictability is reported for Alc and Non-Alc groups.
| Measurement | B6N | B6J | |||
|---|---|---|---|---|---|
| Alc vs PF | Alc vs non-Alc | Alc vs PF | Alc vs non-Alc | ||
| Width | minimal frontal | ||||
| bitragal | X | ||||
| bigonial | X | X | |||
| inner canthal | |||||
| outer canthal | |||||
| palpebral fissure | |||||
| whisker pad | |||||
| columella | |||||
| Depth | upper face | X | |||
| mid face | |||||
| lower face | X | X | X | ||
| Height | nasal length | X | X | ||
| nasal bridge length | X | X | |||
| philtrum | |||||
| lower facial height | X | ||||
| Sensitivity | 89.7 | 85.7 | 82.0 | 79.6 | |
| Specificity | 89.7 | 79.7 | 87.5 | 78.0 | |
| Percentage Correct | 89.7 | 82.7 | 84.8 | 78.8 | |
“x” denotes the measurement in each column needed in the final classification model. % Reflects the percentage of correct predictions.
Figure 4.
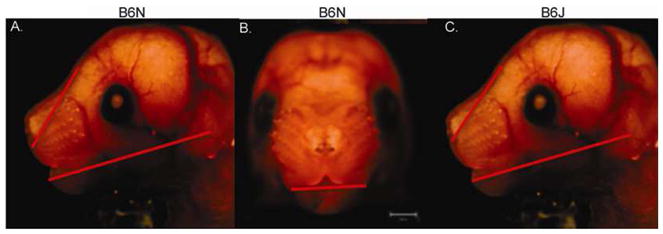
Embryo photos showing changes in facial measurements used as predictors within the two sub-strains. Red lines arrows indicate the type and direction of change for each sub-strain. In all cases alcohol induced decreased measurements. Calibration is at 1000μm.
Discussion
Given the difficulty in controlling for facial variation in human subjects and the reliability of alcohol intake information, this animal model allows for studies of facial alterations related to specific timing and dose of alcohol cast against two closely related substrains of mice. Furthermore, establishing mouse facial measurements correlates to human embryological analogues of anthropometry and allows for future analysis of contributing factors specific to neurocrest and a given craniofacial dysmorphology.
Facial Morphometry: Population, Alcohol, and Nutrition
This study applied facial morphometric measures, derived explicitly from previous studies of human facial dysmorphology in FAS (Astley, 2006; Hoyme et al., 2005; Moore et al., 2007), to assess whether facial dysmorphology induced in E17 mouse fetuses can have quantitative parallels to facial dysmorphology found in humans. In addition, similar to human studies (Moore et al., 2007), the B6J and B6N demonstrated not only common but also differential facial morphometric alteration to alcohol. First, there is a minimal baseline morphometric difference between the B6N and B6J, except a single difference in philtrum length (comparison between Chow groups of the two sub-strains; p=0.002). It indicates that there is significant stability in basal facial morphometry phenotype between B6N and B6J. The philtrum length however is independent measurement to the philtrum depth used as a prime facial feature in FAS. Second, Alcohol induced similar facial morphometric alterations in B6N and B6J. Shared effects were found in mid-facial and upper facial depths that are consistent with the “flattened mid-face” reported as part of the human FAS facial anthropometry (Moore et al., 2001; Moore et al., 2007), and as part of the diagnostic criteria for FAS facial dysmorphology in the IOM guidelines ( Stratton et al., 1996). More specifically, differences between alcohol-treated and control mice (both PF and Chow) were identified in both sub-strains in upper facial and mid-facial depth measures. On the other hand, differential morphometric vulnerability were also noted; the B6N showed two additional alcohol-induced facial height morphometric alteration, than B6J, in nasal length and nasal bridge length. This observation is in contrast to previously observed greater vulnerability in ocular dysmorphology in B6J than B6N (Green 2007). Third, a distinct difference was found between these sub-strains with pair feeding of a control liquid diet comparing Chow to PF groups for each sub-strain. For B6N animals, all PF measurements were lower then chow controls with the exception of columella. In B6J animals, measures in PF animals, versus Chow, were lower with the exception of columella, bigonial, nasal length, and three depth measurements ( lower, mid, and upper facial). Comparison of differences in PF groups between sub-strains demonstrated a more severe embryonic growth restriction in B6N animals compared to B6J. There were statistically larger values in B6J animals compared to the B6N PF group for all width measurements with the exception of palprebral fissue, as well as upper facial depth, and nasal length. This suggests a strong dietary effect from PF liquid control diets in B6N mice that is not as distinct in B6J mice. To our knowledge, this is the first report showing possible sub-strain differences on alcohol-induced dysmorphology in the response to liquid diet pair feeding in these two closely related mouse sub-strains. It suggests that different sub-strains demonstrate a differential dietary effect that could effect alcohol susceptibility and induce variations in [alcohol-exposure rendered] facial dysmorphology. We believe that nutritional disparity can contribute to the alcohol induced dysmorphology in FASD.
Translational study in Mouse and Human FASD
Pertinent to our goal of developing analytic procedures useful in developing a model for translational studies between mice and humans, current study with discriminant analysis performed in the same manner in human as that used in the study by Moore et al. (Moore et al., 2007) was able to classify the alcohol-exposed and non-exposed embryos with good sensitivity (prediction of alcohol exposure) and specificity (prediction of control). We found different sets of measures were needed in the two sub-strains to achieve optimal classification outcomes. This data mirrors, in part, the outcomes reported in human anthropomorphic analysis over ethnic background, in which four different discriminant functions were needed to effectively classify FAS and control cases in four different ethnic groups (North American Caucasian; African American; Cape Colored; Finnish Caucasian) (Moore et al., 2007). Although not necessarily comparable to human ethnic diversity, the B6N and B6J are closely related substrains and do have different aspects in yet to be defined genetic or epigenetic background. The C57BL/6J mouse strain, developed in 1921, was acquired by the Jackson Laboratory in 1948. The NIH acquired this strain in 1951 and has been maintained separately from the Jackson Laboratory line since this time. Harlan Sprague Dawley received their C57BL/6 line through the NIH (C57BL/6N) several generations after it’s acquisition from Jackson. Although these two sub-strains have been portrayed as genetically similar, undefined differences have accumulated over generations (http://phenome.jax.org/pubcgi/phenome/mpdcgi?rtn=views/twostrains_mpd&strains=7,138&diffmode=diff)(http://www.harlan.com/online_literature/rms__animal_models.hl) (Bryant et al., 2008; Datta et al., 2008; Green 2007, Knudsen 2008, Petkov et. al). It is thus noteworthy that these differences may impact the particular characteristics important to both drinking behavior and the teratogenic effects from alcohol in these two sub-strains associated with spectrum of facial dysmorphology in FASD. Studies by Khisti et al (Khisti et al., 2006) demonstrated a similar finding for differences in alcohol intake and measures of alcohol craving behavior when comparing C57BL/6NCrl and C57BL/6J mice. To the extent that different genotypes can be shown to contribute either to differences in maternal alcohol drinking or metabolism, or to susceptibility of the fetus to induction of FASD phenotypes (Bennett et al., 2006; Downing et al., 2009), then the differential expression of genetic or epigenetic variations may be potential contributing factors to the divergence of FASD phenotypes.
Abnormalities in the morphological development of the face have been critical as part of the diagnostic criteria of fetal alcohol syndrome (FAS) since its original identification (Jones and Smith, 1973). In all human diagnostic guidelines to date, the conventional pathognomonic facial feature of FAS include all or part of a set of facial alteration including smooth philtrum, short palpebral fissure, thin upper vermilion and flat mid-face (Astley, 2006). Variations in diagnosis of facial alterations in each model suggest more stringent palpebral fissure criteria to be more predictive (Astley, 2006). Using a mouse model, Parnell et al. (Parnell et al., 2009), showed that an alcohol exposure C57BL6J demonstrated altered eye development, however, this study did not measure distance or diameter. Sulik and colleagues (Sulik, 1984) demonstrated that high doses of ethanol from intra-peritoneal injections in C57BL/6J mice during very specific periods of early embryonic development (centered around embryonic day E7) could induce abnormal facial development in embryonic mice that parallel the facial dysmorphology seen in cases of human FAS. Our model demonstrated a distinct biological alcohol effect evident in flat mid-face features in both sub-strains. Although we have tried to parallel facial feature measurements between humans and our mouse model, upper vermilion and philtrum features are difficult to evaluate in mice at this age. In addition, the lip-philtrum guide from the University of Washington establishes a 4–5 scale for FAS diagnosis; yet age, ethnicity, and facial expression may contribute to confounding factors. We therefore, suggest that further examination of these two parameters, vermilion and philtrum, will require the use of a scale analogous to human analysis, and may add discriminate features for better overall classification.
In summary, The current study is the first in using a facial morphometric analysis in parallel to anthropometry to diagnose the FASD under a known specific dose and timing of alcohol exposure. In particular, the conditions of ethanol exposure (including dose, pattern, and or duration during embryonic development) mimics chronic alcohol exposure among human subjects, precluding underlying effects (e.g., genetic or maternal factors such as metabolism) allowing for an appropriate model for examination of dysmorphic facial phenotypes. Our results demonstrate that it is possible to detect distinct facial effects from oral alcohol consumption of specific levels in mice, and that these effects differ in part between the two sub-strains. This supports the use of these procedures in experimental mouse models to better define how risk factors, such as the conditions of ethanol exposure, stage of development, or genetic variants of common ancestry, contribute to the variable facial phenotype associated with prenatal alcohol exposure. In addition to the diagnosis, current model further contribute a better understanding of the mechanisms of abnormal craniofacial development potential for future application of timely treatment.
Supplementary Material
Acknowledgments
This study is supported by NIAA AA016698 to FC Zhou, a part of Collaborative Initiative on Fetal Alcohol Spectrum Disorders (CIFASD) Consortium. C. Goodlett is a co-investigator, B, Anthony is a postdoctoral fellow contributing to animal drinking paradigm and facial measurement acquisition and analysis, Sophia Vinci-Booher is research assistant contributing to micro-video facial image and morphometric measurement acquisition, R Ward to morphometry design, and L. Wetherill to statistical analyses. All or part of this work was done in conjunction with the Collaborative Initiative on Fetal Alcohol Spectrum Disorders (CIFASD), which is funded by grants from the National Institute on Alcohol and Alcohol Abuse (NIAAA). E. Riley is the PI of the Administrative Core of the CIFASD (AA014811) and can be contacted at eriley@mail.sdsu.edu. Send publication request to FCZ at imce100@iupui.edu.
Footnotes
Publisher's Disclaimer: This is a PDF file of an unedited manuscript that has been accepted for publication. As a service to our customers we are providing this early version of the manuscript. The manuscript will undergo copyediting, typesetting, and review of the resulting proof before it is published in its final citable form. Please note that during the production process errors may be discovered which could affect the content, and all legal disclaimers that apply to the journal pertain.
References
- Astley SJ. Comparison of the 4-digit diagnostic code and the Hoyme diagnostic guidelines for fetal alcohol spectrum disorders. Pediatrics. 2006;118:1532–1545. doi: 10.1542/peds.2006-0577. [DOI] [PubMed] [Google Scholar]
- Astley SJ, Clarren SK. Measuring the facial phenotype of individuals with prenatal alcohol exposure: correlations with brain dysfunction. Alcohol Alcohol. 2001;36:147–159. doi: 10.1093/alcalc/36.2.147. [DOI] [PubMed] [Google Scholar]
- Astley SJ, Clarren SK. Diagnosing the full spectrum of fetal alcohol-exposed individuals: introducing the 4-digit diagnostic code. Alcohol Alcohol. 2000;35:400–410. doi: 10.1093/alcalc/35.4.400. [DOI] [PubMed] [Google Scholar]
- Astley SJ, Stachowiak J, Clarren SK, Clausen C. Application of the fetal alcohol syndrome facial photographic screening tool in a foster care population. J Pediatrics. 2002;141:712–717. doi: 10.1067/mpd.2002.129030. [DOI] [PubMed] [Google Scholar]
- Barr HM, Streissguth AP. Identifying maternal self-reported alcohol use associated with fetal alcohol spectrum disorders. Alcohol Clin Exp Res. 2001;25:283–287. [PubMed] [Google Scholar]
- Bennett B, Downing C, Parker C, Johnson TE. Mouse genetic models in alcohol research. Trends Genet. 2006;22:367–374. doi: 10.1016/j.tig.2006.05.005. [DOI] [PubMed] [Google Scholar]
- Bertrand J, Floyd LL, Weber MK. Guidelines for identifying and referring persons with fetal alcohol syndrome. MMWR Recomm Rep. 2005;54:1–14. [PubMed] [Google Scholar]
- Bryant CD, Zhang NN, Sokoloff G, Fanselow MS, Ennes HS, Palmer AA, McRoberts JA. Behavioral differences among C57BL/6 sub-strains: implications for transgenic and knockout studies. J Neurogenet. 2008;22:315–331. doi: 10.1080/01677060802357388. [DOI] [PMC free article] [PubMed] [Google Scholar]
- Cartwright MM, Smith SM. Stage-dependent effects of ethanol on cranial neural crest cell development: partial basis for the phenotypic variations observed in fetal alcohol syndrome. Alcohol Clin Exp Res. 1995;19:1454–1462. doi: 10.1111/j.1530-0277.1995.tb01007.x. [DOI] [PubMed] [Google Scholar]
- Chen SY, Periasamy A, Yang B, Herman B, Jacobson K, Sulik KK. Differential sensitivity of mouse neural crest cells to ethanol-induced toxicity. Alcohol. 2000;20:75–81. doi: 10.1016/s0741-8329(99)00058-0. [DOI] [PubMed] [Google Scholar]
- Chudley AE, Conry J, Cook JL, Loock C, Rosales T, LeBlanc N. Fetal alcohol spectrum disorder: Canadian guidelines for diagnosis. CMAJ. 2005;172:S1–S21. doi: 10.1503/cmaj.1040302. [DOI] [PMC free article] [PubMed] [Google Scholar]
- Datta S, Turner D, Singh R, Ruest LB, Pierce WM, Jr, Knudsen TB. Fetal alcohol syndrome (FAS) in C57BL/6 mice detected through proteomics screening of the amniotic fluid. Birth Defects Res A Clin Mol Teratol. 2008;82:177–186. doi: 10.1002/bdra.20440. [DOI] [PMC free article] [PubMed] [Google Scholar]
- Degitz SJ, Zucker RM, Kawanishi CY, Massenburg GS, Rogers JM. Pathogenesis of methanol-induced craniofacial defects in C57BL/6J mice. Birth Defects Res A Clin Mol Teratol. 2004;70:172–178. doi: 10.1002/bdra.20010. [DOI] [PubMed] [Google Scholar]
- Downing C, Balderrama-Durbin C, Broncucia H, Gilliam D, Johnson TE. Ethanol Teratogenesis in Five Inbred Strains of Mice. Alcohol Clin Exp Res. 2009;33(7):1238–1245. doi: 10.1111/j.1530-0277.2009.00949.x. [DOI] [PMC free article] [PubMed] [Google Scholar]
- Fang S, Liu Y, Huang J, Vinci-Booher S, Anthony B, Zhou FC. Alcohol exposure analysis of mouse embryos using multi-angle facial image analysis. Proc of ACM Symp Appl Computing. 2009:852–856. doi: 10.1901/jaba.2009.2009-852. [DOI] [PMC free article] [PubMed] [Google Scholar]
- Ferrario VF, Sforza C, Poggio CE, Cova M, Tartaglia G. Preliminary evaluation of an electromagnetic three-dimensional digitizer in facial anthropometry. Cleft Palate Craniofac J. 1998;35:9–15. doi: 10.1597/1545-1569_1998_035_0009_peoaet_2.3.co_2. [DOI] [PubMed] [Google Scholar]
- Goodlett CR, Horn KH. Mechanisms of alcohol-induced damage to the developing nervous system. Alcohol Res Health. 2001;25:175–184. [PMC free article] [PubMed] [Google Scholar]
- Goodlett CR, Horn KH, Zhou FC. Alcohol teratogenesis: mechanisms of damage and strategies for intervention. Exp Biol Med. 2005;230:394–406. doi: 10.1177/15353702-0323006-07. [DOI] [PubMed] [Google Scholar]
- Green ML, Singh AV, Zhang Y, Nemeth KA, Sulik KK, Knudsen TB. Reprogramming of Genetic Networks During Initiation of the Fetal Alcohol Syndrome. Devel Dynamics. 2007;236:613–631. doi: 10.1002/dvdy.21048. [DOI] [PubMed] [Google Scholar]
- Hoyme HE, May PA, Kalberg WO, Kodituwakku P, Gossage JP, Trujillo PM, Buckley DG, Miller JH, Aragon AS, Khaole N, et al. A practical clinical approach to diagnosis of fetal alcohol spectrum disorders: clarification of the 1996 institute of medicine criteria. Pediatrics. 2005;115:39–47. doi: 10.1542/peds.2004-0259. [DOI] [PMC free article] [PubMed] [Google Scholar]
- Hurwitz DJ, Ashby ER, Llull R, Pasqual J, Tabor C, Garrison L, Gillen J, Weyant R. Computer-assisted anthropometry for outcome assessment of cleft lip. Plast Reconstr Surg. 1999;103:1608–1623. doi: 10.1097/00006534-199905060-00007. [DOI] [PubMed] [Google Scholar]
- Jones KL, Smith DW. Recognition of the fetal alcohol syndrome in early infancy. Lancet. 1973;2:999–1001. doi: 10.1016/s0140-6736(73)91092-1. [DOI] [PubMed] [Google Scholar]
- Khisti RT, Wolstenholme J, Shelton KL, Miles MF. Characterization of the ethanol-deprivation effect in substrains of C57BL/6 mice. Alcohol. 2006;40:119–126. doi: 10.1016/j.alcohol.2006.12.003. [DOI] [PMC free article] [PubMed] [Google Scholar]
- Loock C, Conry J, Cook JL, Chudley AE, Rosales T. Identifying fetal alcohol spectrum disorder in primary care. CMAJ. 2005;172:628–630. doi: 10.1503/cmaj.050135. [DOI] [PMC free article] [PubMed] [Google Scholar]
- Moore ES, Ward RE, Jamison PL, Morris CA, Bader PI, Hall BD. The subtle facial signs of prenatal exposure to alcohol: an anthropometric approach. J Pediatrics. 2001;139:215–219. doi: 10.1067/mpd.2001.115313. [DOI] [PubMed] [Google Scholar]
- Moore ES, Ward RE, Jamison PL, Morris CA, Bader PI, Hall BD. New perspectives on the face in fetal alcohol syndrome: what anthropometry tells us. Am J Med Genet. 2002;109:249–260. doi: 10.1002/ajmg.10197. [DOI] [PubMed] [Google Scholar]
- Moore ES, Ward RE, Wetherill LF, Rogers JL, Autti-Ramo I, Fagerlund A, Jacobson SW, Robinson LK, Hoyme HE, Mattson SN, Foroud T. Unique facial features distinguish fetal alcohol syndrome patients and controls in diverse ethnic populations. Alcohol Clin Exp Res. 2007;31:1707–1713. doi: 10.1111/j.1530-0277.2007.00472.x. [DOI] [PubMed] [Google Scholar]
- Ogawa T, Kuwagata M, Ruiz J, Zhou FC. Differential teratogenic effect of alcohol on embryonic development between C57BL/6 and DBA/2 mice: a new view. Alcohol Clin Exp Res. 2005;29:855–863. doi: 10.1097/01.alc.0000163495.71181.10. [DOI] [PubMed] [Google Scholar]
- Parnell SE, Dehart DB, Wills TA, Chen SY, Hodge CW, Besheer J, Waage-Baudet HG, Charness ME, Sulik KK. Maternal oral intake mouse model for fetal alcohol spectrum disorders: ocular defects as a measure of effect. Alcohol Clin Exp Res. 2006;30:1791–1798. doi: 10.1111/j.1530-0277.2006.00212.x. [DOI] [PubMed] [Google Scholar]
- Parnell SE, O’Leary-Moore SK, Godin EA, Dehart DB, Johnson BW, Allan Johnson G, Styner MA, Sulik KK. Magnetic Resonance Microscopy Defines Ethanol-Induced Brain Abnormalities in Prenatal Mice: Effects of Acute Insult on Gestational Day 8. Alcohol Clin Exp Res. 2009;33(6):1001–11. doi: 10.1111/j.1530-0277.2009.00921.x. [DOI] [PMC free article] [PubMed] [Google Scholar]
- Petkov PM, Ding Y, Cassell MA, Zhang W, Wagner G, Sargent EE, et al. An efficient SNP system for mouse genome scanning and elucidating strain relationships. Genome Res. 2004;14(9):1806–11. doi: 10.1101/gr.2825804. [DOI] [PMC free article] [PubMed] [Google Scholar]
- Prevention, CDC. Fetal Alcohol Syndrome: Guidelines for Referral and Diagnosis. Atlanta, GA: Centers for Disease Control and Prevention; 2004. [Google Scholar]
- Sokol RJ, Delaney-Black V, Nordstrom B. Fetal alcohol spectrum disorder. JAMA. 2003;290:2996–2999. doi: 10.1001/jama.290.22.2996. [DOI] [PubMed] [Google Scholar]
- Stratton KM, Howe C, Battaglia F, editors. Fetal Alcohol Syndrome: Diagnosis, Epidemiology, Prevention, and Treatment. Institute of Medicine. National Academy Press; Washington, D.C: 1996. [Google Scholar]
- Streissguth AP, Aase JM, Clarren SK, Randels SP, LaDue RA, Smith DF. Fetal alcohol syndrome in adolescents and adults. JAMA. 1991;265:1961–1967. [PubMed] [Google Scholar]
- Sulik KK. Critical periods for alcohol teratogenesis in mice, with special reference to the gastrulation stage of embryogenesis. Ciba Found Symp. 1984;105:124–141. doi: 10.1002/9780470720868.ch8. [DOI] [PubMed] [Google Scholar]
- Sulik KK. Genesis of alcohol-induced craniofacial dysmorphism. Exp Biol Med. 2005;230:366–375. doi: 10.1177/15353702-0323006-04. [DOI] [PubMed] [Google Scholar]
- Sulik KK, Johnston MC, Daft PA, Russell WE, Dehart DB. Fetal alcohol syndrome and DiGeorge anomaly: critical ethanol exposure periods for craniofacial malformations as illustrated in an animal model. Am J Med Genet Suppl. 1986;2:97–112. doi: 10.1002/ajmg.1320250614. [DOI] [PubMed] [Google Scholar]
- Zhou FC, Sari Y, Powrozek T, Goodlett CR, Li TK. Moderate alcohol exposure compromises neural tube midline development in prenatal brain. Brain Res. 2003;144:43–55. doi: 10.1016/s0165-3806(03)00158-5. [DOI] [PubMed] [Google Scholar]
Associated Data
This section collects any data citations, data availability statements, or supplementary materials included in this article.