Abstract
Background
Hemodynamic load regulates myocardial function and gene expression. We tested the hypothesis that afterload and preload despite similar average load result in different phenotypes.
Methods and Results
Afterload and preload were compared in mice with transversal aortic constriction (TAC) and aorto-caval shunt (Shunt). When compared to sham mice, six hours after surgery, systolic wall stress (afterload) was increased in TAC (+40%, P<0.05), diastolic wall stress (preload) was increased in Shunt (+277%, P<0.05) and TAC (+74%, P<0.05) and mean total wall stress was similarly increased in TAC (69%) and Shunt (67%) (TAC vs. Shunt: not significant (n.s.), each P<0.05 vs. Sham). At 1 week, left ventricular weight/tibia length was significantly increased by 22% in TAC and 29% in Shunt (n.s. TAC vs. Shunt). After 24 hours and 1 week, calcium/calmodulin dependent protein kinase II (CaMKII) signaling was increased in TAC. This resulted in altered calcium cycling, including increased L-type calcium current, calcium transients, fractional SR release and calcium spark frequency. In Shunt, Akt phosphorylation was increased. TAC was associated with inflammation, fibrosis and cardiomyocyte apoptosis. The latter was significantly reduced in CaMKIIδ-KO TAC mice. 157 mRNAs and 13 microRNAs were differentially regulated in TAC vs. Shunt. After 8 weeks, fractional shortening was lower and mortality higher in TAC
Conclusions
Afterload results in maladaptive fibrotic hypertrophy with CaMKII-dependent altered calcium cycling and apoptosis. Preload is associated with Akt activation without fibrosis, little apoptosis, better function and lower mortality. This indicates that different loads result in distinct phenotype differences which may require specific pharmacological interventions.
Keywords: heart failure, preload, afterload, CaM kinase II, hemodynamic, remodeling, apoptosis
Introduction
In the heart, hemodynamic load is a critical regulator of myocardial function, gene expression and phenotype appearance.1 Specific structures involved in perception of hemodynamic load have been identified and influencing or deleting these structures has been associated with cardiac dysfunction and disease.2 Two types of load can be differentiated. Preload builds up during diastolic filling and stretches cardiomyocytes. This results in immediate recruitment of contractile units and increased cardiac performance through the Frank-Starling mechanism. In addition, proteins such as titin and associated molecules are stretched with subsequent effects on myocardial elasticity and gene expression.3 Systolic force matching afterload is generated by each cardiomyocyte to produce cardiac stroke work against vascular resistance. This is accomplished by the contractile protein complex. During ejection preload declines and titin is unloaded. Both preload and afterload influence load-dependent ion channels and intracellular ion concentrations,4 which in turn may also influence cardiac function and gene expression. From a hemodynamic point of view, afterload-mediated concentric hypertrophy was considered beneficial because of stress compensation through increased wall thickness according to the law of Laplace.5 In contrast, preload-mediated eccentric hypertrophy was considered maladaptive because of uncompensated wall stress. However, cardiac geometry and macroscopic phenotype are only one aspect. Myocardial hypertrophic phenotype, i.e. the protein composition of the myocardium is another, and there is good evidence that the latter may be more relevant regarding transition to heart failure.6
In previous studies in isolated muscle preparations we showed that preload and afterload differentially regulate expression of fetal genes.7,8 The present study was performed to compare differences in phenotypes, signalling and gene expression of preload and afterload induced hypertrophy in vivo. Therefore we used the aorta-vena cava mouse fistula model (Shunt) which generates volume overload and predominantly increased preload and the transversal aortic constriction model (TAC) which generates pressure overload and reflects increased afterload. Shunt and TAC were graded to match average load measured as average left ventricular wall stress. Our data show that eccentric hypertrophy in Shunt is more beneficial than concentric hypertrophy in TAC with increased inflammation, fibrosis and cardiomyocyte apoptosis. Shunt is associated with Akt activation while TAC is associated with altered calcium cycling and calcium/calmodulin-dependent protein kinase II (CaMKII)9 activation.
Methods & Material
Only a short description of material and methods is given here. An expanded version can be found in the online supplement.
Animal experiments and in vivo characterisation
The investigation conforms to the Guide for the Care and Use of Laboratory Animals (NIH publication No. 85–23, revised 1996). In 12 week old female mice volume overload was induced by the creation of a shunt between aorta and vena cava inferior. Pressure overload was induced by transverse aortic constriction. Female mice were used because of high mortality in male mice. Echocardiography, in-vivo hemodynamic measurements, cardiomyocyte isolation, cardiomyocyte shortening, calcium measurements and patch-clamp experiments were performed with standard protocols.
Molecular Analysis
Protein and gene expression were measured with standard protocols of western immunoblots and quantitative realtime-PCR (Biorad iQ-Cycler). Fibrosis, cardiomyocyte apoptosis and inflammation were quantified in histological sections. For measurement of the cell cycle rate 3H-Thymidine autoradiography was measured. The 11.0 miRCURY LNA™ microRNA array (Exiqon, Denmark) was used for microRNA and the Affymetrix mouse 430 2.0 GeneChip array for gene expression analysis. Gene expression microarray data have been deposited in the ArrayExpress database (accession number E-MEXP-2498).
Calculation and statistical analysis
Data are presented as mean ± SEM. P<0.05 was considered statistically significant. Gene- and protein-expression and electrophysiological experiments were statistically analyzed using unpaired Student t test, one-way ANOVA on Ranks (Dunn's method) or one-way ANOVA followed by Tukey's post-hoc test, where appropriate. Survival was analysed by Kaplan-Meier and by Fisher's test. Wall stress was calculated according the law of Laplace. Raw microarray data were imported into R-version 2.9.1 and analyzed with Bioconductor packages. Pathway analysis was performed taking the gene set enrichment analysis approach using the Category and GSEABase Bioconductor packages querying the Kyoto Encyclopedia of Genes and Genomes pathway database (For references see the statistical section of the supplementary data). The numbers of animals or cells are shown in the figure legends in the following order: n=Sham-TAC/TAC/Sham-Shunt/Shunt.
Results
Hemodynamic function and wall stress
Conductance catheter pressure volume analysis 6 hours after respective surgical procedures (Figure 1A) showed that left ventricular systolic pressure was increased in TAC (+41%, p<0.05) and left ventricular end-diastolic pressure and volume in Shunt (+97%, P<0.05; Suppl. Figure I). Wall stress was calculated at four time points during the cardiac cycle (mid-systolic, end-systolic, mid-diastolic, end-diastolic, Suppl. Figure IIA). In TAC mid-systolic wall stress was increased by 40% (P<0.05, Suppl. Figure IIB), end-diastolic wall stress was increased by 277% in Shunt (P<0.05) and by 74% in TAC (each P<0.05; Suppl. Figure IIE). Mean total wall stress during one cardiac contraction-relaxation cycle yielded similar values for TAC and Shunt (TAC: 69%, Shunt: 67%, each P<0.05 vs. Sham, Figure 1B), which indicates similar average load elevation immediately after surgery in both models. Echo measurements 24 hours after intervention confirmed left ventricular dilatation in Shunt by increased LVEDD (P<0.05) whereas fractional shortening was not changed at this time point (Suppl. Figure III).
Fig. 1.
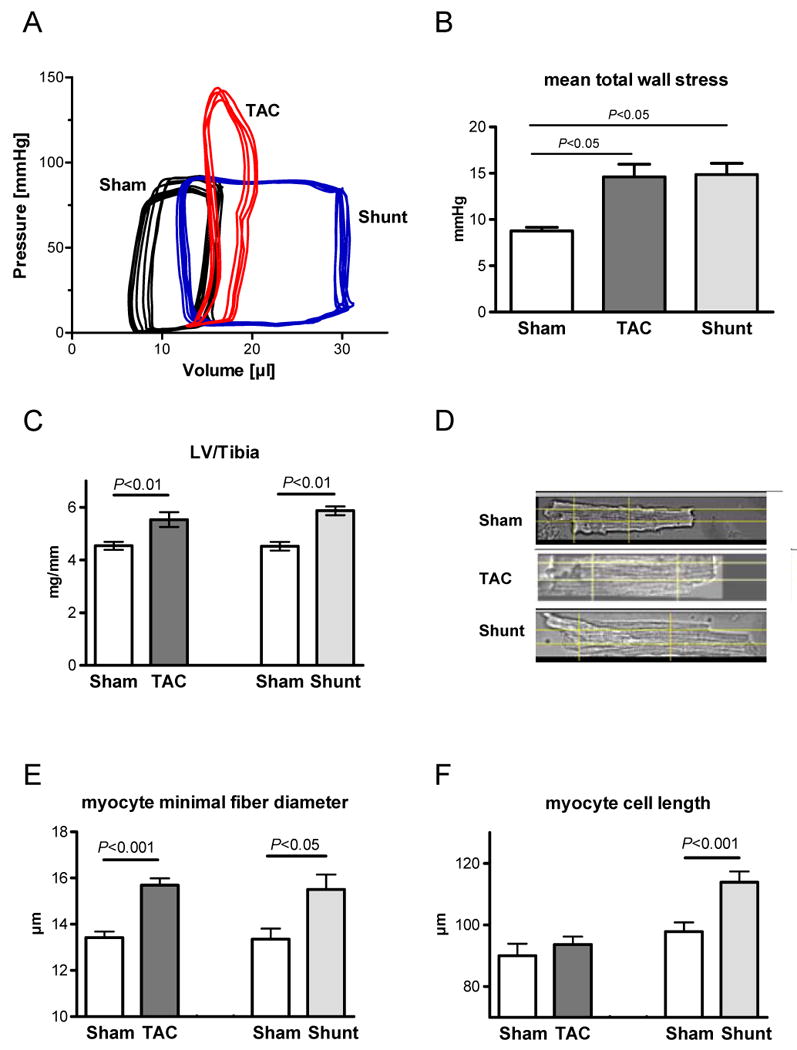
Hemodynamics in Sham, TAC and Shunt 6 hours after intervention (A,B) and hypertrophy 7 days after intervention (C-F). A) Examples of pressure-volume-loops B) mean total wall stress (n=3 pre group); C) Left ventricular weight normalised to tibia length 7 days after intervention (n=8/10/6/6); D) example of single cardiomyocytes isolated 7 days after intervention; E) cell width measured by minimal fiber diameter (animals: n=5/6/5/6); F) cell length measured in isolated cardiomyocytes (animals: n=5/7/4/4).
Remodeling and left ventricular hypertrophy
After one week, left ventricular hypertrophy as indicated by left ventricular weight per tibia length (LV/TibiaL) was increased similarly in both models, being concentric in TAC and eccentric in Shunt (TAC: +22%; Shunt: +29%, each P<0.01, TAC vs. Shunt: P=n.s.; Figure 1C). Cardiomyocyte minimal diameter was increased in both models, whereas cardiomyocyte length only in Shunt (Figure 1D-F). Echochardiographic characterisation is shown in the supplement (Suppl. Figure IV). At this time point myocardial function was not reduced in both models (Suppl. Figure IVD).
Hypertrophy in TAC was associated with a significant increase in myocardial fibrosis (perivascular fibrosis +490%, P<0.01; Figure 2A+B). Cell cycle rate showed a clear increase in TAC in the non-cardiomyocytes but not in Shunt (Figure 2A; for discrimination of cardiomyocytes and non-cardiomyocytes nuclear-ßGAL-transgenic mice were used). This suggests that increased fibrosis in TAC resulted in part from fibroblast proliferation. In addition, inflammation was increased in TAC by 114% (P<0.001, Figure 2A+C). In Shunt fibrosis and inflammation were not elevated (Figure 2A+B+C). Cardiomyocyte apoptosis was elevated both in TAC and Shunt, but it was significantly higher in TAC (Figure 2D-F).
Fig. 2.
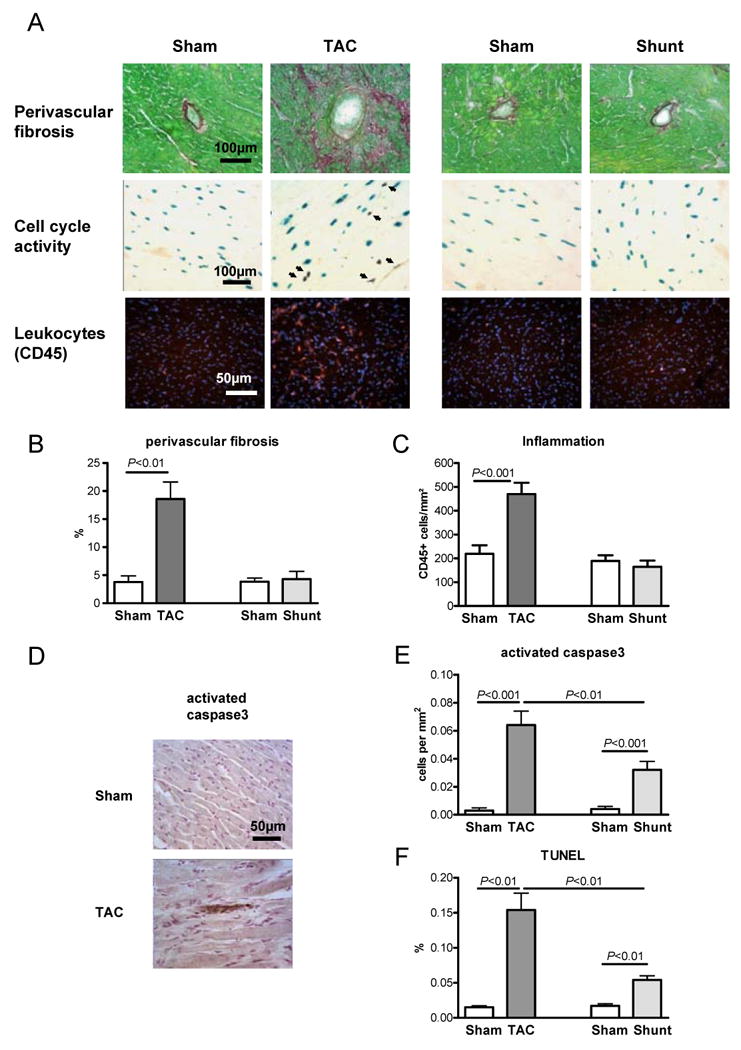
Histological analysis of Sham, TAC and Shunt animals 7 days after intervention (n=5/6/5/6). A) Histological sections of staining for fibrosis (Sirius Red), cell cycle rate (3H-Thymidine injection in α-MHC-nLAC transgenic mice; blue show cardiomyocyte nuclei, black indicates cell cycle activity) and inflammation (anit-CD45 immunohistochemestry, red = leucoytes, blue = Cell nuclei); B) bar graphs showing perivascular fibrosis; C) bar graphs showing inflammation; D) example of active caspase3 staining in Sham and TAC; E) cardiomyocyte apoptosis rate by activated caspase3 staining; F) apoptosis rate by TUNEL (number of positive cells per 100 nuclei)
Long-term myocardial function and mortality
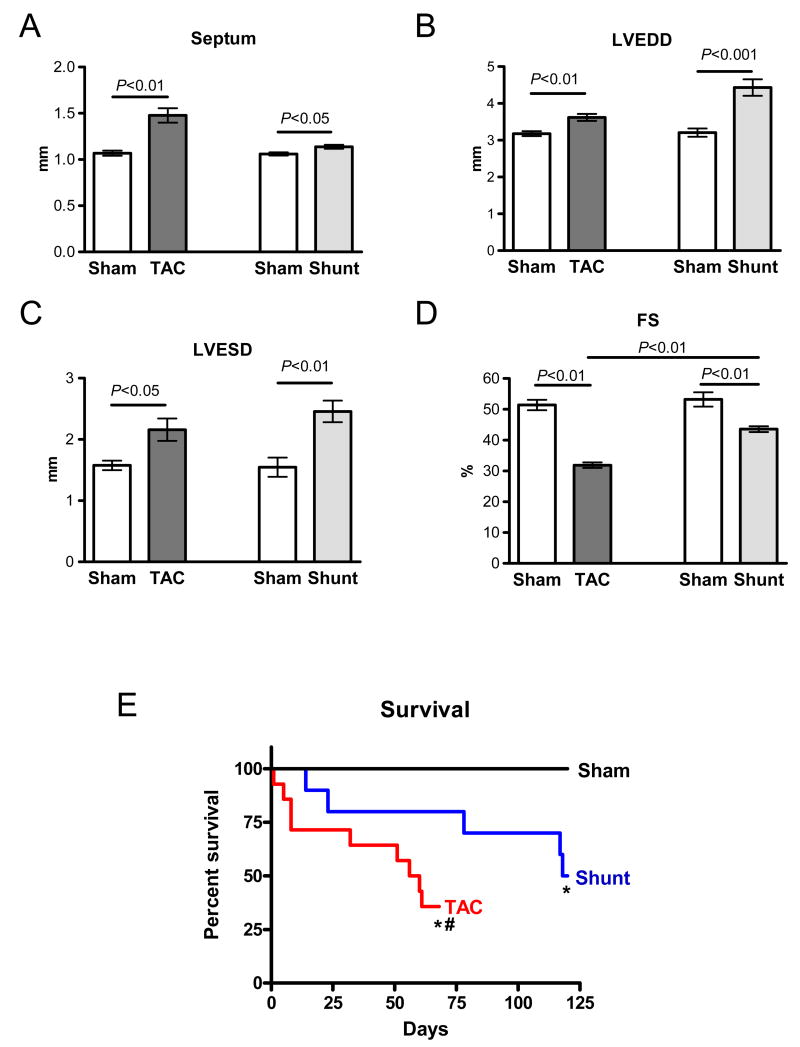
8 weeks of increased load was associated with a moderate increase in septum thickness in Shunt (+7%, P<0.05), and a large increase in TAC (+39%, P<0.01, Figure 3A). End-diastolic diameter was increased in TAC by 14% (P<0.05) and in Shunt by 38% (P<0.01, Figure 3B). Fractional shortening was considerably reduced in TAC (-38%, P<0.01), while it was only slightly reduced in Shunt (-18%, P<0.01 vs. Sham, P<0.01 vs. TAC, Figure 3D). After 8 weeks the percentage of surviving animals was significantly lower in TAC (4/13) than in Shunt (7/10; P<0.05). Also in Kaplan-Meier analsyis mortality was higher in TAC versus Shunt mice (P<0.05; Figure 3E).
Fig. 3.
Echocardiographic measurements 8 weeks after intervention and survival in Sham, TAC and Shunt: A) Septum width; B) left ventricular end-diastolic diameter (LVEDD); C) left ventricular end-systolic diameter (LVESD); D) Fractional shortening (FS); E) Kaplan-Meier-survival in TAC and Shunt (* P<0.01 vs. Sham; # P<0.05 vs. Shunt)
Load-dependent regulation of gene expression and signal transduction pathways
Left ventricular gene expression and protein phosphorylation were analysed 24 hours and 7 days after intervention to show persistent activation (Table 1+2). BNP was upregulated at both time points only in TAC occurred already after 24 hours. (24 hours: +507% P<0.05, 7days: +384%, P<0.05, Table 1). An isoform shift from α-MHC to β-MHC at these time point occurred in the TAC but not in the Shunt model (Table 1). Upregulation of ß-MHC gene expression in TAC occurred after 24 hours. The expression of SERCA and the other calcium regulated proteins was not changed at 24 hours and 7 days after intervention in both models with the exception of a transient upregulation of NCX in TAC (Table 1).
Table 1. Expression of hypertrophic genes in TAC and Shunt.
mRNA expression of hypertrophy associated and calcium regulating proteins in TAC and Shunt 24 hours (n=6/6/6/7) and 7 days (n=8/10/7/7) after intervention. Changes are normalised to the corresponding Sham
| 24h | 7d | |||
|---|---|---|---|---|
| TAC | Shunt | TAC | Shunt | |
| BNP/GAPDH | 507.3±159.7%* | 41.2±51.1% | 383.9±63.3%* | 44.2±30.6% |
| α-MHC/GAPDH | -0.8±29.4% | -3.9±29.1% | -41.9±16.7%* | -17.5±20.5% |
| β-MHC/GAPDH | 81.3±27.5%* | 14.3±25.0% | 229.3±71.1%+ | 17.6±32.1% |
| SERCA/GAPDH | -15.5±8.9% | -1.7±6.7% | -17.7±9.8% | -12.8±7.9% |
| PLB/GAPDH | 0.3±1.1% | -12.4±8.1% | -0.0±0.5% | -16.3±11.8% |
| NCX/GAPDH | 32.8±12.4%* | 7.1±13.8% | 17.3±13.9% | 3.2±11.6% |
| RYR2/GAPDH | -10.1±11.9% | -6.7±11.3% | -21.9±10.5% | -15.6±10.3% |
P<0.05;
P<0.01
Table 2. Activation of signal pathways in TAC and Shunt.
Activation of signal pathways in TAC and Shunt 24 hours and 7 days after intervention. Changes are expressed relative to the corresponding Sham (n=6 per group);
| 24h | 7d | |||
|---|---|---|---|---|
| TAC | Shunt | TAC | Shunt | |
| P-CaMKII/GAPDH | 77.5±28.1%* | -8.9±18.6% | 81.5±32.6%* | -20.0±16.7% |
| CaMKII/GAPDH | 23.7±9.1% | -10.0±14.3% | 23.7±9.1%* | -10.0±14.3% |
| P-CaMKII/CaMKII | 66.3±22.9%+ | 3.3±22.3% | 28.6±22.9% | -9.2±16.4% |
| P-Akt/Akt | 9.3±18.5% | 70.2±30.4%* | 22.3±18.5% | 41.3±17.8%* |
| P-p38/GAPDH | 8.1±20.4% | 44.7±18.4%* | 15.8±19.9% | -20.6±14.0% |
| p38/GAPDH | -26.0±12.4% | -23.1±9.6%* | -35.1±8.9%* | -29.4±12.4%* |
| P-p38/p38 | 47.8±19.7%* | 124.5±36.7%+ | 92.9±30.0%* | 0.6±13.7% |
| P-ERK/ERK | 74.3±29.2%* | 4.2±19.5% | -61.4±23.6%* | 17.5±35.4% |
| P-JNK/JNK | 0.1±25.4% | 0.1±15.1% | -50.7±36.0% | 82.3±38.5% |
| P-HDAC/CS | 107.4±37.8%* | 7.7±17.4% | ||
| P-GSK3ß/GSK3ß | 4.0±9.5% | 26.3±11.3%* | -7.1±11.9% | -8.3±16.2% |
| MCIP/GAPDH | -7.6±2.1% | 3.1±4.0% | 454.7±105.3%* | 55.3±46.7% |
P<0.05;
P<0.01
Normalization is done per GAPDH or per calsequestrin (CS) or per respective protein
CaMKII, histone deacytelase, Akt, GSK3ß and mitogene activated protein kinase expression and activation were measured with specific antibodies as well as with phosphospecific antibodies (Suppl. Figure V+VI). If protein expression was not altered the ratio of phosphorylated protein to total protein is shown. When total protein expression was altered, phosphorylated protein normalised to GAPDH as well as phosphorylated protein to total protein and total protein expression to GAPDH is shown. An absolute increase of phosphorylated protein is considered to reflect increased biological activity.
Increased biological activity at 24 hours and 7 days were only seen for CaMKII and Akt. In TAC the biological CaMKII activity was increased after 24 hours and 7 days by 78% and 82%, respectively (Figure 4A+B, Table 2). None of these changes were observed in Shunt (Figure 4A+B, Table 2), while Akt phosphorylation was increased in Shunt exclusively (24 hours: +70%, P<0.05; 7 days: 41%, p<0.05, Table 2).
Fig. 4.
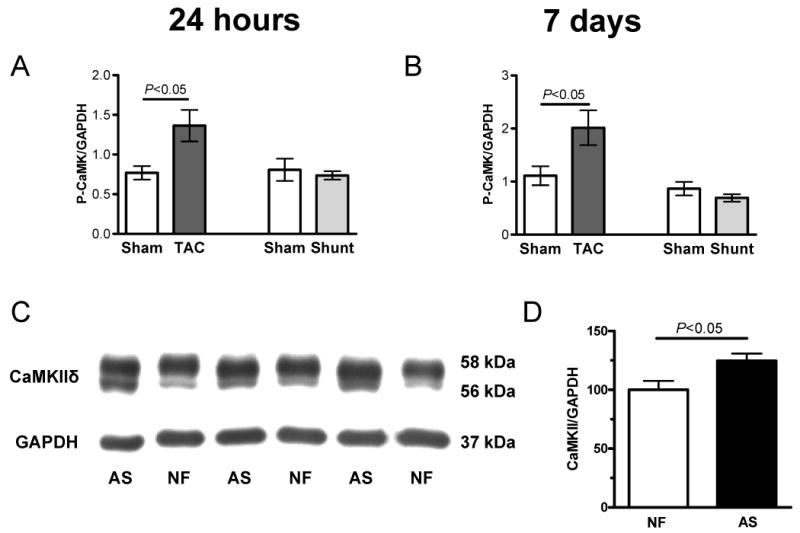
Activation of signal pathways in Sham, TAC and Shunt 24 hours and 7 days after intervention (n=6 per group). A+B) phsophorylated CaMKII expression to GAPDH (A: 24h, B: 7d after intervention) C+D) CaMKII expression normalized to GAPDH in human nonfailing (NF) vs. aortic stenosis samples (AS; n=6 per group)
The other kinases studied were not consistently activated at 24 hours and 7 days: p38 phosphorylation but not total biological activity was increased at both time points in TAC (Table 2). Changes in ERK phosphorylation occurred also only in TAC (24 hours: +74%, P<0.05, 7 days: -61%, P<0.05, Table 2). Also, HDAC phosphorylation was increased only in TAC (Table 2). GSK3β phosphorylation was increased in Shunt after 24 hours (+26%, P<0.05, Table 2). mRNA expression of MCIP as an indicator of calcineurin activity was selectively upregulated after 7 days in TAC (MCIP: +454%, P<0.05, Table 2).
Analysis of left ventricular human heart samples from patients with aortic stenosis exhibiting myocardial hypertrophy but still preserved cardiac function (see online Material & Methods) showed an increase in CaMKIIδ expression as compared with samples form control hearts that were not hypertrophied. (+24.7±9.7%, Figure 4C+D).
Gene array analysis
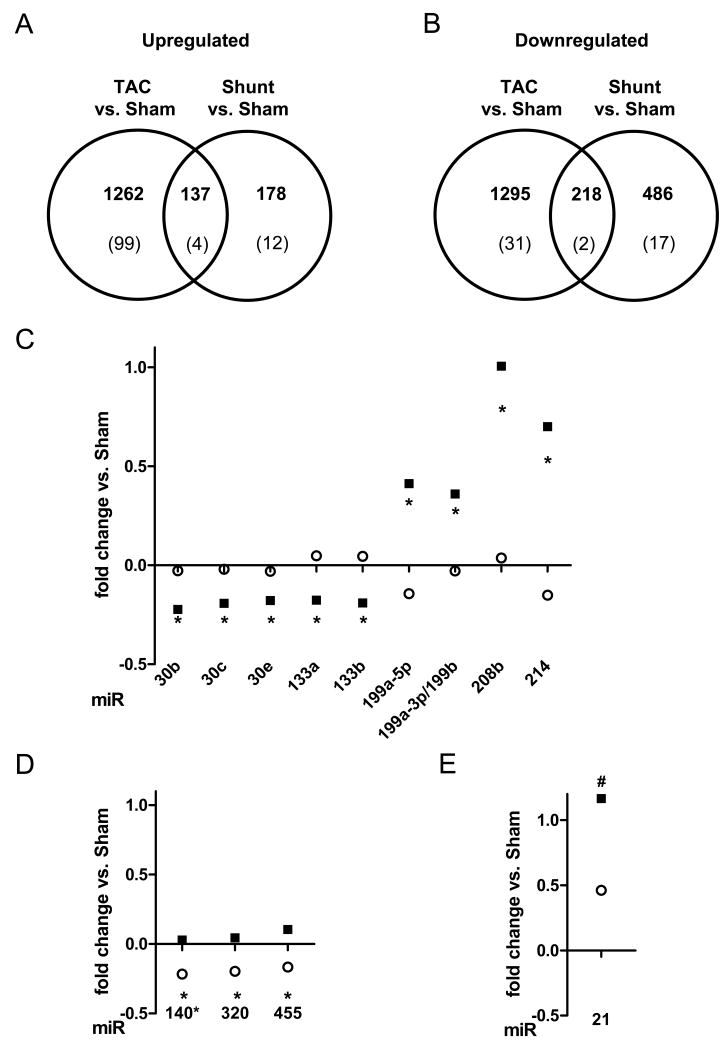
To further define the molecular signature of the two load models, we performed genome-wide expression profiling. Applying a moderated linear model and the false discovery rate (FDR) method for multiple testing with a threshold of 5% resulted in 1399 (1954 probes sets) upregulated and 1513 (1896 probes sets) downregulated annotated genes in TAC compared to sham. In shunt compared to sham 315 (384 probes sets) upregulated and 704 (853 probes sets) downregulated annotated genes were identified (Figure 5A+B, Suppl. Table I+II). Comparing the differences between TAC and Shunt directly (up or down) resulted in 157 differentially expressed genes (187 probes sets; Suppl. Table III). Unsupervised hierarchical clustering of these 157 genes (187 probes sets) resulted in accurate identification of the cardiac gene expression profiles of individual animals in the appropriate groups (Suppl. Figure VII). Of the candidate genes identified by protein analysis above, an increased expression of CaMKIIδ was selectively found in TAC but not in Shunt. Out of the 157 differentially expressed genes, 122 were only regulated in TAC, 21 only in shunt and 14 were significantly regulated in both models. Out of the 14 genes 6 were regulated in parallel but to a different amount and 8 in an opposite direction (brain derived neurotrophic factor; protein phosphatase 1B, magnesium dependent, beta isoform; c-myc binding protein; RIKEN cDNA 1190002N15 gene; phosphodiesterase 4D interacting protein (myomegalin); serine/threonine kinase 38 like; amine oxidase, copper containing 3; B and T lymphocyte associated).
Fig. 5.
Analysis of gene and microRNA expression by microarrays 7 days after intervention: A+B) number of differentially expressed genes in TAC and Shunt and between both models (n=4 per group). Lower numbers indicated the number of genes with a significant regulation between invervention and sham as well as between both models; A) upregulated genes; B) downregulated genes. C-E) Analysis of microRNA-expression by microarrays (n=5 per group) after 7 days in TAC (■) and Shunt (○). Only microRNAs with a significant different expression between TAC and Shunt are shown (TAC vs. Shunt: * p<0.01, # p<0.02); C) microRNAs significantly regulated in TAC vs. Sham (p<0.01) D) microRNAs significantly regulated in Shunt vs. Sham (p<0.01); E) microRNA significantly regulated in TAC and Shunt to the corresponding sham (p<0.01)
Furthermore, pathway analysis revealed 90 pathways selectively regulated in TAC, ten pathways similarly regulated in TAC and Shunt and four pathways selectively regulated in Shunt (Suppl. Table IV+V). We confirmed cardiomyocyte apoptosis, inflammation, increased cell cycle activity and fibrosis in the pathway analysis confined to the TAC model. Amongst the selectively regulated pathways in Shunt activation of the Wnt signaling is of special interest (Table 3).
Table 3. Gene array findings of special interest.
Selected findings form the gene array. Total results are shown in suppl. Table I-V
| ID | Name | TAC | Shunt |
|---|---|---|---|
| 1433761_at | phosphodiesterase 4D interacting protein (myomegalin) | ↑ | ↓ |
| 1439168_at | calcium/calmodulin-dependent protein kinase II, delta | ↑ | n.s. |
| X04310 | Wnt signaling pathway | n.s. | ↑ |
| inflammation | |||
| X04650 | Natural killer cell mediated cytotoxicity | ↑ | n.s. |
| X04660 | T cell receptor signaling pathway | ↑ | n.s. |
| X04662 | B cell receptor signaling pathway | ↑ | n.s. |
| X04670 | Leukocyte transendothelial migration | ↑ | n.s. |
| cell cycle activitiy | |||
| X03030 | DNA replication | ↑ | n.s. |
| X04110 | Cell cycle | ↑ | n.s. |
| apoptosis | |||
| X04210 | Apoptosis | ↑ | n.s. |
| X04115 | p53 signaling pathway | ↑ | n.s. |
| fibrosis | |||
| X04512 | ECM-receptor interaction | ↑ | n.s. |
| X04514 | Cell adhesion molecules (CAMs) | ↑ | n.s. |
Load dependent regulation of microRNAs
The expression of microRNAs was evaluated in both models. At 24 hours none of the microRNAs assayed by microarray exhibited differential expression between the experimental groups. Following 7 days of subjection to load we identified 13 microRNAs differentially regulated between TAC and Shunt. Of these 9 were selectively regulated in TAC, 3 microRNAs selectively in Shunt, and 1 was regulated in parallel but at significantly different amounts in both models (Figure 5C-E)
Single cell function
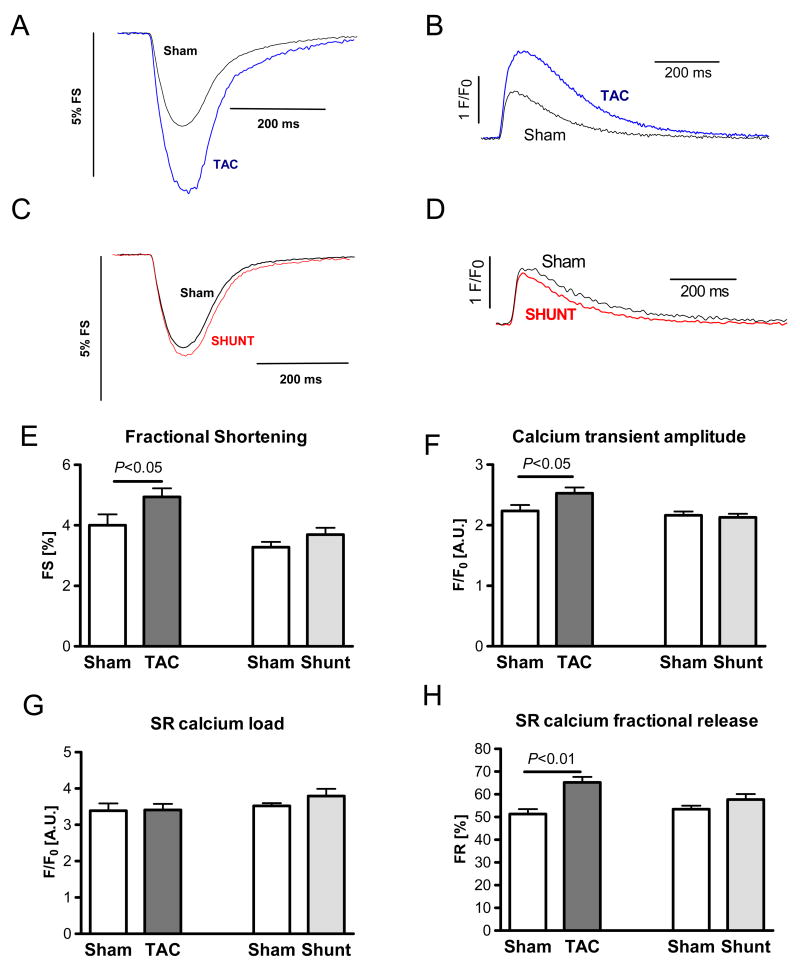
7 days after intervention, increased cardiomyocyte fractional shortening (+24%, P<0.05) and intracellular calcium transients (+13% P<0.05) were seen at 1 Hz stimulation rate in TAC (Figure 6A+B+E+F). SR calcium load was unchanged while fractional SR calcium release was significantly increased in TAC by 27% (Figure 6G+H). In contrast, in cardiomyocytes from Shunt mice, fractional shortening and calcium cycling were not different from Sham (Figure 6C-H).
Fig. 6.
Single cell function in Sham, TAC and Shunt 7 days after intervention A+C) Example of fractional shortening of cardiomyocytes from TAC (A) and Shunt (C) animals compared to Sham; B+D) Example of calcium transients of cardiomyocytes from TAC (B) and Shunt (D) animals compared to Sham; E) Fractional shortening (number of cells: 36/44/59/55); F) calcium transient amplitude (F/F0) (number of cells: 36/44/59/55); G) SR-calcium content measured by caffeine application (number of cells: 29/36/39/24); H) Fractional SR calcium release measured as calcium transient per SR calcium load (number of cells: 28/32/39/24).
Mechanisms underlying the observed alteration in calcium cycling in TAC were studied in detail. The increase in SR calcium fractional release was clearly CaMKII-dependent since KN-93, a CaMKII inhibitor normalizes SR calcium fractional release (Figure 7A). The enhancement of fractional SR calcium release in TAC could be due to increased L-type calcium current or increased ryanodine receptor (RYR) sensitivity, both being regulated by CaMKII.9 Calcium spark frequency as an estimate of the ryanodine receptor sensitivity was largely increased in TAC (+206% P<0.001, Figure 7B+C). Measurement of action potentials as an indicator of calcium influx showed a prolongation of the duration (APD90) in TAC compared to Sham (P<0.001, Figure 7D+E). This prolongation could be abolished by CaMKII-inhibition with AIP (P<0.001) or L-type calcium channel inhibition with nifedipine (P<0.001, Figure 7D+E). Furthermore, direct measurement of L-type calcium current showed a significant increase in TAC vs. Sham (P<0.05) which could be normalized by addition of the CaMKII-inhibitor AIP (P<0.05; Figure 7F+G). This indicates that increased L-type calcium current is the primary mechanism of the APD prolongation and suggests that increased fractional release results from both increased L-type current as well as increased RYR sensitivity.
Fig. 7.
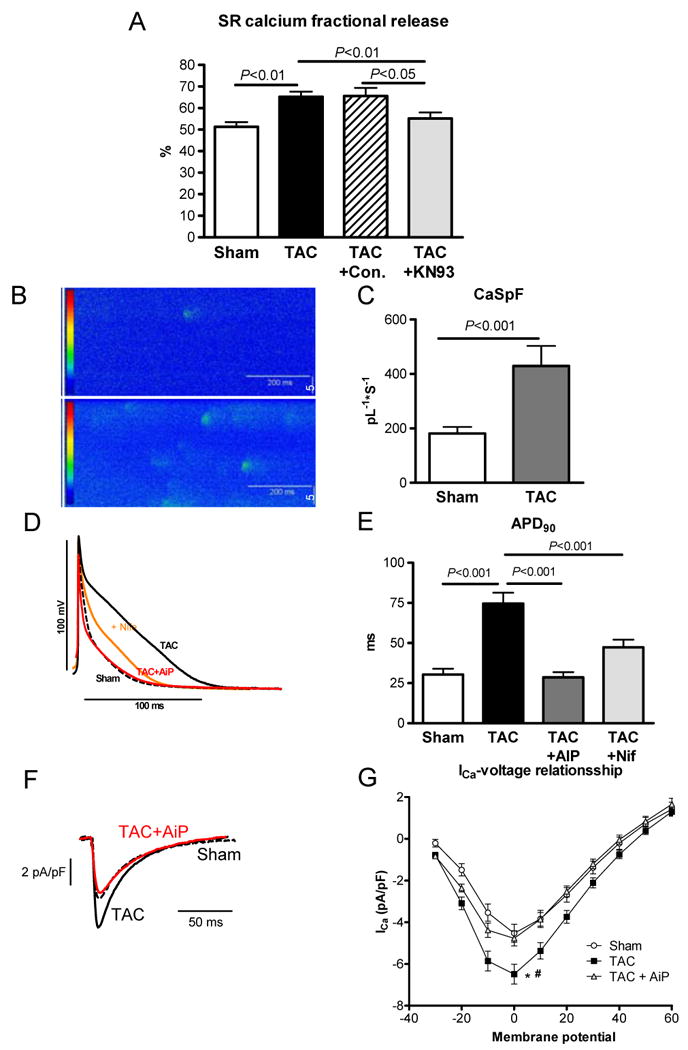
Role of CaMK in TAC induced calcium cycling alteration 7 days after intervention; A) Fractional SR calcium release in Sham, TAC, TAC+control (KN92) and TAC+KN93 (CaMK-Inhibitor) (number of cells: 28/32/14/16); B) example of calcium spark measurement in Sham and TAC; C) spark frequency in Sham and TAC (number of cells: 17/20); D) Original recordings of action potential measurements in Sham (dotted line), TAC (black line), TAC+AiP (CaMKII-inhibition, red line) and TAC+Nifedipine (orange line); E) Action potential duration (APD90) in Sham, TAC, TAC+AiP (CaMKII-inhibition) and TAC+Nifedipine (number of cells: 16/52/10/16). F) Original recordings of L-type Ca2+ current in Sham, TAC and TAC+AiP (CaMKII-inhibition) at 0mV. G) L-type Ca2+ current in Sham, TAC and TAC+AiP (number of cells: 11/13/16, * p<0.05 in Sham vs. TAC; # p<0.05 TAC vs. TAC+AiP)
Analysis of CaMKIIδ-KO mice
To better understand the role of the CaMKII activation in pressure overload hypertrophy we used the CaMKIIδ-KO mouse model.10 One week after TAC the amount of perivascular fibrosis was similarly increased in WT and KO (Figure 8A+B). However, the amount of cardiomyocyte apoptosis after TAC was significantly lower in the KO compared to the WT hearts (P<0.01; Figure 8C).
Fig. 8.
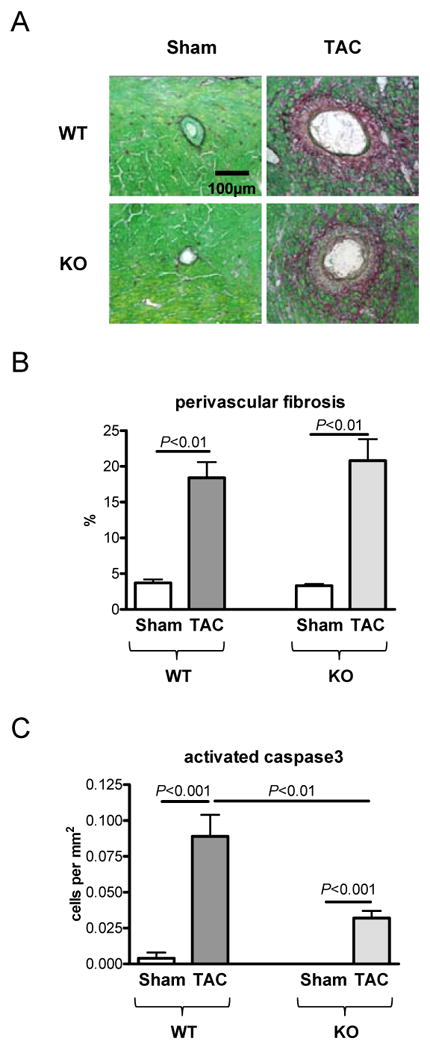
Role of CaMKIIδ-knockout in TAC induced hypertrophy (n=5 per group) 7 days after intervention; A) Histological sections of staining for fibrosis (Sirius Red); B) Statistical analysis of perivascular fibrosis; C) Rate of cardiomyocyte apoptosis by activated caspase3 staining
Discussion
The present study shows that for a comparable increase of mean total load, largely different molecular phenotypes develop with preload versus afterload, although the extent of cardiac hypertrophy is similar: 1) Increased afterload with TAC resulted in increased BNP expression, which is not seen by increased preload in Shunt during the first 7 days. 2) TAC resulted in concentric hypertrophy with increased fibrosis, inflammation and cardiomyocyte apoptosis, while eccentric hypertrophy in Shunt occurs without increased fibrosis, inflammation and less cardiomyocyte apoptosis. 3) TAC hypertrophy resulted in development of severe left ventricular dysfunction and higher mortality as compared to Shunt hypertrophy. 4) Signaling analysis showed that the hypertrophic phenotype in TAC is associated with persistent activation of CaMKII, and disturbed intracellular calcium cycling. None of these changes happened in Shunt, where Akt was persistently activated. 5) CaMKIIδ-KO mice and pharmacological CaMKII inhibition lead to normalisation of disturbed calcium cycling and reduced rate and of cardiomyocyte apoptosis. We conclude that afterload results in disturbed calcium cycling and calcium/CaMKII-activation and maladaptive hypertrophy while preload results in a more favourable hypertrophy through stretch-mediated activation of Akt.
Load and neurohormons regulate the function and phenotype characteristics of the myocardium. Afterload results in a concentric hypertrophic phenotype which was often viewed as being compensatory in nature because increased wall thickness reduces wall stress according to the law of Laplace. Preload results in eccentric hypertrophy. While earlier studies suggested that volume overload with uncompensated wall stress would be disadvantageous, more recent studies suggested volume overload to be associated with a more favourable remodeling compared to pressure overload.11,12 The present study shows that with identical wall stress myocardial structure, cardiac function and mortality are more favourable with Shunt compared to TAC. This suggests, that with a comparable elevation of wall stress by itself may be not a critical issue. Indeed, genetically modified mice with improved cardiac function and prognosis after TAC exhibited modified protein expression but absence of hypertrophic response.13 Thus the composition of the myocardium in response to increased load by compensation on a molecular level may be more relevant than the degree of hypertrophy, i.e. wall thickness.
We studied signaling at 24 hours, assuming that at this early time point load-mediated activation of signaling cascades and gene expression dominates over secondary effects like neurohumoral activation, and at 7 days to identify those signals being consistently activated by load. The maladaptive phenotype in TAC can be partially attributed to CaMKII signaling which is functionally associated with defective calcium cycling. Wang et al. previously suggested that afterload activates L-type calcium current.14,15 The present study indicates that increased L-type calcium current predominantly results from CaMKII activation because it can be reversed with CaMKII inhibition. Furthermore CaMKIIδ activation induces cardiomyocyte apoptosis in TAC as indicated by the reduced rate of cardiomyocyte apoptosis in the CaMKIIδ-KO animals. This confirms in vivo what has been suggested recently in an in vitro study showing that CaMKII inhibition prevented cardiomyocyte apoptosis following AngII-exposure of rat and mouse cardiomyocytes.16 Furthermore, the mechanistic relevance of CaMKII-dependent cardiomyocyte apoptosis for the development of the maladaptive hypertrophic phenotype is supported by previous data showing that in CaMKIIδ-KO mice progression to heart failure is reduced after TAC.17 Interestingly, in a previous study we showed reduced interstitial fibrosis in TAC in CaMKIIδ-KO mice at 3 weeks.10 This previous work also showed that CaMKIIδ-KO does not result in upregulation of other CaMK isoforms. This suggests that increased cardiomyocyte apoptosis may be a major component of CaMKII-mediated maladaptive hypertrophy during increased afterload. Interstitial fibrosis at later stages may reflect replacement fibrosis following cardiomyocyte apoptosis. But this data also suggests that early perivascular fibrosis (1 week) occurs independent from CaMKII activity, possibly related to inflammation.
In shunt-induced preload elevation, calcium cycling is normal and none of the afterload-related signals are activated. In contrast, Akt is activated, which is generally believed to promote a more adaptive hypertrophic phenotype.18 One may speculate that Akt could be activated by preload-mediated stretch of titin or related proteins involved in the sensing of preload.
Interestingly, ventricular BNP expression only occurs with increased afterload and not with elevated preload. This shows for the first time in vivo what has been suggested from previous in vitro studies.7,8 BNP may prevent a more pronounced hypertrophy in TAC.
Gene array analysis shows a largely different gene expression pattern between TAC and Shunt. Interestingly, 8 genes were significantly regulated in the opposite direction in both models. Amongst these, the phosphodiesterase 4D interacting protein (myomegalin) is upregulated in TAC and downregulated in Shunt. Myomegalin is localized in the z-disc,19 interacts with the phosphodiesterase 4D and is also involved in regulation of stress dependent nuclear trafficking of myopodin.20 Furthermore gene array pathway analysis confirms an activation of inflammation, fibrosis and cardiomyocyte apoptosis pathways in TAC (Table 3), whereas in Shunt selective activation of the Wnt-pathway is an interesting finding. The Wnt-pathway may influence eccentric hypertrophy via Akt, which was shown here to be consistently activated by phospho-protein analysis.21
MicroRNAs control expression of gene clusters. MicroRNA array analysis also identifies significant differences between both load models. These include absence of regulation of microRNAs 133, 30, 208 in Shunt, which are regulated in TAC and associated with hypertrophy and fibrosis.22,23,24 Furthermore microRNA 208 expression is necessary for ß-MHC upregulation after TAC.23 Here microRNA 208b upregulation is paralleled by ß-MHC-upregulation. MicroRNA 140*, 320 and 455 are regulated in Shunt but not in TAC. microRNA 140* and 320 have been described as upregulated in TAC22 or human heart failure25 and upregulation of microRNA 320 is associated with apoptosis.26 MicroRNA 455 is not described to be regulated in the heart previously. Interestingly microRNA regulation was not observed after 24 hours following surgery. This may suggest that microRNAs regulate later changes in gene expression during overload. Differentially regulated genes in TAC and Shunt support qualitative differences in both load forms and eliminate concerns that preload is just a milder stress than afterload. The mechanistic relevance of newly identified genes and pathways in load dependent cardiac hypertrophy is hypotheses generating and warrants further studies with differential consideration of pre- and afterload.
Pathophysiological and therapeutical implications
TAC is associated with inflammation, fibrosis and cardiomyocyte apoptosis which may impair myocardial function directly. Moreover, fibrosis may critically increase the diffusion distance of oxygen to mycocytes and thereby influence cardiac energetics and function.27 In Shunt, no inflammation and fibrosis was observed. There is a small level of apoptosis which may be the mechanism underlying late decline of cardiac function.28 The present data also suggest that increased load may require differential pharmacological interventions depending on the contribution of preload and afterload. With increased afterload such as it occurs in arterial hypertension or aortic stenosis, strategies to inhibit CaMKII signalling may be beneficial by reducing cardiomyocyte apoptosis. In diseases associated with increased preload, predominantly, such as mitral regurgitation or aortic regurgitation, CaMKII inhibition would not be a rational approach to treat this type of hypertrophy.
The present findings may also be relevant for the design of experimental studies. Many studies use the TAC model in genetically modified mice to study the influence of genes on increased load. One should now consider that the Shunt model may provide additional information.29,30 Furthermore, load experiments in isolated cardiomyocytes are frequently performed by flex membrane stretching of cells. Under those circumstances, it should be taken into account that stretch of cardiomyocytes may have completely different effects depending on its occurrence in diastole where it elevates preload or in systole where it elevates afterload.
Clinical impact.
Hemodynamic load regulates myocardial function and gene expression. Increased load triggers molecular, structural and functional remodeling and eventually heart failure. Increased LV load either acts as preload due to left to right shunt or aortic or mitral regurgitation or as increased afterload due to aortic stenosis or arterial hypertension.
In the present study, different cardiac gene expression, signaling and remodeling with preload or afterload was studied in mice with aorto-caval shunt (preload) or transversal aortic constriction (afterload) with matched mean total wall stresses. Here we show that increased afterload results in maladaptive hypertrophy with increased fibrosis, inflammation, cardiomyocyte apoptosis, development of heart failure and increased mortality Increased preload results in a more favorable hypertrophy without increased fibrosis and inflammation, less apoptosis and better survival. Ventricular BNP expression is only increased with afterload but not with preload. Gene expression and signal pathways differ considerably with preload and afterload. Calcium/calmodulin kinase IIδ mediated signaling may be the dominant maladaptive pathway in pressure overload, while activation of the Akt pathway may be dominant in volume overload.
The data indicate that differential therapeutic strategies should be developed to address the specific signaling pathways activated with preload versus afterload. This may prevent or delay the development of heart failure in patients with increased preload or afterload, respectively.
Supplementary Material
Acknowledgments
We are grateful to Brigitte Korff and Thomas Sowa for excellent technical assistance.
Sources of Funding: This work was supported by the Deutsche Forschungsgemeinschaft (grant Klinische Forschergruppe (KFO) 155: TP1,3,4,5,7,8 (KO 1872/2-1 to G.H.; SE 1117/1-1 to T.S.; LE 1313/2-1 to S.E.L; MA 1982/2-2 to L.S.M; EN 84/21-1 to K.S.; LI 690/7-2 to W.A.L), NIH grant HL085098 (L.J.F.), Emmy-Noether Program (BA2258-2-1 to J.B.) and EUGeneHeart (project number LSHM-CT-2005-018833). Dr. Maier is also funded by a DFG-Heisenberg grant (MA 1982/4-1) and the Fondation Leducq Award to the Alliance for Calmodulin-Kinase Signaling in Heart Disease.
Footnotes
Disclosures: none
References
- 1.Grossman W, Jones D, McLaurin LP. Wall stress and patterns of hypertrophy in the human left ventricle. J Clin Invest. 1975;56:56–64. doi: 10.1172/JCI108079. [DOI] [PMC free article] [PubMed] [Google Scholar]
- 2.Frank D, Kuhn C, Katus HA, Frey N. The sarcomeric Z-disc: a nodal point in signalling and disease. J Mol Med. 2006;84:446–68. doi: 10.1007/s00109-005-0033-1. [DOI] [PubMed] [Google Scholar]
- 3.Linke WA. Sense and stretchability: the role of titin and titin-associated proteins in myocardial stress-sensing and mechanical dysfunction. Cardiovasc Res. 2008;77:637–48. doi: 10.1016/j.cardiores.2007.03.029. [DOI] [PubMed] [Google Scholar]
- 4.von Lewinski D, Stumme B, Fialka F, Luers C, Pieske B. Functional relevance of the stretch-dependent slow force response in failing human myocardium. Circ Res. 2004;94:1392–8. doi: 10.1161/01.RES.0000129181.48395.ff. [DOI] [PubMed] [Google Scholar]
- 5.Norton JM. Toward consistent definitions for preload and afterload. Adv Physiol Educ. 2001;25:53–61. doi: 10.1152/advances.2001.25.1.53. [DOI] [PubMed] [Google Scholar]
- 6.Buitrago M, Lorenz K, Maass AH, Oberdorf-Maass S, Keller U, Schmitteckert EM, Ivashchenko Y, Lohse MJ, Engelhardt S. The transcriptional repressor Nab1 is a specific regulator of pathological cardiac hypertrophy. Nat Med. 2005;11:837–44. doi: 10.1038/nm1272. [DOI] [PubMed] [Google Scholar]
- 7.Kögler H, Schott P, Toischer K, Milting H, Nguyen van P, Kohlhaas M, Grebe C, Kassner A, Domeier E, Teucher N, Seidler T, Knöll R, Maier LS, El-Banayosy A, Körfer R, Hasenfuss G. Relevance of brain natriuretic peptide in preload-dependent regulation of cardiac sarcoplasmic reticulum Ca2+ ATPase expression. Circulation. 2006;113:2724–2732. doi: 10.1161/CIRCULATIONAHA.105.608828. [DOI] [PubMed] [Google Scholar]
- 8.Toischer K, Kögler H, Tenderich G, Grebe C, Seidler T, Nguyen Van P, Jung K, Knöll R, Körfer R, Hasenfuss G. Elevated Afterload, Neuroendocrine Stimulation, and Human Heart Failure Increase BNP Levels and Inhibit Preload-Dependent SERCA Upregulation. Circ Heart Fail. 2008;1:265–271. doi: 10.1161/CIRCHEARTFAILURE.108.785279. [DOI] [PubMed] [Google Scholar]
- 9.Maier LS, Bers DM. Role of Ca2+/calmodulin-dependent protein kinase (CaMK) in excitation-contraction coupling in the heart. Cardiovasc Res. 2007;73:631–40. doi: 10.1016/j.cardiores.2006.11.005. [DOI] [PubMed] [Google Scholar]
- 10.Backs J, Backs T, Neef S, Kreusser MM, Lehmann LH, Patrick DM, Grueter CE, Qi X, Richardson JA, Hill JA, Katus HA, Bassel-Duby R, Maier LS, Olson EN. The delta isoform of CaM kinase II is required for pathological cardiac hypertrophy and remodeling after pressure overload. Proc Natl Acad Sci U S A. 2009;106:2342–7. doi: 10.1073/pnas.0813013106. [DOI] [PMC free article] [PubMed] [Google Scholar]
- 11.Opie LH, Commerford PJ, Gersh BJ, Pfeffer MA. Controversies in ventricular remodelling. Lancet. 2006;367:356–67. doi: 10.1016/S0140-6736(06)68074-4. [DOI] [PubMed] [Google Scholar]
- 12.Linzbach AJ. Heart failure from the point of view of quantitative anatomy. Am J Cardiol. 1960;5:370–82. doi: 10.1016/0002-9149(60)90084-9. [DOI] [PubMed] [Google Scholar]
- 13.Hill JA, Karimi M, Kutschke W, Davisson RL, Zimmerman K, Wang Z, Kerber RE, Weiss RM. Cardiac hypertrophy is not a required compensatory response to short-term pressure overload. Circulation. 2000;101:2863–9. doi: 10.1161/01.cir.101.24.2863. [DOI] [PubMed] [Google Scholar]
- 14.Wang Y, Tandan S, Cheng J, Yang C, Nguyen L, Sugianto J, Johnstone JL, Sun Y, Hill JA. Ca2+/calmodulin-dependent protein kinase II-dependent remodeling of Ca2+ current in pressure overload heart failure. J Biol Chem. 2008;283:25524–32. doi: 10.1074/jbc.M803043200. [DOI] [PMC free article] [PubMed] [Google Scholar]
- 15.Wang Z, Kutschke W, Richardson KE, Karimi M, Hill JA. Electrical remodeling in pressure-overload cardiac hypertrophy: role of calcineurin. Circulation. 2001;104:1657–63. doi: 10.1161/hc3901.095766. [DOI] [PubMed] [Google Scholar]
- 16.Palomeque J, Rueda OV, Sapia L, Valverde CA, Salas M, Petroff MV, Mattiazzi A. Angiotensin II-induced oxidative stress resets the Ca2+ dependence of Ca2+-calmodulin protein kinase II and promotes a death pathway conserved across different species. Circ Res. 2009;105:1204–12. doi: 10.1161/CIRCRESAHA.109.204172. [DOI] [PubMed] [Google Scholar]
- 17.Ling H, Zhang T, Pereira L, Means CK, Cheng H, Gu Y, Dalton ND, Peterson KL, Chen J, Bers D, Heller Brown J. Requirement for Ca2+/calmodulin-dependent kinase II in the transition from pressure overload-induced cardiac hypertrophy to heart failure in mice. J Clin Invest. 2009;119:1082–5. doi: 10.1172/JCI38022. [DOI] [PMC free article] [PubMed] [Google Scholar]
- 18.Shiojima I, Walsh K. Regulation of cardiac growth and coronary angiogenesis by the Akt/PKB signaling pathway. Genes Dev. 2006;20:3347–65. doi: 10.1101/gad.1492806. [DOI] [PubMed] [Google Scholar]
- 19.Verde I, Pahlke G, Salanova M, Zhang G, Wang S, Coletti D, Onuffer J, Jin SL, Conti M. Myomegalin is a novel protein of the golgi/Myomegalin is a novel protein of the golgi/centrosome that interacts with a cyclic nucleotide phosphodiesterase. J Biol Chem. 2001;276:11189–98. doi: 10.1074/jbc.M006546200. [DOI] [PubMed] [Google Scholar]
- 20.Faul C, Dhume A, Schecter AD, Mundel P. Protein kinase A, Ca2+/calmodulin-dependent kinase II, and calcineurin regulate the intracellular trafficking of myopodin between the Z-disc and the nucleus of cardiac myocytes. Mol Cell Biol. 2007;27:8215–27. doi: 10.1128/MCB.00950-07. [DOI] [PMC free article] [PubMed] [Google Scholar]
- 21.Blankesteijn WM, van de Schans VA, ter Horst P, Smits JF. The Wnt/frizzled/GSK-3 beta pathway: a novel therapeutic target for cardiac hypertrophy. Trends Pharmacol Sci. 2008;29:175–80. doi: 10.1016/j.tips.2008.01.003. [DOI] [PubMed] [Google Scholar]
- 22.Sayed D, Hong C, Chen IY, Lypowy J, Abdellatif M. MicroRNAs play an essential role in the development of cardiac hypertrophy. Circ Res. 2007;100:416–24. doi: 10.1161/01.RES.0000257913.42552.23. [DOI] [PubMed] [Google Scholar]
- 23.van Rooij E, Sutherland LB, Qi X, Richardson JA, Hill J, Olson EN. Control of stress-dependent cardiac growth and gene expression by a microRNA. Science. 2007;316:575–9. doi: 10.1126/science.1139089. [DOI] [PubMed] [Google Scholar]
- 24.Carè A, Catalucci D, Felicetti F, Bonci D, Addario A, Gallo P, Bang ML, Segnalini P, Gu Y, Dalton ND, Elia L, Latronico MV, Høydal M, Autore C, Russo MA, Dorn GW, 2nd, Ellingsen O, Ruiz-Lozano P, Peterson KL, Croce CM, Peschle C, Condorelli G. MicroRNA-133 controls cardiac hypertrophy. Nat Med. 2007;13:613–8. doi: 10.1038/nm1582. [DOI] [PubMed] [Google Scholar]
- 25.Thum T, Galuppo P, Wolf C, Fiedler J, Kneitz S, van Laake LW, Doevendans PA, Mummery CL, Borlak J, Haverich A, Gross C, Engelhardt S, Ertl G, Bauersachs J. MicroRNAs in the human heart: a clue to fetal gene reprogramming in heart failure. Circulation. 2007;116:258–67. doi: 10.1161/CIRCULATIONAHA.107.687947. [DOI] [PubMed] [Google Scholar]
- 26.Ren XP, Wu J, Wang X, Sartor MA, Qian J, Jones K, Nicolaou P, Pritchard TJ, Fan GC. MicroRNA-320 is involved in the regulation of cardiac ischemia/reperfusion injury by targeting heat-shock protein 20. Circulation. 2009;119:2357–66. doi: 10.1161/CIRCULATIONAHA.108.814145. [DOI] [PMC free article] [PubMed] [Google Scholar]
- 27.Kai H, Kuwahara F, Tokuda K, Imaizumi T. Diastolic dysfunction in hypertensive hearts: roles of perivascular inflammation and reactive myocardial fibrosis. Hypertens Res. 2005;28:483–90. doi: 10.1291/hypres.28.483. [DOI] [PubMed] [Google Scholar]
- 28.Dent MR, Das S, Dhalla NS. Alterations in both death and survival signals for apoptosis in heart failure due to volume overload. J Mol Cell Cardiol. 2007;43:726–32. doi: 10.1016/j.yjmcc.2007.09.001. [DOI] [PubMed] [Google Scholar]
- 29.Chaturvedi RR, Herron T, Simmons R, Shore D, Kumar P, Sethia B, Chua F, Vassiliadis E, Kentish JC. Passive Stiffness of Myocardium From Congenital Heart Disease and Implications for Diastole. Circulation. 2010;121:979–88. doi: 10.1161/CIRCULATIONAHA.109.850677. [DOI] [PubMed] [Google Scholar]
- 30.Zheng J, Chen Y, Pat B, Dell'italia LA, Tillson M, Dillon AR, Powell PC, Shi K, Shah N, Denney T, Husain A, Dell'Italia LJ. Microarray identifies extensive downregulation of noncollagen extracellular matrix and profibrotic growth factor genes in chronic isolated mitral regurgitation in the dog. Circulation. 2009;119:2086–95. doi: 10.1161/CIRCULATIONAHA.108.826230. [DOI] [PMC free article] [PubMed] [Google Scholar]
Associated Data
This section collects any data citations, data availability statements, or supplementary materials included in this article.


