

Abstract
The N-terminal matrix (MA) domain of the HIV-1 Gag protein is responsible for binding to the plasma membrane of host cells during viral assembly. The putative membrane-binding interface of MA was previously mapped by means of mutagenesis and analysis of its trimeric crystal structure. However, the orientation of MA on membranes has not been directly determined by experimental measurements. We present neutron reflectivity measurements that resolve the one-dimensional scattering length density profile of MA bound to a biomimetic of the native viral membrane. A molecular refinement procedure was developed using atomic structures of MA to determine the orientation of the protein on the membrane. The orientation defines a lipid-binding interface consistent with previous mutagenesis results. The MA protein maintains this orientation without the presence of a myristate group, driven only by electrostatic interactions. Furthermore, MA is found to penetrate the membrane headgroup region peripherally such that only the side chains of specific Lys and Arg residues interact with the surface. The results suggest that electrostatic interactions are sufficient to favorably orient MA on viral membrane mimics. The spatial determination of the membrane-bound protein demonstrates the ability of neutron reflectivity to discern orientation and penetration under physiologically relevant conditions.
Introduction
The association of peripheral membrane proteins to lipid bilayers is accomplished by a variety of molecular mechanisms, including the insertion of nonpolar components into the hydrophobic core of membranes, specific lipid-binding sites, and electrostatic interactions with charged membrane surfaces. The conformation and spatial orientation of these peripheral proteins with respect to the membrane surface are important for their function; however, it can be difficult to experimentally identify the membrane-protein interface from solution structures. Techniques such as electron spin resonance, x-ray reflectivity, fluorescence, and solid-state NMR have been developed to study such systems (1–3). Neutron reflectivity (NR) is emerging as another powerful method that can potentially provide unique structural details in molecular assemblies of peripheral membrane proteins with fluid bilayers.
As an example, the HIV-1 Gag polyprotein must target and self-assemble on the surface of the plasma membrane as a crucial step in viral assembly. Gag is composed of several functional domains—the matrix (MA), capsid (CA), nucleocapsid (NC), and p6 domains—as observed from the N-terminus to the C-terminus. The MA domain is responsible for membrane binding (4). A bipartite mechanism is implicated in both membrane association and selectivity for the plasma membrane. This mechanism includes a hydrophobic myristate anchor that is cotranslationally attached to the N-terminus of the protein and is believed to insert into the membrane (5–7). In addition, a patch of basic residues forms attractive electrostatic interactions with anionic membrane lipids (6,8,9). In fact, the viral lipodome is enriched in anionic lipids compared to the average plasma membrane (10,11).
In the cytoplasm, the myristate group is thought to be sequestered in a hydrophobic pocket within the MA domain and to be switched to an exposed state under specific conditions (12–14). It has been reported that trimerization of MA triggers myristate exposure in solution (13). Moreover, MA trimers have also been observed for the two-dimensional (2D) crystallization of proteins in the presence of lipids (15). Further structural and biochemical evidence indicates a specific interaction of MA with phosphatidylinositol 4,5-bisphosphate (PI(4,5)P2), a lipid species that is predominantly located on the plasma membrane (11,14,16,17). Residues contained within the cationic patch on the MA domain are thought to bind to PI(4,5)P2 and induce myristate exposure through an allosteric switch mechanism (14).
In vitro binding studies of purified full-length Gag and purified MA domains to membranes yielded conflicting results regarding the dominant mechanism. Fluorescence assays and sedimentation studies showed that unmyristoylated Gag and MA constructs bind anionic liposomes with μmol/L affinities (18,19), and only a modest increase is provided by myristoylation. On the other hand, myristoylated Gag showed an affinity for raft-forming lipids (20), consistent with studies indicating that Gag assembly is specific to detergent-resistant lipid domains (21–23). However, recent flotation assays showed that binding of monomeric MA was several orders of magnitude weaker than previously reported, and the myristoylated MA (+myrMA) construct had 10-fold greater binding affinity than nonmyristoylated MA (−myrMA) (24). Engineered MA dimers believed to favor myristate exposure indeed showed stronger binding to charged membranes than did MA monomers. However, binding affinities to neutral membranes were as low as for MA monomers, suggesting that both electrostatics and avidity effects are important in this interaction. Moreover, the affinity of Gag for PI(4,5)P2 is larger than for phosphatidylserine (17). The discrepancies in these results highlight the need to investigate MA at the membrane interface in greater molecular detail.
In this work, the electrostatic contribution to MA binding to membranes is investigated by structural characterization of the interaction of −myrMA with a model membrane system. A tethered bilayer lipid membrane (tBLM) system (25) was used as a mimic of the viral membrane, in which a thiolated lipid, WC14, tethers the membrane to a gold film on a solid substrate. The sparse surface coverage of the WC14 tethers leads to the formation of a lipid membrane that is separated from the support by a nanometer-thin, highly hydrated layer. We recently showed that the diffusivity of phospholipids in the leaflet distal to the solid support is indistinguishable from that in vesicle membranes (26).
The tBLM system was composed of 30% anionic phosphatidylserine and 70% neutral lipids. This confers a negative charge density similar to that found in the native viral membrane, but lacks the full complexity of the HIV lipodome (10,11). The molecular details of protein penetration and orientation on the membrane were resolved by NR. This was achieved by interpreting the data in a composition-space approach (27–29) that takes advantage of the known solution NMR structure of the protein (14). We applied a global optimization method combined with a Monte Carlo error analysis to rigorously determine the uncertainties in the model parameters and the resulting neutron scattering length density (SLD) attributed to the membrane and the associated protein. This global optimization technique was implemented in a customized version of the software suite ga_refl (30), provided by the NIST Center for Neutron Research.
Materials and Methods
Materials
1,2-Dimyristoyl-sn-glycero-3-phosphocholine (DMPC), 1,2-dimyristoyl-sn-glycero-3-phospho-L-serine (DMPS), and cholesterol purified from ovine wool were obtained in powder form from Avanti Polar Lipids (Alabaster, AL). Synthesis and purification of the tethering compound WC14 were performed as described previously (25). β-Mercaptoethanol (β-ME; Sigma-Aldrich, St. Louis, MO) was distilled before use. D2O was obtained from Cambridge Isotopes Laboratory (Andover, MA), and H2O was obtained with the use of a Millipore (Billerica, MA) UHQ reagent-grade water purification system. Polished [100]-Si wafers (75 mm in diameter) were obtained from EL-CAT (Waldwick, NJ).
Sample preparation
The protocols used for protein expression and purification of the HIV-1 −myrMA protein can be found in the Supporting Material. Silicon wafers were coated with ≈20 Å Cr adhesion layers and ≈150 Å Au films by high-energy magnetron sputtering (Auto A306; BOC Edwards, UK). The resulting Au layers had ±3% uniformity in thickness and ≈5 Å root mean-square surface roughness (25,31). Self-assembled monolayers of the WC14 lipid tether compound were produced by immersing the gold-coated wafers in ethanolic solutions of 0.2 mmol/L of WC14/β-ME at a 30:70 mol% ratio with ≈6 h of incubation.
tBLMs were formed by the rapid solvent exchange procedure as described elsewhere (25,32). To prepare the organic lipid solution for rapid solvent exchange, DMPC and cholesterol were readily dissolved in ethanol at 10 mg/mL, and DMPS was dissolved at the same concentration in methanol/H2O/chloroform 94:5:1 by volume. Stock solutions of the pure lipid were mixed to achieve the desired molar ratio.
Neutron reflection data acquisition and analysis
NR (33,34) measurements were performed on the AND/R (35) and NG1 reflectometers at the NIST Center for Neutron Research. A momentum transfer, qz, range between 0.008 and 0.250 Å−1 was accessed in most measurements. Typical measurements of tBLMs used three solvent isotopic contrasts consisting of aqueous buffer prepared using D2O, H2O, or 2:1 D2O/H2O by volume (referred to as CM4). For each contrast, reasonable counting statistics were obtained after 6 h. The flow-through sample cell design allows for in situ buffer exchange on the instrument. An HIV-1 MA solution was prepared in an aqueous buffer of 50 mmol/L NaCl, 10 mmol/L NaPO4, pH 7.4, and 2 mmol/L Tris (2-carboxyethyl) phosphine as a reducing agent. Separate measurements of MA, first at 1 μmol/L and then at 10 μmol/L, were performed on the same tBLM preparation. The entire flow cell was maintained at 25°C.
Analysis of NR data was performed using the ga_refl software package, in which the reflectivity is computed with the Parratt formalism (36) applied to slab models representing the SLD profiles. Optimization of model parameters is achieved by the combined use of a genetic algorithm and a simplex amoeba algorithm for efficient searching of the parameter space, and a Levenberg-Marquardt nonlinear least-square algorithm to refine the fit. The quality of fit is reported as the reduced χ2. The ga_refl software package is capable of simultaneously fitting multiple data sets, including those involving different isotopic solvent contrast conditions. This allows certain model parameters, such as the solvent content in lipid and protein layers, to be directly determined. In general, all reflectivity data sets measured on the same wafer during the course of an experiment were fitted simultaneously, sharing fit parameters for the Si/SiOx/Cr/Au substrate.
A Monte Carlo error analysis procedure (29) was used to determine the SLD confidence limits by multiple resamplings of the reflectivity data based on the statistical errors of the individual data points. New sets of statistically independent data points were thus created and subsequently fitted to the same model. By generating a range of profiles and parameter values consistent with the measured data, we obtained a bias-free and objective estimate of the uncertainties of the resulting SLD profiles.
Protein contribution to the SLD profile
Four models of increasing refinement were used to analyze the reflectivity data:
-
1.
The one-box model is the simplest representation of the protein layer. It assumes that the protein can be modeled as a single homogenous slab of SLD normal to the membrane plane. The SLD of this homogeneous region is an average of the volume occupied by water and the volume occupied by the protein molecule. Individually, these two species can have very different SLDs. Therefore, the box thickness and volume fraction of the protein are modeled as free parameters during fitting.
-
2.
A protein with an asymmetric shape has a varying volumetric profile normal to the membrane plane at different distances from the membrane and will therefore vary in SLD along this direction. Therefore, a better representation is a series of thinner slabs that vary independently in protein volume fraction. This free-form model does not presuppose the protein SLD profile. Six slabs, each with a thickness of ≈15 Å, were used in this step of refinement.
-
3.
In a further step of refinement, the NMR structure of the MA domain (PDB access code: 2H3F) (14) was used to determine the protein contribution to the overall SLD profiles. The structural data set provides the relative spatial arrangement of all atoms in the protein in a fixed orientation with respect to the membrane.
-
4.
In the most refined model, we obtained the molecular association of the protein with the membrane in terms of orientation and intermolecular interaction with the lipid bilayer. To parameterize the MA orientation with respect to the membrane, rigid body rotations of the NMR structures were performed around the center of mass of the protein (ϑ and ϕ respectively define the polar rotation of a local axis, z′, associated with the protein against the surface normal, z, and the azimuthal rotation of the protein around z′ (Fig. S1)). The third Euler angle is irrelevant because the neutron reflection is invariant against rotational symmetry around the z-axis. As a starting point the putative binding orientation suggested by Hill et al. (37) was adopted to define ϑ = 0. The averaged NMR structure was then rotated about the z axis such that the long axis of α-helix II (residues 30–43) aligned with the x axis, thus defining ϕ = 0°.
The protein contribution to the scattering was determined by calculating the partial molecular volumes and the scattering length (SL) contained within slabs through the protein parallel to the interface in a given orientation. The solvent-excluded volume of the protein was calculated via a rolling-ball algorithm (38) using a solvent probe radius of 1.4 Å and the Connolly radius set for protein atoms (39). The SL and volumetric profiles were determined for each orientation from averages over the 20 MA conformations provided in the PDB data set.
To fit the NMR structure into the overall SLD profile, we performed a global optimization of all model parameters, including the protein Euler angles, membrane insertion depth, and total volume fraction at the membrane surface. The Monte Carlo error analysis implemented in ga_refl was extended to sample (ϑ, ϕ), thus generating a probability distribution of values consistent with the reflectivity data. (The commercial materials, equipment, and instruments identified in this work do not imply a recommendation or endorsement by the National Institute of Standards and Technology.)
Results
A single anionic lipid membrane tethered to a gold surface was formed with surface coverage of >99% as determined by a slab model analysis of the reflectivity data (Fig. S2). The initial question of whether −myrMA without its hydrophobic anchor interacts with the charged tBLM was immediately answered by the observation of a change in the measured reflectivity spectra. Fig. 1 shows the NR of the neat lipid bilayer in H2O and of the same bilayer upon incubation with −myrMA at two different concentrations of 1 μmol/L and 10 μmol/L. The full set of reflectivity spectra for all solvent contrasts is provided in Fig. S3. The spectra with protein show significant differences from those of the neat bilayer, which increase monotonically with protein concentration (Fig. 1, bottom).
Figure 1.

NR of a tBLM with increasing concentrations of −myrMA in H2O-based aqueous buffer. The reflection spectra are normalized to the Fresnel reflectivity (i.e., the reflectivity of a neat Si-buffer interface without interfacial roughness) to emphasize the interference patterns due to the interfacial structure. The bottom plot shows the error-weighted residuals of the tBLM reflectivities with protein to the reflectivity without protein. An increase in MA concentration leads to an approximately linear increase of the residuals.
Data interpretation was performed in successive steps of refinement (as described in the previous section), of which the procedure to determine protein orientation at the membrane was the most advanced. For all models, simultaneous fitting of nine data sets (i.e., three H2O/D2O solvent contrasts each for the neat tBLM and the tBLM in contact with solutions of MA domain at two different protein concentrations; see Fig. S3) was performed. By assuming that the underlying protein and membrane structure are invariant under isotopic substitution, we reduce the parameter uncertainties by simultaneously fitting to the complete set of reflectivity data.
A comparison of the best fits for the first three protein models (described above) to the 10 μmol/L MA data set is shown in Fig. 2 A. The bottom panel gives the residuals of the fits to the experimental data. The one-box model provides the poorest fit to the experimental data with χ2 = 3.37, whereas the free-form and NMR structure-based models show comparable fit qualities with χ2 = 2.31 and 2.35, respectively.
Figure 2.

NR and SLD profiles derived from different protein models compared for the data set for 10 μmol/L −myrMA in H2O-based buffer. (A) Best-fit reflectivity curves using the one-box, free-form, and NMR-based protein models (without rotational optimization). The bottom panel shows the error-weighted residuals of these models to the experimental data. (B) Resulting SLD profiles. The free-form profiles for the neat tBLM (gray) and bound MA domain (blue) are given with line widths representing 95.4% confidence intervals determined from the Monte Carlo resampling of the data. Best-fit profiles for one-box (yellow) and NMR-based (red) protein models are also shown. The illustration provides a molecular interpretation of the SLD profiles.
SLD profiles resulting from the fitting of the different models are shown in Fig. 2 B and tentatively interpreted in molecular terms by means of the overlaid molecular cartoon, drawn to scale, in the upper part of the panel. The Monte Carlo error analysis was applied to the free-form protein model, and the SLD line thicknesses indicate 95.4% (2σ) confidence intervals. The SLD profile of the neat tBLM (gray line in Fig. 2 B) is flat at the bulk solvent level in the region beyond the lipid headgroups. The width of the SLD profile in that region quantifies that the protein volume fraction near the interface can be determined to within ∼3%. Incubation of the neat tBLM with −myrMA generates a region of excess scattering near to the membrane surface (blue line in Fig. 2 B) and is interpreted as the bound protein layer. The free-form model clearly distinguishes two regions: one of greater protein density that is 32 Å in width, followed by a 20 Å thick layer of decreasing protein density adjacent to the bulk solvent region that, as the overlaid cartoon suggests, contains the flexible C-terminus of MA.
The best-fit parameters values of the free-form model are provided in Table 1. The per-leaflet hydrophobic thickness of the bilayer increases by 1 Å with the introduction of the MA protein. An increase of the MA concentration from 1 μmol/L to 10 μmol/L only results in twice the protein density at the surface. Despite this change in surface coverage, the thickness and profile of the MA protein layer do not change with concentration (Fig. S4), indicating a specific interaction and orientation of the protein with the membrane.
Table 1.
Best-fit parameters of the free-form model
| Parameter | Neat tBLM | 1 μmol/L MA domain | 10 μmol/L MA domain |
|---|---|---|---|
| d of tether (Å) | 20.9+0.9−0.4 | ||
| v.f. of tether | 0.760.02−0.00 | ||
| d of lipid (Å) | 14.9+0.1−0.6 | 15.9+0.5−0.7 | 15.6+0.5−0.7 |
| v.f. of proximal chain | 1.00+0.00−0.01 | 0.99+0.00−0.03 | 0.99+0.01−0.04 |
| v.f. of distal chain | 1.00+0.00−0.01 | 1.00+0.00−0.03 | 0.97+0.03−0.03 |
| v.f. of distal headgroup | 0.66+0.09−0.01 | 0.65+0.11−0.07 | 0.61+0.11−0.06 |
| v.f. of MA, box 1 | 0.01+0.10−0.01 | 0.12+0.07−0.05 | 0.25+0.08−0.06 |
| v.f. of MA, box 2 | 0.01+0.04−0.01 | 0.17+0.03−0.05 | 0.40+0.03−0.06 |
| v.f. of MA, box 3 | 0.01+0.03−0.01 | 0.10+0.04−0.03 | 0.23+0.10−0.06 |
| v.f. of MA, box 4 | 0.00+0.02−0.00 | 0.06+0.03−0.03 | 0.12+0.07−0.05 |
| v.f. of MA, box 5 | 0.03+0.02−0.03 | 0.03+0.02−0.03 | 0.10+0.05−0.06 |
| v.f. of MA, box 6 | 0.02+0.02−0.02 | 0.02+0.03−0.02 | 0.05+0.03−0.03 |
| Global-interfacial roughness (Å) | 3.4+0.0−0.5 | ||
In the table, d is the layer thickness and v.f. is the volume fraction of a particular molecular component within a layer. Because the models were insensitive to the following quantities, these values were taken as constants (not varied in the fit): thickness of the lipid headgroup, d = 9.5 Å; SLD of lipid chains, ρn = −0.37 × 10⁻⁶ Å−2; SLD of lipid headgroup, ρn = 1.8 × 10⁻⁶ Å−2; SLD of tether, ρn = 1.2 × 10⁻⁶ Å−2. The interfacial root mean-square roughness was assumed to be identical for all interfaces. Errors (shown as superscripts and subscripts) were determined by the Monte Carlo resampling procedure described in Materials and Methods.
The one-box model (Fig. 2 B, yellow line) is approximately an average of the free-form model box structure where the z axis box dimension of 40 Å truncates the tail region of the protein scattering profile. The atomistic model of MA (Fig. 2 B, red line) produces an SLD profile well within the confidence limits of the free-form profile, and is a better representation than the one-box model. Proteins at the membrane surface likely adopt an ensemble of thermally accessible configurational states of which NR reports only the average. The ensemble of 20 MA structures provided by the NMR data set was averaged to represent the thermal flexibility in protein conformation.
The NMR structure analysis indicates that the 20 Å tail region observed in the free-form fit of the protein profile derives from both the extended C-terminal helix and the adjacent flexible unstructured amino acid stretch. Furthermore, based on the maximal cross-section of MA in the given orientation (786 Å2), the 10 μmol/L results suggest a 41% surface coverage of protein on the membrane.
In a subsequent level of model refinement, the atomistic model of the MA protein allows us to explore the specificity to which the experimental results can be exploited to determine binding orientation. The ensemble of 20 NMR coordinates was aligned and reoriented with respect to the x,y plane as described in the Materials and Methods section. The orientation shown in Fig. 2 B is for (ϑ, ϕ) = (0°,0°). We calculated SL distributions and molecular volume profiles for distinct sets of (ϑ, ϕ), and carried out χ2 minimizations to the reflectivity data using a global optimization of all model parameters, including the two Euler angles. Monte Carlo error analysis (29) provided fits to a large set of resampled reflectivity data. This resulted in a 2D distribution of (ϑ, ϕ) pairs, all of which were consistent with the experimental measurements.
The Euler angle distribution is depicted as a contour plot in Fig. 3 A, which shows contour lines for the 68.2%, 95.4%, and 99.6% confidence intervals, each representing the probability that the protein orientation that best models the data is within that contour line. The probability densities at any given orientation are color-coded using a linear scale heat plot and shown in 3D representation in Fig. 3 B. The 68.2% contour line, representing the most probable orientations, is tightly centered at approximately (20°,110°). The 95.4% confidence contour defines an approximate 20° tolerance that includes the (0°,0°) orientation. Fig. 3 B shows that a majority of fits resulted in a localized set of orientations around (20°,110°), and a smaller percentage is centered at (0°,0°). Superimposing the rigid-body rotations of the NMR structures (Fig. 3 C) gives a visual impression of the orientation uncertainty. The ribbon representations of the protein have been color-coded to match the probability densities in Fig. 3, A and B. The distribution of protein orientations consistent with the experimental results are those in which the MA domain maintains an upright profile with the N-terminus near the membrane surface.
Figure 3.
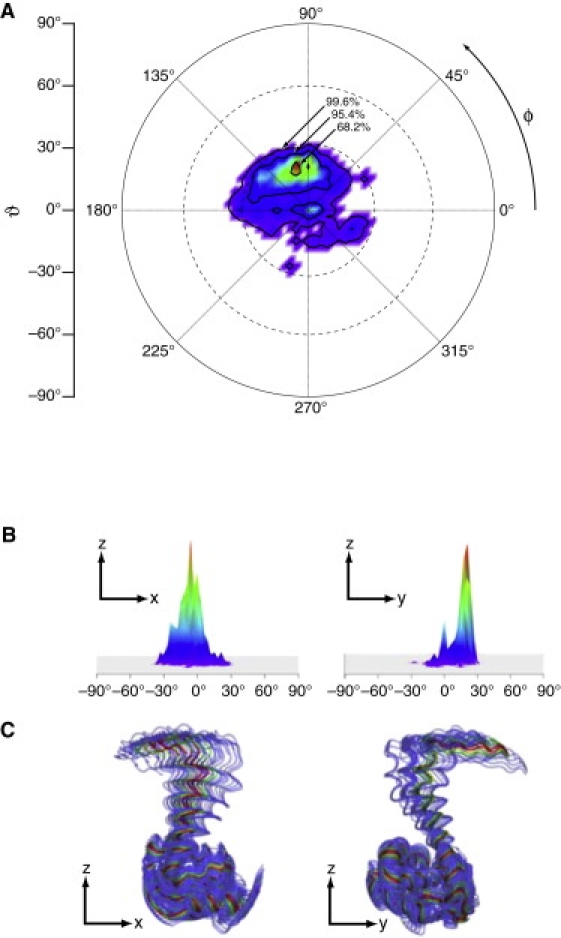
Determination from Monte Carlo resampling of the most probable orientations of membrane-bound −myrMA using the NMR structures to model protein contributions to the SLD profile. (A) Confidence intervals for the Euler angles (ϑ,ϕ) that define protein orientation. The colored heat plot is linearly scaled to the probability density of Monte Carlo-resampled fits that resulted in a particular orientation (where red represents the highest density and violet indicates the lowest). The 68.2% contour shows that a majority of fits fall within a narrow region localized around (ϑ,ϕ) = (20°,110°). (B) 3D perspectives of the probability density shown from the point of view facing the x,z-plane (left) and y,z-plane (right). (C) Projections of protein orientations onto the x,z plane (left) and y,z-plane (right). The membrane surface (not shown) is at the x,y plane. Protein structures are color-coded to match the contour.
The average penetration depth of the MA protein for all fits within the 95.4% contour was −4.8 ± 1.7 Å relative to the headgroup-solvent boundary. As shown in Fig. 4, this is consistent with a surface-associated protein. At this penetration depth, backbone atoms do not enter the membrane region, but amino acid side chains are still able to peripherally insert into the headgroup layer. Fig. 4 (inset) provides a molecular depiction of the MA protein on a membrane surface with a (20°,110°) binding orientation. Basic residues that are potentially important for membrane association are highlighted. Of these, residues R4, K26, K27, K30, K32, and R39 (yellow) show the greatest overlap with the headgroup layer, with a mean C-α distance of ∼5.7 Å from the headgroup boundary. Slightly more peripheral to the membrane surface are residues K15, K18, R20, and R22 on helix I and R43 (green) with a mean C-α distance of ∼14.1 Å. However, within the 99.6% confidence limits, protein orientations are also contained that would bring the residues on helix I into direct contact with the membrane. In distinction, two other basic residues at the base of helix V—K95 and K98—are clearly separated from the surface. Fig. 4 highlights the positions of these residues at the membrane within the overall SLD contribution of the MA domain. In addition to these charged residues, W36 is also in a position to interact with lipid headgroups, but this interaction depends on the rotameric state of its first side-chain dihedral.
Figure 4.

Penetration of the −myrMA domain into the lipid bilayer. The SLD profile of the protein is observed to overlap that of the bilayer by 4.8 ± 1.7 Å, such that MA makes molecular contacts with the tBLM only in the lipid headgroup region. Left axis: Overlap between the headgroup (solid line) and protein (dotted line) SLD profiles for the orientation corresponding to (ϑ,ϕ) = (20°,110°). Right axis: Distributions along z of the C-α atoms of charged amino acid side chains near the interface. The amino acid residues are color-coded according to their proximity to the membrane interface (see text). The frequencies of occurrence in Monte Carlo-resampled fits at a certain distance, z, from the bilayer center are plotted for these groups. (Inset) Molecular model of −myrMA in the (ϑ,ϕ) = (20°,110°) orientation at the membrane surface, with charged residues highlighted in the same color code used for the C-α distributions.
We performed a rough estimate of the electrostatic interactions between the protein and the anionic membrane surface that was based on Gouy-Chapman theory (see the Supporting Material for details). A 2D contour plot of the resulting electrostatic energy landscape, shown in Fig. S5, has a distinctive minimum near (ϑ, ϕ) = (20°,80°). This is in good qualitative agreement with the reflectivity results of Fig. 3 A. We are aware that for a quantitative analysis, a full Poisson-Boltzmann treatment with atomistic representations of both MA protein and the membrane would be required to accurately capture the electrostatic interactions (24,40,41). However, as we show in the Supporting Material, the simplified Gouy-Chapman model already indicates that the protein orientation at the membrane determined from NR closely resembles that which minimized the electrostatic energy.
Discussion
This work demonstrates the ability of NR to characterize the lipid-bound state of membrane proteins in molecular details. Although it is intrinsically a low-resolution method, the information content of the NR results can be dramatically enhanced by refinement of the data using atomistic detail from NMR or x-ray structures of the protein. This methodology yields structural details of molecular complexes at the membrane interface that cannot be determined by either of the structural characterization techniques alone. The results presented here demonstrate for the first time, to our knowledge, that the global optimization approach reveals structural details (i.e., the orientation of the protein at the interface, its penetration into the lipid bilayer, and its surface density at the membrane) that are not accessible in more conventional NR data evaluation strategies. Exploiting high-resolution protein structures in the interpretation of the envelope SLD profiles increases the information that can be drawn from NR measurements.
The MA protein of HIV-1 presents several advantages as a model system, particularly for the characterization of binding orientations by NR. Specificity is augmented by the C-terminal helix that protrudes from the globular head of MA, providing an asymmetric distribution of protein density normal to the membrane surface. Furthermore, an initial guess regarding orientation can be derived from biochemical studies that suggest a lipid-binding interface. Finally, extensive structural characterization by NMR and x-ray crystallography indicate that the core lipid-binding domain of HIV-1 MA is largely structurally invariant under different conditions. Thus, the available high-resolution solution structures are likely to be valid for application in the refinement of NR data.
Understanding the mechanism that underlies HIV-1 Gag membrane binding requires structural characterization of the protein at the lipid bilayer. A wealth of previous findings, including the trimeric crystal structure of MA (37), the interaction of the N-terminal myristate and the basic residue patch with the membrane, and the relationship between PI(4,5)P2 lipid and myristate exposure (8,9,13,14,24), has led to a model of MA membrane association. The assumed orientation of MA at the membrane is one in which the N-terminal myristate inserts into the bilayer and the basic residues encompassed by helices I and II make intimate contact with the lipid headgroups. Prior to this study, however, there has been no direct structural determination of the orientation of MA on bilayers. A previous electron microscopy (EM) study of MA associated with lipid monolayers provided a low-resolution (37 Å) density profile normal to the membrane (15). However, orientations of individual MA molecules cannot be resolved at that resolution. Moreover, the orientation provided by the trimeric MA model, although consistent with the EM data, was not shown to be exclusive.
The rigorous modeling of the binding orientation of MA presented in Fig. 3 provides a molecular description of the protein-membrane binding interface and strongly suggests that the association is electrostatically driven (see Fig. S5). Overall, the protein is found to peripherally associate with the bilayer, allowing only amino acid side chains of specific residues to penetrate into the lipid headgroup region, as depicted in Fig. 4. The basic residue patch interacts intimately with the membrane. Of interest, included among the residues involved in this interaction are K26 and K27, which have been shown to interact with PI(4,5)P2 headgroups in solution (14). Furthermore, the interaction of residue R4 with the membrane suggests that the N-terminal myristate group is in close proximity to the membrane surface as well.
The molecular detail of the electrostatic binding interface that emerges from this work is valid for the −myrMA protein only. One cannot rule out the possibility that myristate insertion or PI(4,5)P2 binding alters the orientation of the MA protein and/or its penetration into the bilayer. However, given the localization of the residues described above near the surface, it is reasonable to expect that the orientation does not change significantly. More likely, these interactions further lock MA into a singular position, out of a larger family of electrostatically driven orientations observed here, resulting in an even narrower orientation distribution. In the future, we will conduct investigations of +myrMA and tBLMs containing PI(4,5)P2 to test this hypothesis.
The spatial association of the MA domain with the membrane indicates that the protein is peripherally bound by electrostatic interactions. Our estimates of the electrostatic contribution to MA orientation shown in Fig. S5 find the lowest energy contours in agreement with the NR results of Fig. 3. These interactions are probably not sufficiently strong to anchor the protein at the membrane in a stable fashion during native virion formation. Mutations to residues within the basic domain disrupt plasma membrane targeting and can lead to retargeting to alternate intracellular membranes (6,8,9,42). To achieve a stable association, additional binding interactions are probably required. For example, viral replication fails in the absence of the myristate, and fluorescence assays reveal non-myristoylated Gag proteins that have relocated to the cytosol or other intracellular membranes. It should be noted, however, that other C-type retroviruses lack the myristate modification, and presumably rely only on electrostatic interactions for membrane association (40,41).
It remains unclear whether MA protein is organized into trimers on the membrane in the native virus. Therefore, the question of MA orientation, which we address in this work, is indeed relevant. In the case of full-length Gag, where CA domain drives crystallization, a well-defined lattice has been observed in the CA (but not the MA) region in the immature virion (43). Furthermore, the hexagonal lattice of CA was found to be incomplete, with numerous imperfections, suggesting that the overlying MA layer is less well ordered (43). NR is not sensitive to in-plane organization, such as the formation of multiple oligomeric states. However, one in-plane parameter, the surface coverage, is determined in the refinement process and can be compared with other reported values. At the highest concentration of MA protein used here, the area per molecule of 1920 Å2 determined from the best-fit model corresponds to 41% surface coverage if compared with the maximum molecular cross-section of 786 Å2 observed in the NMR structure. In contrast, packing density estimates based on EM investigations of 2D MA crystals formed on lipid monolayers (44) lead to an average area per molecule of 1310 Å2 in a hexameric lattice. The surface density of MA is likely even higher in the immature virion, where an area per Gag molecule of 1150 Å2 was found (45). This would correspond to 68% surface coverage in our model description. Although the method is sensitive to packing density, whether MA proteins are monodisperse or clustered to form hexameric lattices cannot be determined by specular reflectivity. However, this information can be gleaned from other biochemical methods and incorporated into our refinement procedure.
Conclusions
Protein crystallography and high-resolution NMR structure determination have helped shape our understanding of molecular details in biology. In this work we went further to reveal the structure of a protein associated with a membrane. Because membranes are intrinsically disordered, 3D crystallographic techniques cannot be used to solve such structures. However, reflectometry is a suitable tool to derive 1D projections of supramolecular aggregates at high resolution. A new, to our knowledge, global optimization method (including refinement with atomistic structures) and the simultaneous fitting of multiple data sets provided a molecular picture of MA associated with the lipid membrane. The simplified lipid system used here allowed for a direct probe of electrostatics in the targeting of MA to lipid membranes. The NR results and electrostatic energy calculations both place the locations of the myristoyl group and PI(4,5)P2 binding sites adjacent to the membrane surface. In concert, electrostatic interaction, PI(4,5)P2 binding, and bilayer insertion of the myristoyl acyl chain are all required to bind the MA protein stably to the membrane, but they may occur in a hierarchical manner. The systematic introduction of other lipid species in experiments like the ones described here, and a comparison of the binding of +myrMA and other variants of MA to membranes should provide additional insights.
The tBLM system combined with NR provides a well-controlled environment for monitoring biochemical processes such as protein membrane binding. The ability to discern protein orientation on the membrane suggests that this technique may be useful for following large-scale conformational changes of proteins as well. In situ access to the solvent layer allows for more complex experiments, such as the introduction of cellular cofactors to protein-membrane systems, to be conducted. The combined use of NR and the tBLM system provides a powerful methodology to recapitulate specific steps in viral assembly and characterize them structurally at the membrane interface.
Acknowledgments
We thank Dr. Paul Kienzle for his help with software implementation, and Drs. Charles Majkrzak and Joseph Dura for fruitful discussions and help with instrumentation. We thank the National Institute of Standards and Technology for providing the neutron research facilities used in this research.
This work was supported by the U.S. Department of Commerce through the MSE program (70NANB8H8009), the National Institutes of Health (NIH; 1P01 AG032131), and the American Health Assistance Foundation (A2008-307). It was also supported in part by the Intramural Research Program of the Center for Cancer Research, National Cancer Institute, NIH. This study utilized the high-performance computational capabilities of the Biowulf Linux cluster at the NIH, Bethesda, MD (http://biowulf.nih.gov).
Supporting Material
References
- 1.Malmberg N.J., Falke J.J. Use of EPR power saturation to analyze the membrane-docking geometries of peripheral proteins: applications to C2 domains. Annu. Rev. Biophys. Biomol. Struct. 2005;34:71–90. doi: 10.1146/annurev.biophys.34.040204.144534. [DOI] [PMC free article] [PubMed] [Google Scholar]
- 2.Chen C.-H., Málková S., Schlossman M.L. Configuration of PKCα-C2 domain bound to mixed SOPC/SOPS lipid monolayers. Biophys. J. 2009;97:2794–2802. doi: 10.1016/j.bpj.2009.08.037. [DOI] [PMC free article] [PubMed] [Google Scholar]
- 3.Tatulian S.A., Qin S., He X. Positioning membrane proteins by novel protein engineering and biophysical approaches. J. Mol. Biol. 2005;351:939–947. doi: 10.1016/j.jmb.2005.06.080. [DOI] [PubMed] [Google Scholar]
- 4.Bukrinskaya A. HIV-1 matrix protein: a mysterious regulator of the viral life cycle. Virus Res. 2007;124:1–11. doi: 10.1016/j.virusres.2006.07.001. [DOI] [PubMed] [Google Scholar]
- 5.Bryant M., Ratner L. Myristoylation-dependent replication and assembly of human immunodeficiency virus 1. Proc. Natl. Acad. Sci. USA. 1990;87:523–527. doi: 10.1073/pnas.87.2.523. [DOI] [PMC free article] [PubMed] [Google Scholar]
- 6.Zhou W.J., Parent L.J., Resh M.D. Identification of a membrane-binding domain within the amino-terminal region of human immunodeficiency virus type 1 Gag protein which interacts with acidic phospholipids. J. Virol. 1994;68:2556–2569. doi: 10.1128/jvi.68.4.2556-2569.1994. [DOI] [PMC free article] [PubMed] [Google Scholar]
- 7.Spearman P., Horton R., Kuli-Zade I. Membrane binding of human immunodeficiency virus type 1 matrix protein in vivo supports a conformational myristyl switch mechanism. J. Virol. 1997;71:6582–6592. doi: 10.1128/jvi.71.9.6582-6592.1997. [DOI] [PMC free article] [PubMed] [Google Scholar]
- 8.Freed E.O., Englund G., Martin M.A. Role of the basic domain of human immunodeficiency virus type 1 matrix in macrophage infection. J. Virol. 1995;69:3949–3954. doi: 10.1128/jvi.69.6.3949-3954.1995. [DOI] [PMC free article] [PubMed] [Google Scholar]
- 9.Ono A., Orenstein J.M., Freed E.O. Role of the Gag matrix domain in targeting human immunodeficiency virus type 1 assembly. J. Virol. 2000;74:2855–2866. doi: 10.1128/jvi.74.6.2855-2866.2000. [DOI] [PMC free article] [PubMed] [Google Scholar]
- 10.Brügger B., Glass B., Kräusslich H.G. The HIV lipidome: a raft with an unusual composition. Proc. Natl. Acad. Sci. USA. 2006;103:2641–2646. doi: 10.1073/pnas.0511136103. [DOI] [PMC free article] [PubMed] [Google Scholar]
- 11.Chan R., Uchil P.D., Wenk M.R. Retroviruses human immunodeficiency virus and murine leukemia virus are enriched in phosphoinositides. J. Virol. 2008;82:11228–11238. doi: 10.1128/JVI.00981-08. [DOI] [PMC free article] [PubMed] [Google Scholar]
- 12.Zhou W., Resh M.D. Differential membrane binding of the human immunodeficiency virus type 1 matrix protein. J. Virol. 1996;70:8540–8548. doi: 10.1128/jvi.70.12.8540-8548.1996. [DOI] [PMC free article] [PubMed] [Google Scholar]
- 13.Tang C., Loeliger E., Summers M.F. Entropic switch regulates myristate exposure in the HIV-1 matrix protein. Proc. Natl. Acad. Sci. USA. 2004;101:517–522. doi: 10.1073/pnas.0305665101. [DOI] [PMC free article] [PubMed] [Google Scholar]
- 14.Saad J.S., Miller J., Summers M.F. Structural basis for targeting HIV-1 Gag proteins to the plasma membrane for virus assembly. Proc. Natl. Acad. Sci. USA. 2006;103:11364–11369. doi: 10.1073/pnas.0602818103. [DOI] [PMC free article] [PubMed] [Google Scholar]
- 15.Alfadhli A., Barklis R.L., Barklis E. HIV-1 matrix organizes as a hexamer of trimers on membranes containing phosphatidylinositol-(4,5)-bisphosphate. Virology. 2009;387:466–472. doi: 10.1016/j.virol.2009.02.048. [DOI] [PMC free article] [PubMed] [Google Scholar]
- 16.Ono A., Ablan S.D., Freed E.O. Phosphatidylinositol (4,5) bisphosphate regulates HIV-1 Gag targeting to the plasma membrane. Proc. Natl. Acad. Sci. USA. 2004;101:14889–14894. doi: 10.1073/pnas.0405596101. [DOI] [PMC free article] [PubMed] [Google Scholar]
- 17.Chukkapalli V., Hogue I.B., Ono A. Interaction between the human immunodeficiency virus type 1 Gag matrix domain and phosphatidylinositol-(4,5)-bisphosphate is essential for efficient gag membrane binding. J. Virol. 2008;82:2405–2417. doi: 10.1128/JVI.01614-07. [DOI] [PMC free article] [PubMed] [Google Scholar]
- 18.Bouamr F., Scarlata S., Carter C. Role of myristylation in HIV-1 Gag assembly. Biochemistry. 2003;42:6408–6417. doi: 10.1021/bi020692z. [DOI] [PubMed] [Google Scholar]
- 19.Ehrlich L.S., Fong S., Carter C. Partitioning of HIV-1 Gag and Gag-related proteins to membranes. Biochemistry. 1996;35:3933–3943. doi: 10.1021/bi952337x. [DOI] [PubMed] [Google Scholar]
- 20.Provitera P., El-Maghrabi R., Scarlata S. The effect of HIV-1 Gag myristoylation on membrane binding. Biophys. Chem. 2006;119:23–32. doi: 10.1016/j.bpc.2005.08.008. [DOI] [PubMed] [Google Scholar]
- 21.Nguyen D.H., Hildreth J.E. Evidence for budding of human immunodeficiency virus type 1 selectively from glycolipid-enriched membrane lipid rafts. J. Virol. 2000;74:3264–3272. doi: 10.1128/jvi.74.7.3264-3272.2000. [DOI] [PMC free article] [PubMed] [Google Scholar]
- 22.Ono A., Freed E.O. Plasma membrane rafts play a critical role in HIV-1 assembly and release. Proc. Natl. Acad. Sci. USA. 2001;98:13925–13930. doi: 10.1073/pnas.241320298. [DOI] [PMC free article] [PubMed] [Google Scholar]
- 23.Lindwasser O.W., Resh M.D. Multimerization of human immunodeficiency virus type 1 Gag promotes its localization to barges, raft-like membrane microdomains. J. Virol. 2001;75:7913–7924. doi: 10.1128/JVI.75.17.7913-7924.2001. [DOI] [PMC free article] [PubMed] [Google Scholar]
- 24.Dalton A.K., Ako-Adjei D., Vogt V.M. Electrostatic interactions drive membrane association of the human immunodeficiency virus type 1 Gag MA domain. J. Virol. 2007;81:6434–6445. doi: 10.1128/JVI.02757-06. [DOI] [PMC free article] [PubMed] [Google Scholar]
- 25.McGillivray D.J., Valincius G., Lösche M. Molecular-scale structural and functional characterization of sparsely tethered bilayer lipid membranes. Biointerphases. 2007;2:21–33. doi: 10.1116/1.2709308. [DOI] [PubMed] [Google Scholar]
- 26.Shenoy S., Moldovan R., Loesche M. In-plane homogeneity and lipid dynamics in tethered bilayer lipid membranes (tBLMs) Soft Matter. 2010;6:1263–1274. doi: 10.1039/B919988H. [DOI] [PMC free article] [PubMed] [Google Scholar]
- 27.Wiener M.C., King G.I., White S.H. Structure of a fluid dioleoylphosphatidylcholine bilayer determined by joint refinement of x-ray and neutron diffraction data. I. Scaling of neutron data and the distributions of double bonds and water. Biophys. J. 1991;60:568–576. doi: 10.1016/S0006-3495(91)82086-0. [DOI] [PMC free article] [PubMed] [Google Scholar]
- 28.Vaknin D., Als-Nielsen J., Lösche M. Recognition processes at a functionalized lipid surface observed with molecular resolution. Biophys. J. 1991;60:1545–1552. doi: 10.1016/S0006-3495(91)82189-0. [DOI] [PMC free article] [PubMed] [Google Scholar]
- 29.Heinrich F., Ng T., Lösche M. A new lipid anchor for sparsely tethered bilayer lipid membranes. Langmuir. 2009;25:4219–4229. doi: 10.1021/la8033275. [DOI] [PubMed] [Google Scholar]
- 30.Kienzle, P. A., M. Doucet, …, C. F. Majkrzak. 2000–2009. ga_refl software. http://www.ncnr.nist.gov/reflpak.
- 31.McGillivray D.J., Valincius G., Kasianowicz J.J. Structure of functional Staphylococcus aureusα-hemolysin channels in tethered bilayer lipid membranes. Biophys. J. 2009;96:1547–1553. doi: 10.1016/j.bpj.2008.11.020. [DOI] [PMC free article] [PubMed] [Google Scholar]
- 32.Cornell B.A., Braach-Maksvytis V.L.B., Pace R.J. A biosensor that uses ion-channel switches. Nature. 1997;387:580–583. doi: 10.1038/42432. [DOI] [PubMed] [Google Scholar]
- 33.Thomas R.K. Neutron reflection from liquid interfaces. Annu. Rev. Phys. Chem. 2004;55:391–426. doi: 10.1146/annurev.physchem.54.011002.103830. [DOI] [PubMed] [Google Scholar]
- 34.Krueger S. Neutron reflection from interfaces with biological and biomimetic materials. Curr. Opin. Colloid Interface Sci. 2001;6:111–117. [Google Scholar]
- 35.Dura J.A., Pierce D., White S.H. AND/R: a neutron diffractometer/reflectometer for investigation of thin films and multilayers for the life sciences. Rev. Sci. Instrum. 2006;77:074301. doi: 10.1063/1.2219744. [DOI] [PMC free article] [PubMed] [Google Scholar]
- 36.Parratt L.G. Surface studies of solids by total reflection of x-rays. Phys. Rev. 1954;95:359–369. [Google Scholar]
- 37.Hill C.P., Worthylake D., Sundquist W.I. Crystal structures of the trimeric human immunodeficiency virus type 1 matrix protein: implications for membrane association and assembly. Proc. Natl. Acad. Sci. USA. 1996;93:3099–3104. doi: 10.1073/pnas.93.7.3099. [DOI] [PMC free article] [PubMed] [Google Scholar]
- 38.Lee B., Richards F.M. The interpretation of protein structures: estimation of static accessibility. J. Mol. Biol. 1971;55:379–400. doi: 10.1016/0022-2836(71)90324-x. [DOI] [PubMed] [Google Scholar]
- 39.Connolly M.L. Solvent-accessible surfaces of proteins and nucleic acids. Science. 1983;221:709–713. doi: 10.1126/science.6879170. [DOI] [PubMed] [Google Scholar]
- 40.Murray P.S., Li Z., Murray D. Retroviral matrix domains share electrostatic homology: models for membrane binding function throughout the viral life cycle. Structure. 2005;13:1521–1531. doi: 10.1016/j.str.2005.07.010. [DOI] [PubMed] [Google Scholar]
- 41.Dalton A.K., Murray P.S., Vogt V.M. Biochemical characterization of Rous sarcoma virus MA protein interaction with membranes. J. Virol. 2005;79:6227–6238. doi: 10.1128/JVI.79.10.6227-6238.2005. [DOI] [PMC free article] [PubMed] [Google Scholar]
- 42.Freed E.O., Orenstein J.M., Martin M.A. Single amino acid changes in the human immunodeficiency virus type 1 matrix protein block virus particle production. J. Virol. 1994;68:5311–5320. doi: 10.1128/jvi.68.8.5311-5320.1994. [DOI] [PMC free article] [PubMed] [Google Scholar]
- 43.Briggs J.A.G., Riches J.D., Kräusslich H.G. Structure and assembly of immature HIV. Proc. Natl. Acad. Sci. USA. 2009;106:11090–11095. doi: 10.1073/pnas.0903535106. [DOI] [PMC free article] [PubMed] [Google Scholar]
- 44.Alfadhli A., Huseby D., Barklis E. Human immunodeficiency virus type 1 matrix protein assembles on membranes as a hexamer. J. Virol. 2007;81:1472–1478. doi: 10.1128/JVI.02122-06. [DOI] [PMC free article] [PubMed] [Google Scholar]
- 45.Briggs J.A.G., Johnson M.C., Vogt V.M. Cryo-electron microscopy reveals conserved and divergent features of gag packing in immature particles of Rous sarcoma virus and human immunodeficiency virus. J. Mol. Biol. 2006;355:157–168. doi: 10.1016/j.jmb.2005.10.025. [DOI] [PubMed] [Google Scholar]
Associated Data
This section collects any data citations, data availability statements, or supplementary materials included in this article.